A near-infrared study of the multi-phase outflow in the type-2 quasar J1509+0434
Abstract
Based on new near-infrared spectroscopic data from the instrument EMIR on the 10.4 m Gran Telescopio Canarias (GTC) we report the presence of an ionized and warm molecular outflow in the luminous type-2 quasar J150904.22+043441.8 (z = 0.1118). The ionized outflow is faster than its molecular counterpart, although the outflow sizes that we derive for them are consistent within the errors (1.340.18 kpc and 1.460.20 kpc respectively). We use these radii, the broad emission-line luminosities and in the case of the ionized outflow, the density calculated from the trans-auroral [OII] and [SII] lines, to derive mass outflow rates and kinetic coupling efficiencies. Whilst the ionized and warm molecular outflows represent a small fraction of the AGN power (0.033% and 0.0001% of Lbol respectively), the total molecular outflow, whose mass is estimated from an assumed warm-to-cold gas mass ratio of 6, has a kinetic coupling efficiency of 1.7%Lbol. Despite the large uncertainty, this molecular outflow represents a significant fraction of Lbol and it could potentially have a significant impact on the host galaxy. In addition, the quasar spectrum reveals bright and patchy narrow Pa emission extending out to 4″ (8 kpc) South-East and North-West from the active nucleus.
keywords:
galaxies: active – galaxies: nuclei – galaxies: quasars.1 Introduction
Active galactic nuclei (AGN) can affect the interstellar medium of their host galaxies by consuming, heating, sweeping out and/or disrupting the gas available to form new stars (Fabian, 2012; Peng et al., 2015). Indeed, semi-analytic models and simulations of galaxy formation require this feedback from the AGN for quenching star formation therefore producing realistic numbers of massive galaxies (Springel et al., 2005; Croton et al., 2006). However, many observations reveal quasar-driven outflows with radial sizes 1–3 kpc when seeing-smearing effects are accounted for (Husemann et al., 2016; Fischer et al., 2018; Tadhunter et al., 2018) and the outflow kinetic powers measured for AGN of different luminosities vary by four orders of magnitude (0.001–10% of Lbol; Harrison et al. 2018). The impact of the observed outflows on their host galaxies is thus far from having been constrained.
The problem is that the contribution from the different gas phases entrained in the winds have not been determined in unbiased and representative AGN samples (Cicone et al., 2018). This is primarily due to the reduced wavelength coverage of the observations, generally restricted to the optical. Other important sources of uncertainty are the assumptions needed to derive outflow properties such as mass rate and kinetic power (Harrison et al., 2018), generally used to compare with models and simulations.
Type-2 quasars (QSO2s; L10; Reyes et al. 2008) are excellent laboratories to search for outflows and study their influence in their host galaxies. This is because the emission lines produced in the broad line region (BLR) and the AGN continuum are obscured by nuclear dust, making it easier to detect broad lines associated with the outflows and study the stellar populations of the host galaxies. In Ramos Almeida et al. (2017) we demonstrated the feasibility of near-infrared (NIR) spectroscopy to characterize QSO2 outflows in the ionized and warm molecular phases of the gas. We found that the outflow properties were different from those derived using optical data and gas phase dependent, as previously claimed by Rupke & Veilleux (2013). This implies that all single-phase estimates of outflow properties provide an incomplete view of AGN feedback (Fiore et al., 2017; Cicone et al., 2018). The NIR range does not only include emission lines tracing ionized and warm molecular gas, but it is less affected by extinction (A) and permits to reach lower seeing values than the optical. In spite of this, the NIR spectrum of nearby QSO2s remains practically unexplored (Rupke & Veilleux, 2013; Villar Martín et al., 2015; Ramos Almeida et al., 2017).

We report high spectral resolution (R4000) K-band spectroscopy of the QSO2 SDSS J150904.22+043441.8 (also IRAS F15065+0446 and hereafter J1509) obtained with the instrument Espectrógrafo Multiobjeto Infra-Rojo (EMIR) on the 10.4 m Gran Telescopio Canarias (GTC). This is a nearby QSO2 (z = 0.1118) from the catalogue of Reyes et al. (2008), having an [O III] luminosity of 10 (Lbol=4.9 erg s-1 using the bolometric correction of Heckman et al. 2004). It is a luminous IR galaxy (LIRG) according to its total IR luminosity log(L)=11.6 (Sargsyan et al., 2011) and the Sloan Digital Sky Survey (SDSS) broad-band optical images show a disrupted galaxy morphology that could be indicative of a past galaxy interaction/merger.
Throughout this letter we assume a cosmology with H0=71 km s-1 Mpc-1, =0.27, and =0.73. At the distance of the galaxy (DL=515 Mpc) the spatial scale is 2.017 kpc arcsec-1.
2 GTC/EMIR observations
J1509 was observed with the NIR multi-slit spectrograph EMIR (Garzón et al., 2006, 2014), installed at the Naysmith-A focal station of the 10.4 m GTC at the Roque de los Muchachos Observatory, in La Palma. EMIR is equipped with a 20482048 Teledyne HAWAII-2 HgCdTe NIR-optimized chip with a pixel size of 0.2″. We obtained a K-band (2.03–2.37 µm) spectrum during the night of 2018 June 28th in service mode (Proposal GTC77-18A; PI: Ramos Almeida). The airmass during the observation was 1.26–1.38, the observing conditions were photometric and we estimated the seeing value by averaging the full-width at half maximum (FWHM) of eleven stars in the combined J-band acquisition image (0.760.07″). This is consistent with the FWHM=0.8″ measured from the K-band spectrum of the A0 star HD 142346, observed after the science target to allow flux calibration and telluric correction. The slit width used during the observations was 0.8″, allowing a spectral resolution of 85 km s-1 at 2.1 µm. The instrumental width measured from the OH sky lines is 5.80.2 Å with a dispersion of 1.71 Å pixel-1. Slit losses were minimal (5% as estimated from the A0 star spectrum) thanks to the good seeing and photometric conditions during the observation. J1509 was observed for a total on-source integration time of 1920 s following a nodding pattern ABBA. The two nodding positions were separated by 30″ and the slit was oriented along PA=-16, centred on the galaxy nucleus and following the extended emission observed in the color-combined optical SDSS image of the galaxy. The data were reduced using the lirisdr software within the IRAF enviroment. Consecutive pairs of AB two-dimensional spectra were subtracted to remove the sky background. Resulting frames were then wavelength-calibrated and flat-fielded before registering and co-adding all frames to provide the final spectra. The wavelength calibration was done using the HgAr, Ne and Xe lamps available. From the sky spectrum we measured a wavelength calibration error of 8.33 km s-1.
3 Results
3.1 Nuclear spectrum
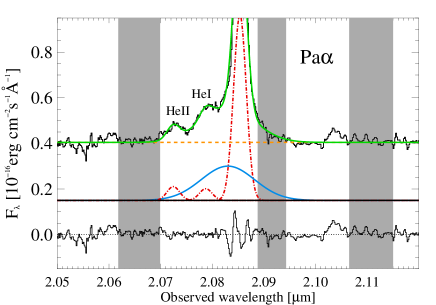
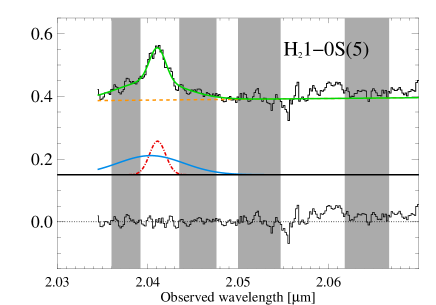
In order to study the nuclear emission of J1509 we extracted a spectrum in an aperture of 0.8″ (1.61 kpc), centred at the peak of the continuum emission. It was then flux-calibrated and corrected from atmospheric transmission by using the A0V star spectrum and the IRAF task telluric. The spectrum reveals several emission lines tracing different phases of the gas (see Fig. 1). We detect the low-ionization lines Pa, Br, HeII1.8637µm, HeI1.8691µm and tentatively HeI2.0587µm. We also detect the high-ionization/coronal line [SiIV]1.9634µm (ionization potential = 166.7 eV) and all the molecular lines from H2 1-0S(5) to 1-0S(1). These H2 lines trace warm molecular gas (T1000 K), which is only a small fraction of the total molecular gas content (Dale et al., 2005; Emonts et al., 2017). The H21-0S(3) line is partially blended with [SiVI].
The emission lines were fitted with Gaussian profiles using the Starlink package DIPSO. We used the minimum number of Gaussians necessary to correctly reproduce the line profiles leaving a flat residual (see Fig. 2). The ionized lines show a narrow component of 400–450 km s-1, typical of the narrow-line region (NLR), whilst those of the molecular lines are slightly narrower (300-350 km s-1). Resulting FWHMs, velocity shifts (Vs) and fluxes are reported in Table 1. The FWHMs are corrected from instrumental broadening and Vs are relative to the central wavelength of the Pa narrow component ( = 20853.520.64 Å), from which we determine a redshift of z = 0.111820.00003. Uncertainties in Vs include the wavelength calibration error and individual fit uncertainties provided by DIPSO. Flux errors were determined by adding quadratically the flux calibration error (5% estimated from the A0 star) and the fit uncertainties.
In the case of Pa, Br, [SiVI] and all the five H2 lines detected in our nuclear spectrum, two Gaussians are needed to reproduce their asymmetric line profiles. One corresponds to the narrow component and the other to a blueshifted broad component that might be the approaching side of a biconical outflow (see e.g. Crenshaw et al. 2010; Bae & Woo 2016). The latter are indicated with a (b) in Table 1 and as blue solid lines in Fig. 2. The FWHM of the blueshifted components measured for Pa is 1750175 km s-1, with Vs=-33570 km s-1. The same components are needed to reproduce the Br profile, of much lower intensity and partially blended with the blue wing of H21-0S(3). For this reason some of the input parameters were fixed to obtain a reliable fit (see Table 1).
For comparison with the NIR ionized lines we fitted the H and [OIII]5007 Å lines detected in the optical spectrum of J1509 publicly available from the SDSS data release 14 (Abolfathi et al., 2018). We measured a FWHM400 km s-1 for the narrow components of H and [O III]. The broad H component has a FWHM=1200100 km s-1 and it is blueshifted by 44580 km s-1 from the central wavelength of the narrow component. For the [OIII] line we fitted a broad component of FWHM=150020 km s-1, blueshifted by 35010 km s-1. Thus, despite the different scales probed by the optical and NIR data (the SDSS spectrum corresponds to an aperture of 3″ in diameter) we find consistent results. The [SiVI] line detected in our NIR spectrum also shows a blueshifted broad component of FWHM=1450300 km s-1 which indicates that the highly-ionized gas is also outflowing. This broad component is less blueshifted (-100 km s-1), although with relatively large uncertainty due to the blend with the H2 line, than the low-ionization broad components, as we also found for the Teacup galaxy (Ramos Almeida et al., 2017). In the optical spectrum we find a blueshifted broad component of FWHM=1270200 km s-1 for the coronal line [FeVII]6087 Å (IP=99.1 eV), consistent within the errors with the FWHM of [SiVI]. Finally, we detect broad components in the warm molecular lines. These broad components have FWHMs1300 km s-1 and are blueshifted by 100 km s-1 relative to narrow Pa. For the majority of the H2 lines we had to fix the input parameters of the broad component to obtain good fits (see Table 1), but these blueshifted broad components are necessary to reproduce the line profiles and produce flat residuals (see the right panel of Fig. 2). A significant fraction of the warm molecular gas is also outflowing.
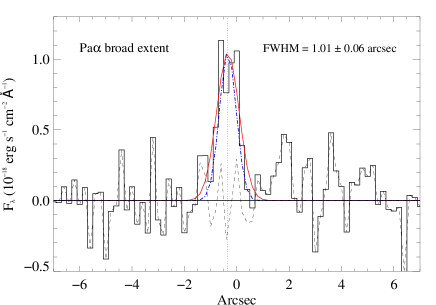
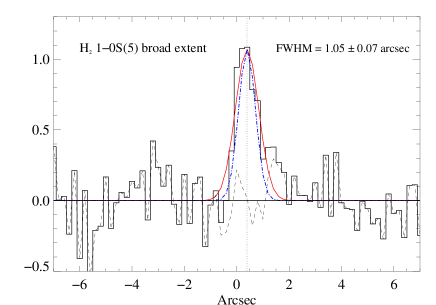
In order to constrain the spatial extent of the outflows we followed the methodology employed in Rose et al. (2018). We averaged spatial slices of the blue and red wings of the broad lines detected in the nuclear spectrum, avoiding the wavelength range covered by the corresponding narrow emission line and any other adjacent emission lines (e.g. the low-intensity helium lines blended with the blue wing of Pa; see Fig. 2). We did the same for spatial slices blueward and redward of the broad emission line, averaged them and subtracted from the broad line emission. By doing this we derive continuum-free spatial profiles of the gas in the outflow, so we can fit them with a Gaussian to measure FWHMobs (see Fig. 3). We consider the outflow resolved if
| (1) |
Finally we subtracted the seeing FWHM in quadrature to derive the outflow size
| (2) |
Using the red wing of the Pa line we find that the ionized outflow in J1509 is barely resolved, and we measure FWHMout=1.340.18 kpc. For the molecular outflow we used the S(5) and S(1) lines, which have the highest S/N in our nuclear spectrum. In the case of S(1) the noisy continuum prevents a good determination of the continuum-free spatial profiles, but using the continuum-subtracted red and blue wings of the S(5) line (only red continuum available; see Fig. 2) we also find the molecular outflow to be barely resolved, with FWHMout=1.460.20 kpc. The errors were estimated by adding in quadrature the seeing error and the standard deviation of FWHMobs obtained from varying the wavelength range covered by the continuum and red and blue wings of the lines.
3.2 Extended emission
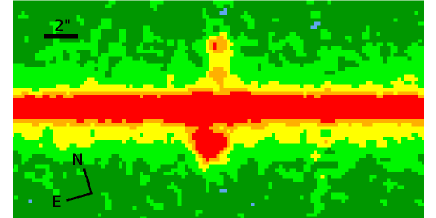
The slit was oriented following the morphological structures visible in the optical SDSS image of J1509 (PA=-16°). Our J-band acquisition image shows extended emission roughly in the same direction. The two-dimensional K-band spectrum reveals the bright and patchy extended Pa emission shown in Fig. 4. Towards the south-east (SE) we detect a bright and compact line-emitting blob peaking at 2.2″ (4.44 kpc) from the nucleus (as measured from the position of the maximum of the AGN continuum). The north-west (NW) extended Pa emission is patchy and it shows a bright knot at 3.4″ (6.86 kpc) from the AGN nucleus (see Fig. 4). We will refer to these regions as the SE and NW knots. In order to constrain the total extent of the narrow Pa emission we analyzed the line profiles detected in adjacent spectra extracted in apertures of 0.8″ at both sides of the nucleus (as measured from the maximum of Pa emission). We detect narrow Pa emission up to 4″ (8 kpc) SE and NW of the nucleus. We extracted two additional spectra of the same aperture (0.8″) centred at the peak of each knot. The Pa emission of the SE knot can be reproduced with a single Gaussian of FWHM110 km s-1 and centred practically at the same wavelength of the nuclear Pa narrow component. In the NW knot the line profile appears double-peaked due to the residuals of a sky line at 2.0857 but it can be fitted with a single Gaussian of FWHM120 km s-1 and redshifted by 60 km s-1 relative to the nuclear Pa narrow component (see Table 1). Thus, the extended gas kinematics provide no evidence for outflowing gas on this scales, despite the clear presence of warm ionized gas, although we cannot rule out the presence of low brightness outflow components (Spence et al., 2018).
| Nuclear spectrum | |||
| Line | FWHM | Vs | Line flux |
| (km s | (km s-1) | (erg cm-2 s-1) | |
| He II | 400 | 1849 | 1.860.41 |
| He I | 400 | 9165 | 1.580.49 |
| Pa | 40413 | 09 | 25.081.53 |
| Pa (b) | 1748175 | -33567 | 19.452.12 |
| Br | 400 | 8345 | 1.640.26 |
| Br (b) | 1783214 | -330 | 4.110.75 |
| 44876 | 2722 | 3.811.23 | |
| (b) | 1457324 | -99143 | 9.412.02 |
| H2 1-0S(5) | 29148 | 118 | 2.400.57 |
| H2 1-0S(5) (b) | 1265253 | -11059 | 5.600.81 |
| H2 1-0S(4) | 32752 | 2824 | 1.400.23 |
| H2 1-0S(4) (b) | 1300 | -100 | 0.140.24 |
| H2 1-0S(3) | 35931 | 2715 | 4.540.61 |
| H2 1-0S(3) (b) | 1300 | -100 | 6.511.74 |
| H2 1-0S(2) | 300 | 4336 | 1.220.30 |
| H2 1-0S(2) (b) | 1300 | -100 | 1.670.81 |
| H2 1-0S(1) | 34539 | 5719 | 5.350.86 |
| H2 1-0S(1) (b) | 1300 | -42116 | 6.311.49 |
| SE knot | |||
| Pa | 1129 | 78 | 6.590.35 |
| NW knot | |||
| Pa | 11812 | 579 | 1.990.15 |
4 Discussion and conclusions
We detect blueshifted broad components in different emission lines of the nuclear spectrum of the QSO2 J1509 that we identify with the approaching side of a biconical multi-phase outflow. Integral field observations are required to confirm this geometry. The characteristics of this outflowing gas are different in the ionized and warm molecular phases, highlighting the importance of this kind of studies to evaluate the impact of AGN feedback. The ionized outflow is faster (Vs=-330 km s-1) than the warm molecular outflow (V-100 km s-1). This is also the case for the obscured quasar F08572+3915:NW (L5.51045 erg s-1) studied by Rupke & Veilleux (2013) in the NIR using integral field spectroscopy and for which they reported blueshifted H2 gas velocities of up to -1700 km s-1 in the inner 400 pc of the quasar. These results are in contrast with what we found for the Teacup (Ramos Almeida et al., 2017), in which we detected the ionized outflow but not its molecular counterpart.
In order to evaluate the power of the ionized and warm molecular outflows we need to estimate accurate mass outflow rates (Ṁ) and kinetic powers (Ė). To do so, we first require a good estimate of the outflow density. Taking advantage of the optical SDSS spectrum of J1509 we can measure the total fluxes of the [SII]6716,6731 and [OII]3726,3729 doublets as well as of the trans-auroral [OII]7319,7331 and [SII]4068,4076 lines. By doing so we can determine the electron densities (ne) and reddening of the outflow region simultaneously, following the method described in Rose et al. (2018). The trans-auroral ratios F(3726+3729)/F(7319+7331) and F(4068+4076)/F(6717+6731) are sensitive to higher density gas than the classical [SII] and [OII] doublet ratios (Holt et al., 2011) and therefore more suitable for estimating outflow densities.
By comparing our measured [OII] and [SII] ratios (0.830.02 and -1.270.05) with a grid of photoionization models computed with CLOUDY (C13.04; Ferland et al. 2013), we obtain Log ne (cm-3) = 3.25 and E(B-V)=0.450.04. These values are consistent with those obtained by Rose et al. (2018) and Spence et al. (2018) using the same methodology employed here for a sample of 17 ULIRGs with nuclear activity, redshifts 0.04¡z¡0.2 and bolometric luminosities 43.4Log L46.3. It has been suggested that part of the outflow mass could be contained in lower density gas not traced by the trans-auroral lines (Sun et al., 2017), but high electron densities (Log n4.5) are also reported by Baron & Netzer (2019) for the outflows of nearby type-2 AGN using an independent method. We note that our value of ne is a lower limit on the outflow density because we used total fluxes instead of broad line fluxes which we could not fit for the trans-auroral lines, and the densities estimated from the two sets of broad [SII] and [OII] lines are always equal or higher than those obtained from the total line fluxes (Rose et al., 2018; Spence et al., 2018).
To calculate the ionized outflow mass rate (Ṁ) we used equations 1, 2 and 3 in Rose et al. (2018), ne, rout, vout (defined as the difference between the peak velocities of the broad and narrow component of each line reported in Table 1) and the reddening-corrected broad Pa flux. The latter was obtained using the E(B-V) calculated above for the outflow region and the Calzetti et al. (2000) reddening law (AK=0.180.02 mag). We derive an outflow mass M and Ṁ . The latter is at the lower end of the range of values reported by Rose et al. (2018) and Spence et al. (2018) for nearby ULIRGs. We note that outflow mass and derived quantities are upper limits because we consider ne to represent a lower limit on the true electron density (M=910 103.25/ne).
Using the H2 1-0S(3) and 1-0S(1) broad line fluxes and equations 2 and 3 in Martín-Hernández et al. (2008) we calculate an excitation temperature T 2000 K for the molecular gas in the outflow assuming local thermal equilibrium (LTE). Under these conditions we can use equation 1 in Emonts et al. (2017), the extinction-corrected 1-0S(1) flux and the luminosity distance of the QSO2 to estimate the molecular outflow mass. We obtain M=(1.00.2) M☉, which is a factor 90 lower than the mass in the ionized outflow. This difference between phases is considerably lower than the factor of 1600 reported by Rupke & Veilleux (2013) for the QSO2 F08572+3915:NW, for which they measured a molecular outflow mass of 5.2 M☉ and Ṁ=0.13 M. For J1509 we estimate Ṁ=0.001 M using the mass, vout and rout measured for the warm molecular outflow. We note that although J1509 and F08572+3915:NW have roughly the same bolometric luminosities, the latter is a ULIRG in an on-going merger system hosting one of the most extreme outflows detected in CO (Cicone et al., 2014).
As we mentioned in Section 3.1, the warm H2 component of the outflow is just a small fraction of the total molecular gas content. We can then use the warm-to-cold gas mass ratio of 6 measured for two nearby LIRGs with and without nuclear activity observed in the NIR and the sub-mm (Emonts et al., 2014; Pereira-Santaella et al., 2016) to infer the total molecular outflow gas mass in J1509. We obtain M=(1.70.4) M☉. This error does not include the large uncertainty in the assumed warm-to-cold gas ratio, which is yet scarcely measured in outflows. For comparison, Pereira-Santaella et al. (2018) reported ratios of (2.61.0)10-5 within the outflows of three nearby ULIRGs. These ratios lie at the upper end of values reported by Dale et al. (2005) for starburst galaxies and buried AGN (10-7–10-5). Fortunately, on-going ALMA CO observations of J1509 and other nearby QSO2s will soon permit us to quantify the cold molecular gas within the outflow and measure corresponding warm-to-cold gas ratios. If we calculate the outflow mass rate of J1509 using the total H2 mass we obtain Ṁ=23 M.
We note that all the previous estimates of M and Ṁ are quite conservative because we do not consider projection effects in the employed velocities (vout). More realistic values can be obtained by using maximum outflow velocities (vmax=v = -1200 and -750 km s-1 for the ionized and molecular outflow) as in Emonts et al. (2017). In this case we obtain Ṁ for the ionized outflow and 0.01 and 176 M for the warm and total molecular outflow. Finally, we can calculate the kinetic power of the ionized and molecular outflows as
| (3) |
with =FWHM/2.355. For the ionized outflow we measure Ė erg s-1. Dividing this value by Lbol estimated in Section 1 from the [OIII] luminosity we obtain F0.033%, which is the power of the outflow as a fraction of Lbol or the kinetic coupling efficiency. For the molecular outflow we calculate a kinetic power of Ėwarm=4.9 erg s-1, which represent 0.0001%Lbol. In principle, these low values of Fkin would indicate that neither of the two phases of the wind are very relevant in terms of energetics, even considering that only 20–30% of the outflow energy is kinetic according to simulations (Richings & Faucher-Giguère, 2018) and that a fraction of this energy is used to work against the gravitational potential. Taking this into account, only 0.5%Lbol would be transmitted to the ionized and molecular outflows that we are characterizing here (Harrison et al., 2018). However, if we estimate the total molecular mass in the outflow from the warm molecular mass and we use the same outflow radius and kinematics to work out the kinetic energy (Ė=8.2 erg s-1) we find F1.7% Lbol. Thus, the molecular outflow in J1509 represents a significant fraction of Lbol and it could potentially have a significant impact on the host galaxy. Despite the large uncertainty in the assumed warm-to-cold gas ratio, our value of 1.7%Lbol is in agreement with the coupling efficiencies derived from CO-based measurements of AGN of similar bolometric luminosities as J1509 (0.5–3%; Feruglio et al. 2015; Morganti et al. 2015).
We have demonstrated the feasibility of GTC/EMIR spectroscopy for deriving accurate multi-phase outflow properties and evaluate their potential impact on the host galaxy. The next step is targeting representative quasar samples to investigate how different galaxy properties (e.g. radio jets, shocks, morphologies) might be influencing the characteristics of the outflows and ultimately, how these outflows (i.e. AGN feedback) are affecting the host galaxies.
Based on observations made with the Gran Telescopio CANARIAS (GTC), instaled in the Spanish Observatorio del Roque de los Muchachos of the Instituto de Astrofísica de Canarias, in the island of La Palma. CRA acknowledges the Ramón y Cajal Program through project RYC-2014-15779 and the Spanish Plan Nacional de Astronomía y Astrofísica under grant AYA2016-76682-C3-2-P. CC acknowledges funding from the European Union’s Horizon 2020 research and innovation programme under the Marie Sklodowska-Curie grant agreement No 664931. CRA and CT thank F. Santoro for providing the CLOUDY grids necessary for calculating the electron density. We finally acknowledge the anonymous referee for useful comments and suggestions that enabled us to improve this work.
References
- Abolfathi et al. (2018) Abolfathi B., et al., 2018, ApJS, 235, 42
- Bae & Woo (2016) Bae H.-J., Woo J.-H., 2016, ApJ, 828, 97
- Baron & Netzer (2019) Baron D., Netzer H., 2019, arXiv e-prints,
- Calzetti et al. (2000) Calzetti D., Armus L., Bohlin R. C., Kinney A. L., Koornneef J., Storchi-Bergmann T., 2000, ApJ, 533, 682
- Cicone et al. (2014) Cicone C., et al., 2014, A&A, 562, A21
- Cicone et al. (2018) Cicone C., Brusa M., Ramos Almeida C., Cresci G., Husemann B., Mainieri V., 2018, Nature Astronomy, 2, 176
- Crenshaw et al. (2010) Crenshaw D. M., Schmitt H. R., Kraemer S. B., Mushotzky R. F., Dunn J. P., 2010, ApJ, 708, 419
- Croton et al. (2006) Croton D. J., et al., 2006, MNRAS, 365, 11
- Dale et al. (2005) Dale D. A., Sheth K., Helou G., Regan M. W., Hüttemeister S., 2005, AJ, 129, 2197
- Emonts et al. (2014) Emonts B. H. C., Piqueras-López J., Colina L., Arribas S., Villar-Martín M., Pereira-Santaella M., Garcia-Burillo S., Alonso-Herrero A., 2014, A&A, 572, A40
- Emonts et al. (2017) Emonts B. H. C., Colina L., Piqueras-López J., Garcia-Burillo S., Pereira-Santaella M., Arribas S., Labiano A., Alonso-Herrero A., 2017, A&A, 607, A116
- Fabian (2012) Fabian A. C., 2012, ARA&A, 50, 455
- Ferland et al. (2013) Ferland G. J., et al., 2013, Rev. Mex. Astron. Astrofis., 49, 137
- Feruglio et al. (2015) Feruglio C., et al., 2015, A&A, 583, A99
- Fiore et al. (2017) Fiore F., et al., 2017, A&A, 601, A143
- Fischer et al. (2018) Fischer T. C., et al., 2018, ApJ, 856, 102
- Garzón et al. (2006) Garzón F., et al., 2006, in Society of Photo-Optical Instrumentation Engineers (SPIE) Conference Series. p. 626918, doi:10.1117/12.671302
- Garzón et al. (2014) Garzón F., et al., 2014, in Ground-based and Airborne Instrumentation for Astronomy V. p. 91470U, doi:10.1117/12.2054804
- Harrison et al. (2018) Harrison C. M., Costa T., Tadhunter C. N., Flütsch A., Kakkad D., Perna M., Vietri G., 2018, Nature Astronomy, 2, 198
- Heckman et al. (2004) Heckman T. M., Kauffmann G., Brinchmann J., Charlot S., Tremonti C., White S. D. M., 2004, ApJ, 613, 109
- Holt et al. (2011) Holt J., Tadhunter C. N., Morganti R., Emonts B. H. C., 2011, MNRAS, 410, 1527
- Husemann et al. (2016) Husemann B., Scharwächter J., Bennert V. N., Mainieri V., Woo J.-H., Kakkad D., 2016, A&A, 594, A44
- Martín-Hernández et al. (2008) Martín-Hernández N. L., Esteban C., Mesa-Delgado A., Bik A., Puga E., 2008, A&A, 482, 215
- Morganti et al. (2015) Morganti R., Oosterloo T., Oonk J. B. R., Frieswijk W., Tadhunter C., 2015, A&A, 580, A1
- Peng et al. (2015) Peng Y., Maiolino R., Cochrane R., 2015, Nature, 521, 192
- Pereira-Santaella et al. (2016) Pereira-Santaella M., et al., 2016, A&A, 594, A81
- Pereira-Santaella et al. (2018) Pereira-Santaella M., et al., 2018, A&A, 616, A171
- Ramos Almeida et al. (2017) Ramos Almeida C., Piqueras López J., Villar-Martín M., Bessiere P. S., 2017, MNRAS, 470, 964
- Reyes et al. (2008) Reyes R., et al., 2008, AJ, 136, 2373
- Richings & Faucher-Giguère (2018) Richings A. J., Faucher-Giguère C.-A., 2018, MNRAS, 478, 3100
- Rose et al. (2018) Rose M., Tadhunter C., Ramos Almeida C., Rodríguez Zaurín J., Santoro F., Spence R., 2018, MNRAS, 474, 128
- Rupke & Veilleux (2013) Rupke D. S. N., Veilleux S., 2013, ApJ, 775, L15
- Sargsyan et al. (2011) Sargsyan L., Weedman D., Lebouteiller V., Houck J., Barry D., Hovhannisyan A., Mickaelian A., 2011, ApJ, 730, 19
- Spence et al. (2018) Spence R. A. W., Tadhunter C. N., Rose M., Rodríguez Zaurín J., 2018, MNRAS, 478, 2438
- Springel et al. (2005) Springel V., et al., 2005, Nature, 435, 629
- Sun et al. (2017) Sun A.-L., Greene J. E., Zakamska N. L., 2017, ApJ, 835, 222
- Tadhunter et al. (2018) Tadhunter C., et al., 2018, MNRAS, 478, 1558
- Villar Martín et al. (2015) Villar Martín M., Bellocchi E., Stern J., Ramos Almeida C., Tadhunter C., González Delgado R., 2015, MNRAS, 454, 439