Measurements and tests of hadronic interactions at ultra-high energies with the Pierre Auger Observatory
Abstract
Extensive air showers are complex objects, resulting of billions of particle reactions initiated by single cosmic ray at ultra-high-energy. Their characteristics are sensitive both to the mass of the primary cosmic ray and to the details of hadronic interactions. Many of the interactions that determine the shower features occur in kinematic regions and at energies beyond those tested by human-made accelerators.
We will report on the measurement of the proton-air cross section for particle production at a center-of-mass energy per nucleon of 39 TeV and 56 TeV. We will also show comparisons of post-LHC hadronic interaction models with shower data by studying the moments of the distribution of the depth of the electromagnetic maximum, the number and production depth of muons in air showers, and finally a parameter based on the rise-time of the surface detector signal, sensitive to the electromagnetic and muonic component of the shower. While there is good agreement found for observables based on the electromagnetic shower component, discrepancies are observed for muon-sensitive quantities.
1 Introduction
Interactions at a center of mass energy above those attained at the LHC are continuously happening in the upper layers of the Earth’s atmosphere. They occur when ultra high energy cosmic rays (UHECR) collide with air nuclei, creating thousands of secondaries that interact again and cascade down to the Earth’s surface, producing extensive air showers (EAS) of particles. Our current understanding of particle interactions at these gigantic energies relies on extrapolations made from accelerator data into the highest energies and the most forward region.
The Pierre Auger Observatory Auger2015 samples the EAS content at ground with a surface detector array (SD), consisting of 1600 water-Cherenkov stations arranged in a triangular grid of 1.5 km side, which spans over 3000 km2. In addition, there is also a denser array of 60 stations separated by 750 m within the main array, called Infill. Fluorescence detectors (FD) collect light emitted by the passage of the charged particles of the shower through the air, allowing the reconstruction of the longitudinal profile of the shower and a calorimetric measurement of its energy. Simultaneous detection by the SD and the FD is called hybrid detection and it has a dark night duty cycle of 15% due to the FD. More details on the Observatory and its latest results can be found in AugerUHECR2018 .
The main goal of the Pierre Auger Observatory is to unveil the origin and composition of UHECR. The depth at which the shower reaches the maximum number of particles is sensitive to the primary mass composition. Deepest air showers occur for the smallest mass number . At the same time, as the energy of the shower increases, it reaches its maximum development deeper in the atmosphere. In general, a detailed simulation of the whole cascading process, accounting for all the details of multi-particle production, is necessary to predict the position of the shower maximum as a function of mass and energy and compare it with measurements.
Results from the Pierre Auger Observatory show a composition which steadily becomes heavier with energy when interpreted with the latest available models Auger2014 . The number of muons at the ground is also sensitive to the mass of the primaries Kampert:2012mx , but it is hampered by the ambiguity of the predictions of the high energy interaction models. In general, the phase space of shower observables occupied by different primary masses often overlaps with that of the different model predictions. Disentangling one from the other is of utmost importance and is one of the most compelling challenges in UHECR physics: it not only clears the way to mass interpretation of the shower observables, but it also allows to study particle physics in unexplored regions of phase-space.
In this paper we focus on the measurements of the Pierre Auger Observatory relevant to constrain our knowledge of high energy physics. In Section 2, some basic features of the air showers are discussed. Section 3 is devoted to the measurements performed on the electromagnetic (EM) component by the FD. Section 4 deals with measurements done by SD related to the muon component and finally section 5 presents SD measurements of both components at once. Section 6 discusses the results.
2 The Air Shower
After the UHECR-air first interaction approximately of the energy goes into secondary mesons (mainly pions) and baryons which continue interacting FelixUHECR2018 , creating the so-called hadronic cascade. When the average energy per meson decreases, it eventually becomes more likely that mesons decay rather than interact. This is the stage where most muons are formed. Muons are the main messengers from the hadronic cascade.
The EM cascade consists of photons and electrons. It is fed from the hadronic cascade by the decay of neutral pions into photons, which then keep multiplying in number by pair production and bremsstrahlung. In each interaction, approximately of the energy is transferred from the hadronic to the EM cascade by decay, being the largest absolute contribution the one from the first interaction Cazon2018 . After a few generations, the hadronic and EM cascade are practically decoupled Cazon:2013dm .
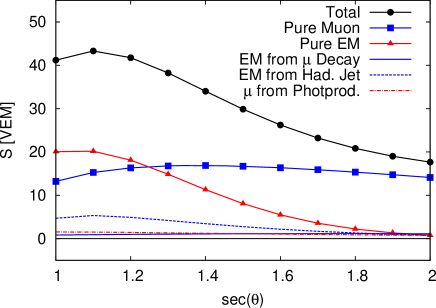
Beyond the pure Muonic component which stems from the decay of mesons belonging to the hadronic cascade and the pure EM component that stems from the fully decoupled EM cascade, one can distinguish other contributions:
-
•
EM from muon decay or muon halo which stems from the decay of muons, and therefore scales with the hadronic component of the shower.
-
•
EM from low energy decay which is a small contribution to the EM cascade but nevertheless is coupled with the hadronic cascade, referred as EM from hadronic jets in Fig. 2.
-
•
muon from photo-production, which stem from the pion production after photon-air interactions, and therefore coupled to the EM cascade.
More information about these components can be found in Ave:2017uiv Ave:2017wjm .
The Pierre Auger Observatory is capable of measuring the longitudinal development of the EM component trough the FD, and also the ground particle content of the EM and muonic component through the SD. Fig. 2 represents the signal at 1000 m from the shower core recorded by the SD for the different shower components as a function of the zenith angle of the shower Auger2016 . In general, SD is not capable of distinguishing the different contributions, but simply reads the total signal in the ground surface, which is a mix of EM origin and hadronic origin. Nevertheless, by going to inclined showers, where the pure EM component has been attenuated, one can assess the muonic component in a more direct way.
3 EM component measurements
The showers reconstructed by FD allow a detailed analysis of the shape of the EM longitudinal profile, showing no differences with respect to simulations performed with different primaries and high energy hadronic models, within our current precision SofiaUHECR2018 Auger2019 . On the other hand, the analysis of the shower-to-shower -distribution, and in particular, its moments, not only allows the most direct interpretation in terms of mass of the primary, but it also allows to make direct measurements and tests of hadronic properties.
3.1 Consistency of and predicted by the hadronic models
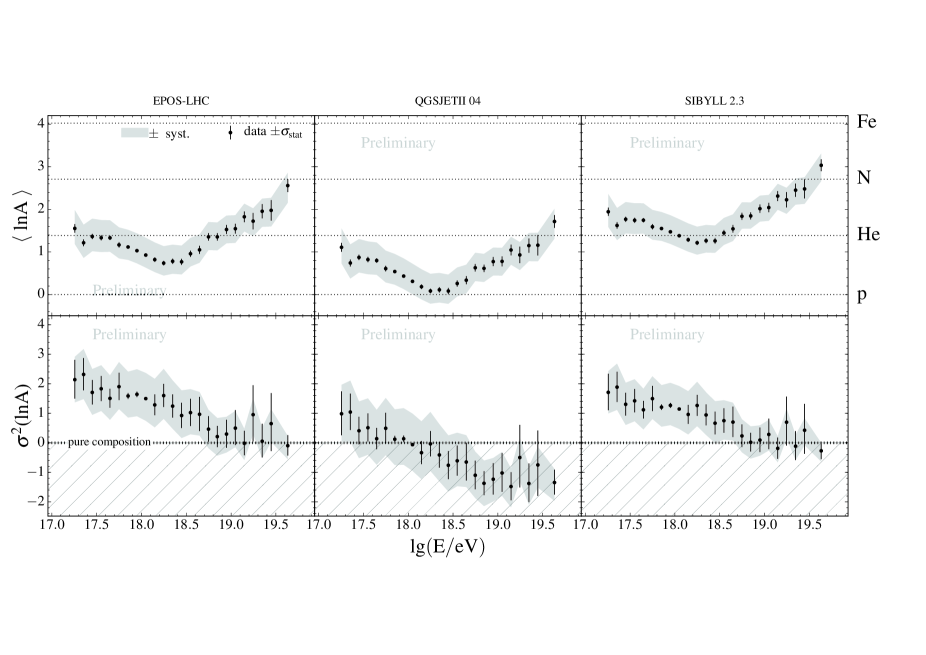
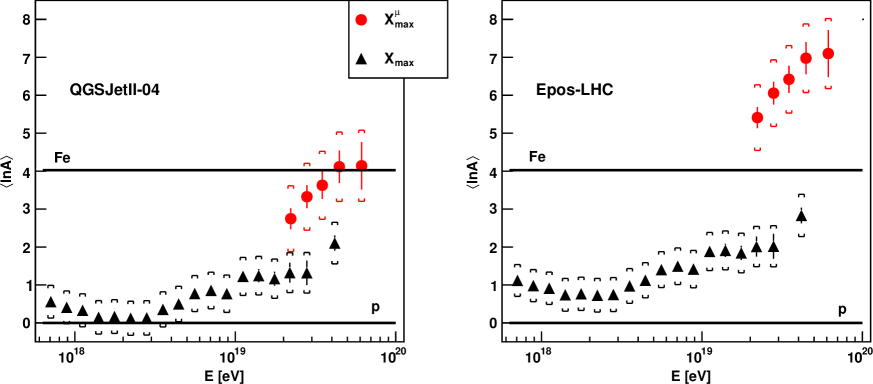
In this section, the first two moments of the -distribution ( and ) are related to the first two moments of the distribution of the logarithm of masses of primary particles and as
| (1) | |||||
| (2) |
where is the mean for protons and is shower-to-shower variance averaged over the corresponding pure compositions. is a parameter depending on details of hadronic interactions, which was parametrized from the interaction models Auger2013 .
Due to the extension of the field of view with the High Elevation Auger Telescopes (HEAT), data were collected with a lower energy threshold of eV, up to about eV BellidoAugerICRC2017 . Fig. 1 shows the results of the inversion of Eq. 1 and 2. The unphysical negative values obtained for result from the QGSJetII-04 predictions of the fluctuations for pure composition, , that are larger than the observed ones.
3.2 p-Air cross section
The depth at which the parent cosmic ray interacts, , follows an exponential distribution where is inversely proportional to the p-air cross section, , that accounts for all interactions which produce particles, and thus contribute to the air shower development; it implicitly also includes diffractive interactions. The depth required for the shower to fully develop is , being the tail of the -distribution of proton showers directly related to the distribution of the first interaction point through . Thus,
| (3) |
where represents the fraction of the deepest penetrating air showers used. We have chosen so that, for helium-fractions up to 25%, biases introduced by the possible presence of helium and heavier nuclei do not exceed the level of the statistical uncertainty.
The procedure to measure the p-air cross section consists of two subsequent parts. The first step is the dedicated reconstruction of the observable , which is a measure of the attenuation length of air showers in the atmosphere. The second step consists in the conversion of into the proton-air cross section. This depends on the simulation of air showers and the hadronic interactions therein. The hadronic cross sections of the different high energy interaction models were multiplied by an energy-dependent factor to produce different predictions of the slope, . This allowed us to create a one-to-one map of the measured into the corresponding for a given model.
Thus, the multiplying factor
| (4) |
is used, where is the value of the scaling at eV and is the threshold above which . EPOS-LHC and QGSJetII-04 are both tuned up to cross sections measured by the TOTEM experiment at TeV [13], while SIBYLL 2.1 is tuned to Tevatron at = 1.96 TeV, corresponds to primary cosmic ray protons of eV and eV respectively. Thus, for EPOS-LHC and QGSJetII-04 eV and for SIBYLL 2.1 eV is used.
The total number of high-quality hybrid events in the data sample used for the measurement is 39360. Event quality cuts are applied as described in UlrichAugerICRC2015 . The available data sample is divided into two energy intervals, one ranging from eV to eV with 18090 events, which gives the result
| (5) |
and the other from to eV with 21270 events, which gives the result
| (6) |
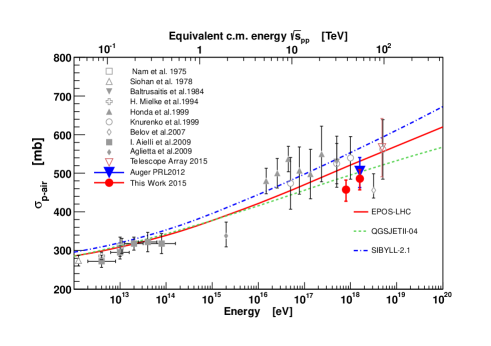
After averaging the four values of the cross section obtained with the different available hadronic interaction models we obtain:
| (7) |
for the low energy interval, with an average energy of eV, which corresponds to a center-of-mass energy of TeV in proton-proton collisions.
| (8) |
for the highest energy interval, with an average energy is eV which corresponds to a center-of-mass energy of TeV in proton-proton collisions.
The results are displayed in Fig. 3. A maximum contamination of 25% of helium nuclei in the light cosmic-ray mass component was assumed. The lack of knowledge of the helium component is the largest source of systematic uncertainty. However, for helium fractions up to 25% the induced bias remains below 6%. More details of this analysis can be found in Auger2012 and UlrichAugerICRC2015 .
4 The hadronic component
4.1 Number of muons in inclined showers
Above a zenith angle of degrees, the EM component has been largely attenuated and only the muons and its EM halo arrive to ground. Measuring the ground signal of inclined showers is one of the most direct strategies to access the muon component and therefore extract information about the hadronic cascade.
After the arrival direction (,) of the cosmic ray is determined from the relative arrival times of the shower front, the shower size parameter is defined through the following relation:
| (9) |
where is the model prediction for the muon density at the ground used to fit the signals recorded at the detectors. is a reference profile corresponding to the inferred arrival direction of the muon density at ground for proton showers of 1019 eV, simulated using the QGSJetII-03 interaction model (see AugerHAS2014 for details about the reconstruction). is sensitive to the cosmic-ray energy and nuclear mass composition. The quantity () was introduced to account for the difference between the real number of muons, given by the integral of the distribution of muons at the ground, and the estimate obtained by the fitting procedure of Eq. 9. The difference between and is less than 5%.
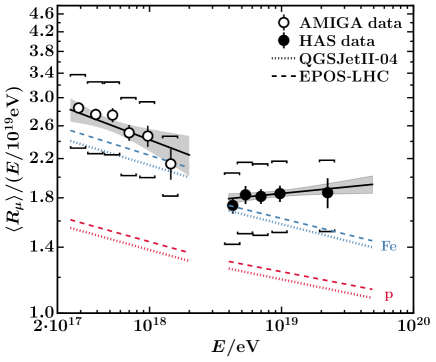
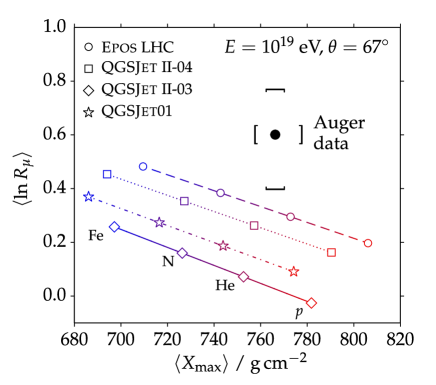
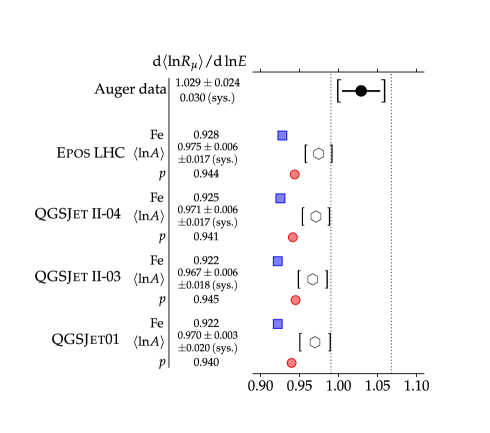
The averaged scaled quantity ( eV) is shown in Fig. 4 divided in five energy bins containing roughly equal statistics. The measurement of is dominated by systematic uncertainties in the energy scale (shown as open circles in the figure). The measured number of muons between 4 1018 eV and 2 1019 eV is marginally comparable to predictions for iron showers simulated either with QGSJetII-04 or EPOS-LHC. Given that the observed distribution of the depth of shower maximum between eV and eV is not compatible with an iron dominated composition, we conclude that the observed number of muons is not well reproduced by the shower simulations. This can be clearly observed in Fig. 5, where the average logarithmic muon content as a function of the average shower depth is plotted for data and the mass phase-space predicted by models at eV. The logarithmic derivative in data differs from the values one would obtain from the mass evolution extracted from for the different models, as it can be also observed in Fig. 6. More details of this analysis can be found in AugerHAS2015 .
4.2 Number of muons measure by AMIGA
As part of the upgrade of the Pierre Auger Observatory, the Auger Muons and Infill for the Ground Array (AMIGA) AMIGA2016 is an underground muon detector extension that allows for direct muon measurements of a sub-sample of showers falling into the Infill array. IT will also serve for the verification and fine-tuning of the methods used to extract muon information from the combined scintillators and WCD signals of the upgrade, called AugerPrime AntonellaPrimeUHECR2018 . 61 scintillation detectors with an area of 30 m 2 each will be buried at a depth of 2.3 m in the soil next to each of the WCD of the Infill. The Auger Observatory has also completed the analysis of 1 full year of data from 7 scintillators buried at 2.3 m below ground where PMTs were used, while SiPMs will be used in the full deployment. Fig. 4 displays the results of together with the inclined showers results as a function of the energy. More details of the analysis can be found in SarahAMIGAUHECR2018 . AMIGA confirms the existence of a muon deficit in simulations down to energies eV. The energy gap between the AMIGA measurements and the inclined shower measurements reported in previous section contains the change in elongation rate present in the measurements.
4.3 Hadronic scale from vertical showers
The hybrid nature of the Auger Observatory allow to simultaneously measure the ground signal with SD and the longitudinal EM development with the FD. The ground signal brings information about the electromagnetic as well as the hadronic component (mainly through muons), whereas the FD adds information about he total energy of the shower, and the depth of its longitudinal development. The ground signal of simulated showers with longitudinal profiles matching those of detected showers was analysed. The data used for this study were narrowed down to the energy bin 10 eV, sufficient to have adequate statistics while being narrow enough that the primary cosmic ray mass composition does not evolve significantly.
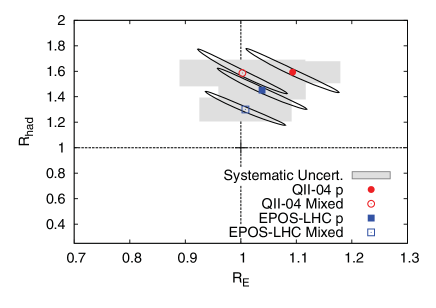
To explore the potential sources of the muon count discrepancy between measurements and model expectations, the ground signal was modified in the simulated events to fit the ground signal in the data. Two rescaling factors were introduced: and . acts as a rescaling of the energy of the primary cosmic ray, affecting the total ground signal. acts as a rescaling factor of the contribution to the ground signal of inherently hadronic origin, namely: the pure muonic, the EM from muon decay and the EM from low energy decay.
| (10) |
and are then fitted to minimize the discrepancy between the ensemble of observed and simulated signals at ground, which can also reproduce the observed -distribution, and is labelled as “mixed” in Fig. 7. The observed hadronic signal is a factor 1.3 to 1.6 larger than predicted using the hadronic interaction models tuned to fit LHC and lower energy accelerator data. None of the tested models calls for an energy rescaling . More details of this analysis can be found in Auger2016 .
The relation between and can be extracted by taking into account the contribution of the different components of the shower, as
| (11) |
showing agreement within the current uncertainties between the derived value of for vertical showers and inclined showers.
4.4 Muon production depth
The distribution of muon arrival times to the ground is closely related to the distribution of their production depths. To a first approximation, there is a one-to-one map between the time elapsed between the arrival time of a hypothetical shower front plane, travelling at the speed of light, and the arrival time of the muons whose trajectories are not parallel to the shower axis: , where is the distance to the shower core in the perpendicular plane, is the distance from the ground to the production point, and is the -coordinate of the observation point. Both and are measured along the shower axis.
The second most important source of delay is the subluminal velocities of the muons, due to their finite energy Cazon:2012ti . The so called kinematic delay is a second order correction to the total arrival time delay, that decreases as increases. Its average is calculated from an analytic model for the energy spectrum of muons.
The production distance is approximated as
| (12) |
which is later transformed into a production depth using the density profiles provided by the instruments dedicated to monitor the atmosphere above the Auger Observatory. The depth at which the Production Depth Distribution reaches a maximum in each event, , is then reconstructed and analysed.
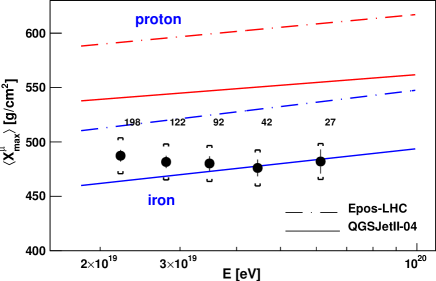
The data set used in this analysis comprises the events recorded in the angular range from 55∘ to 65∘. The evolution of as a function of is shown in Fig. 8. The uncertainties represent the standard error on the mean, whereas the brakets represent the systematic uncertainty. Fig. 8 also displays QGSJetII-04 and EPOS-LHC predictions for both proton and iron primaries. The absolute value of shows considerable differences specially with respect to EPOS-LHC. By linearly converting (and ) into the mean logarithmic mass of the primary, , for a given high-energy interaction model, the mismatches between the simultaneous predictions for the longitudinal development of the EM and hadronic cascade (through the MPD) become more apparent, as it is seen in Fig. 9. Starting from a given primary mass , a given model should simultaneously predict the corresponding values of and the values of , More details of this analysis can be found in AugerMPD2015 .
For the EPOS-LHC model, this conversion procedure results into incompatible values, and the mass conversion of resulting in , a value that corresponds to a nuclei which is much heavier than iron well beyond the systematic uncertainties. The procedure using the second model, QGSJetII-04, yields a milder inconsistency in this respect. It can be observed from Fig. 8 that EPOS-LHC predicts reference lines for proton and iron primaries much deeper than older versions and other models. Paradoxically, EPOS-LHC is claimed to better represent the rapidity gap distributions of the new LHC p-p data, when compared to QGSJetII-04. Some shower mechanisms, in particular small differences in the the difractive pion-Air cross section were also proposed, as they might produce a cumulative effect along the hadronic shower that adds up to sizeable differences in the MPD Pierog2014 .
5 Combined measurements
5.1 Rise-time and Delta
The Auger SD was not properly designed to separate the EM from the muonic component, but rather, it measures the time distribution of the total signal as the particles arrive to the water-Cherenkov detectors. In the study described below AugerDelta2017 , we use the rise-time of the total signals from the water-Cherenkov detectors to extract information about the development of showers. A single parameter, namely, the time for the signal to increase from 10% to 50% of the final magnitude of the integrated total signal, , is used.
The rise-time is found experimentally to be a function of distance to the shower core, zenith angle, and energy of the primary. Within each shower, and at a given distance to the core, there is an asymmetry or modulation in the internal polar angle of the shower plane AugerSecTheta2016 .. At 1000 m from the shower axis, for a vertical event of 10 EeV, 380 ns. This value increases slowly with energy and decreases with zenith angle. At large angles and/or small distances, can be comparable to the 25 ns resolution of the FADCs, and this fact restricts the data that are used below.
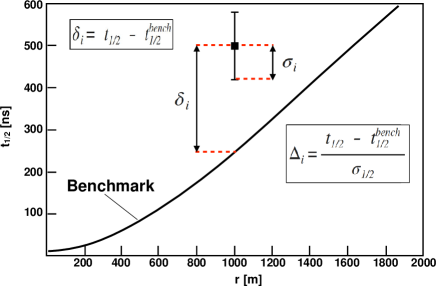
To obtain a large sample of data over a wide range of energies, we have determined the relationships that describe the rise-times as a function of distance in a narrow range of energy. We call these functions benchmarks, and rise-times at particular stations, after correction for the asymmetry effect, are compared with the relevant times from the benchmark, , in units of the accuracy with which they are determined. The approach is illustrated in Fig. 10, being .
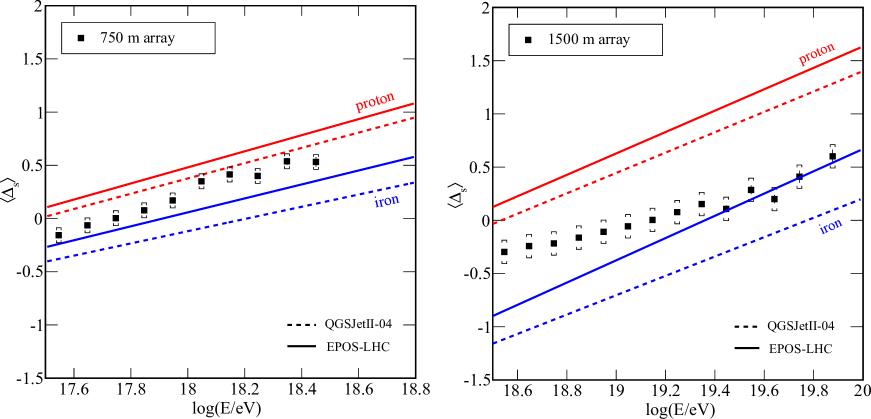
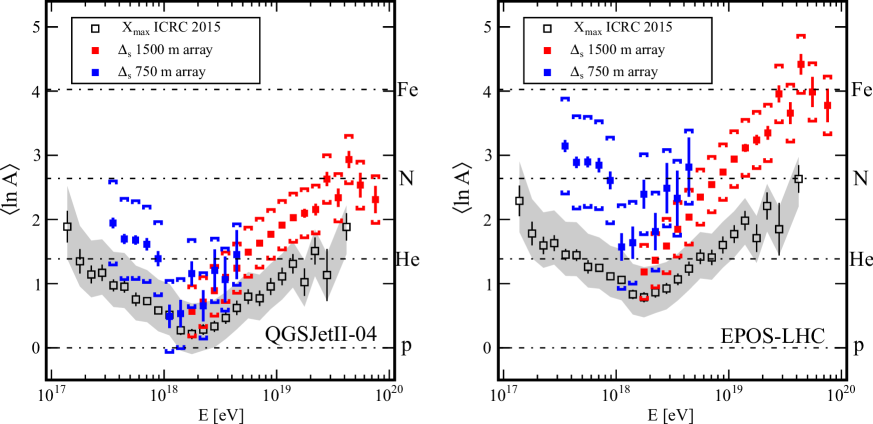
A comparison of the evolution of with energy from the data with those from models is shown in Fig. 11. The results of this transformation for two models are shown in Fig. 12 and are compared with the Auger measurements of made with the FD. The rise-time of vertical showers does depend on , and , and therefore the measurements and its corresponding counterpart also show the tensions with the hadronic models. In AugerSecTheta2016 , the polar asymmetry of the rise-times was used as a mass indicator, with a somehow different sensitivity to the components of the shower, but with the same overall results.
On the other hand, by cross-calibrating the with the direct measurements one could use to infer values beyond the reach of the limited FD statistics, and extend the mass interpretation to the highest energies AugerDelta2017 .
6 Conclusions
The Pierre Auger Observatory has measured properties of extensive air showers that allow to constrain the high energy interactions models. Whereas the FD measures the development of the EM component, the SD samples to the EM and muonic component at ground.
The detailed study of the moments of the -distribution carries valuable information of the high energy interactions models. On one side, the deep -tail has allowed a direct measurement of the p-Air cross section. This measurement was performed at energies above those attained by the LHC, and is able to constrain the extrapolations of the hadronic models towards the highest energies. On the other side, the average and fluctuations of can be transformed into mean and , imposing constraints on the models, namely QGSJetII-04 tends to overestimate the shower-to-shower fluctuations.
The number of muons at ground has been measured in a wide energy range, from to and beyond, showing a deficit in simulations which is confirmed to start at energies below the reach of the Pierre Auger Observatory WHISPUHECR2018 . The computed logarithmic slope of the muon scale is greater than the one expected from the composition when interpreted with under the current models. The independent measurement performed with vertical showers does not support an energy scale shift as a possible explanation of such deviation.
The original causes the the muon discrepancy are being investigated. It is well known that the hadronic cascade can accumulate small deviations from expectation in each hadronic generation up to a sizeable effect, but it is also true that the first interaction is far from the reach of accelerator experiments, and might contain itself an important deviation from what is being used in the current models. Another independent measurement is the maximum of the Muon Production Depth distribution, which reveal some further aspects of the hadronic cascade which must be carefully accounted in the hadronic models. The understanding of the of the mechanisms that could affect the , and expectations and specially the links between them are key to achieve the correct understanding of the high energy physics that plays a role in the development of EAS.
Acknowledgements
L. Cazon warmly thanks M. Roth for having accepted to act as proxy in the UHECR2018 conference, after a last minute request. LC also thanks funding by Fundacão para a Ciê ncia e Tecnología, COMPETE, QREN, and European Social Fund.
References
- (1) The Pierre Auger Collaboration, “The Pierre Auger Cosmic Ray Observatory,” NIM A 798 (2015) 172-213
- (2) Proceedings of the UHECR 2018 conference.
- (3) The Pierre Auger Collaboration, “Depth of Maximum of Air-Shower Profiles at the Auger Observatory: Measurements at Energies above eV,” Physical Review D 90, 122005 (2014)
- (4) K. H. Kampert and M. Unger,“Measurements of the Cosmic Ray Composition with Air Shower Experiments,” Astropart. Phys. 35, 660 (2012)
- (5) F. Riehn, L. Cazon and R. Conceicao,“Probing the spectrum at high- in proton-Air interactions at ultra-high energies,” Proceedings of the UHECR 2018 conference
- (6) L. Cazon, R. Conceicaoo and F. Riehn, “Probing the energy spectrum of hadrons in proton air interactions at ultrahigh energies through the fluctuations of the muon content of extensive air showers,” Phys. Lett. B 784, 68 (2018)
- (7) L. Cazon, “Extensive Air Showers: from the muonic smoking guns to the hadronic backbone,” EPJ Web Conf. 52, 03003 (2013) doi:10.1051/epjconf/20125203003
- (8) M. Ave, M. Roth and A. Schulz, “A generalized description of the time dependent signals in extensive air shower detectors and its applications,” Astropart. Phys. 88, 46 (2017).
- (9) M. Ave, R. Engel, M. Roth and A. Schulz, “A generalized description of the signal size in extensive air shower detectors and its applications,” Astropart. Phys. 87, 23 (2017).
- (10) “Average shape of longitudinal shower profiles measured at the Pierre Auger Observatory” Proceedings of the UHECR 2018 conference
- (11) Pierre Auger Collaboration, “Measurement of the average shape of longitudinal profiles of cosmic-ray air showers at the Pierre Auger Observatory,” Submitted to JCAP arXiv:1811.04660
- (12) The Pierre Auger Collaboration, “Testing hadronic interactions at ultrahigh energies with air showers measured by the Pierre Auger Observatory,” PRL 117, 192001 (2016)
- (13) L. Cazon, R. Conceicao, M. Pimenta and E. Santos, “A model for the transport of muons in extensive air showers,” Astropart. Phys. 36, 211 (2012)
- (14) J. Bellido, for the Pierre Auger Collaboration “Depth of maximum of air-shower profiles at the Pierre Auger Observatory: Measurements and composition implications,” Proccedings of the ICRC2017, PoS ICRC2017 (2018) 506 DOI: 10.22323/1.301.0506
- (15) Pierre Auger Observatory, “Interpretation of the Depths of Maximum of Extensive Air Showers Measured by the Pierre Auger Observatory,” JCAP 1302 (026), 2013.
- (16) R. Ulrich, for the Pierre Auger Collaboration “Extension of the measurement of the proton-air cross section with the Pierre Auger Observatory,” Proccedings of the ICRC2015, PoS ICRC2015 (2016) 401 DOI: https://doi.org/10.22323/1.236.0401
- (17) Pierre Auger Collaboration, “Measurement of the proton-air cross-section at TeV with the Pierre Auger Observatory,” Phys. Rev. Lett. 109, 062002 (2012)
- (18) Pierre Auger Collaboration, “Reconstruction of inclined air showers detected with the Pierre Auger Observatory,” JCAP 1408, no. 08, 019 (2014)
- (19) The Pierre Auger Collaboration, “Muons in air showers at the Pierre Auger Observatory: mean number in highly inclined events,” Physical Review D 91, 032003 (2015); ERRATA: Phys. Rev. D 91, 059901 (2015).
- (20) S. Muller, for the Pierre Auger Collaboration “Direct Measurement of the Muon Density in Air Showerswith the Pierre Auger Observatory,” Proceedings of the UHECR 2018 conference
- (21) A. Castelline, for the Pierre Auger Collaboration “ AugerPrime: the Pierre Auger Observatory Upgrade” Proceedings of the UHECR 2018 conference
- (22) The Pierre Auger Collaboration, “Prototype muon detectors for the AMIGA component of the Pierre Auger Observatory,” JINST 11 (2016) P02012
- (23) The Pierre Auger Collaboration, “Muons in air showers at the Pierre Auger Observatory: measurement of atmospheric production depth,” Physical Review D 90, 012012 (2014); ERRATA: Phys. Rev. D 90, 039904(E) (2014); ERRATA: Phys. Rev. D 92, 019903 (2015)
- (24) T. Pierog, “Modelling hadronic interactions in cosmic ray Monte Carlo generators,” Proceedings of the ISVHECRI 2014, EPJ Web Conf. 99, 2015, 09002
- (25) The Pierre Auger Collaboration, “Inferences on Mass Composition and Tests of Hadronic Interactions from 0.3 to 100 EeV using the water-Cherenkov Detectors of the Pierre Auger Observatory” Phys. Rev. D 96, 122003 (2017)
- (26) The Pierre Auger Collaboration, “Azimuthal asymmetry in the risetime of the Surface Detector signals of the Pierre Auger Observatory,” Phys. Rev. D 93, 072006 (2016)
- (27) H. Dembinski, J.C. Arteaga-Velazquez, L. Cazon, R. Conceicao, et al “Report on tests and measurements of hadronic interaction properties with Air Showers” Proceedings of the UHECR 2018 conference