Full author list: http://www.auger.org/archive/authors_2018_10.html 99institutetext: Telescope Array Project, 201 James Fletcher Bldg, 115 S. 1400 East, Salt Lake City, UT , USA
Full author list: http://www.telescopearray.org/research/collaborators
Depth of maximum of air-shower profiles: testing the compatibility of measurements performed at the Pierre Auger Observatory and the Telescope Array experiment
Abstract
At the Pierre Auger Observatory and the Telescope Array, the measurements of depths of maximum of air-shower profiles, , are performed using direct observations of the longitudinal development of showers with the help of the fluorescence telescopes. Though the same detection technique is used at both installations, the straightforward comparison of the characteristics of the measured distributions is not possible due to the different approaches to the analysis of the recorded events. In this work, the Auger – Telescope Array composition working group presents a technique to compare the measurements from the Auger Observatory and the Telescope Array. Applying this technique the compatibility of the first two moments of the measured distributions is qualitatively tested for energies using the recently published Telescope Array data from the Black Rock Mesa and Long Ridge fluorescence detector stations. For a quantitative comparison, simulations of air showers with EPOS-LHC, folded with effects of the Telescope Array detector, are required along with the inclusion in the analysis of the systematic uncertainties in the measurements of and the energies of the events.
1 Introduction
The large amount of data on the ultra-high-energy cosmic rays, collected by the Pierre Auger Observatory augerfull_NIMA2015 operating in the Southern Hemisphere since 2004 and the Telescope Array (TA) TA_ISVHECRI2006 operating in the Northern Hemisphere since 2008, opens unprecedented possibilities for performing a comparison of the spectra, arrival directions and mass compositions of the cosmic rays coming from the complementary regions of the sky. Any differences in the characteristics of the primary radiation found in such type of analysis would have important astrophysical implications and would help to clarify the origin of the most energetic particles in the Universe. For an unequivocal attribution of such differences to factors having an astrophysical nature, the comparison of the data of Auger and TA should rely on a deep understanding of the systematic effects present in the measurements of the two experiments which employ different kinds of the surface detectors (SD), different atmospheric monitoring equipment and programs, different designs of the fluorescence detectors (FD) and eventually different approaches to the data analysis. To address these issues a close collaboration of the people from various experiments is required, and to this scope, several working groups were created in preparation for the ultra-high-energy cosmic ray symposium that took place in Geneva in 2012 uhecr2012 .
The activities of the mass composition working group in the recent years have been focused on the comparison of the Auger and TA data on the depth of the maximum of the extensive air showers measured with the use of the fluorescence telescopes. Until the present time, a good agreement between the two data sets was found as regarding the evolution of with energy cwg_uhecr2016 , so regarding the compatibility of the shapes of the distributions cwg_icrc2017_xmax (the latter analysis was done for energies below 10 EeV). In 2018 the TA Collaboration has published new data TA_ApJ2018_xmax including results on the first two moments of the distributions with the larger statistics than ever before. In this paper we present a preliminary qualitative analysis of the compatibility of these TA measurements with the data of the Pierre Auger Observatory and outline the next steps required for finalizing the comparison.
2 Data
Pierre Auger Observatory
At the Pierre Auger Observatory the longitudinal development of air showers is measured with the FD consisting of 24 fluorescence telescopes covering each in azimuth and in elevation. The telescopes are grouped in units of six at four sites around the SD array of the area of 3000 km2. There is an additional site with three high elevation telescopes for detection of air showers with energies eV, but events with such energies will not be discussed in this paper.
An extensive program of monitoring of atmospheric parameters, important for a proper reconstruction of and energy of air showers, is run at the Observatory (see augerfull_NIMA2015 for more details). Pressure, humidity and temperature at different atmospheric depths are determined on a 3-hour basis using data from the Global Data Assimilation System. Vertical aerosol optical depth (VAOD) is measured hourly with the FD using light profiles of the laser shots from two central laser facilities. The presence of clouds in the field of view of the FD telescopes is controlled each 15 minutes with the help of cloud cameras and elastic lidars, additional information on cloud coverage is obtained using laser shots from the laser facilities and data from the Geostationary Operational Environmental Satellites. For events of the extremely high energies or having unusual longitudinal profiles, a rapid monitoring of atmospheric conditions is performed using the lidars and the Photometric Robotic Atmospheric Monitor.
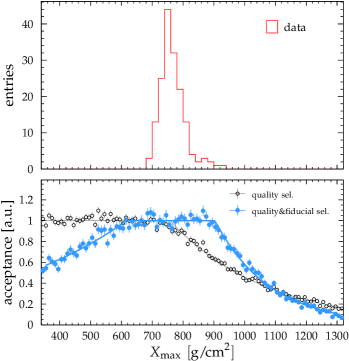
The reconstruction of the recorded events is performed using the Auger Offline software framework offline07 . Only hybrid events, i.e. the events having at least one triggered SD station, that satisfy a number of quality selection criteria, are included in the analysis. Further, the high quality data pass an additional fiducial field-of-view selection to guarantee an unbiased acceptance of the showers almost independently on their (see Fig. 1). Finally, the data are corrected for the reconstruction, residual acceptance biases and resolution effects, and thus the resulting and can be compared directly to the predictions from the ideal (without any detector) MC simulations (see longXmax2014 for full details). The most recent Auger data auger_icrc2017_xmax come from the period and contain about 10550 events in the energy range eV discussed further.
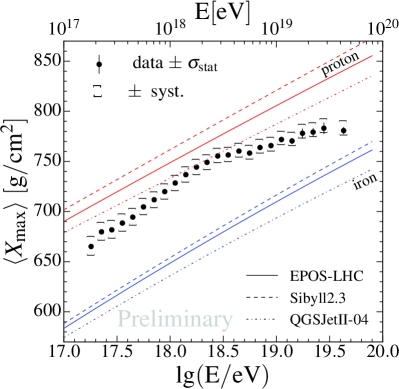
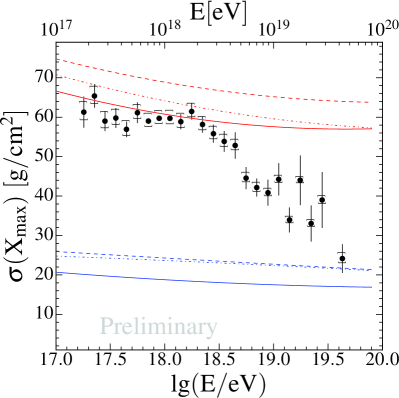
In Fig. 2 one can see the evolution of the first two moments measured with the Auger Observatory. Starting from lower energies up to about 2 EeV, in the data is approaching the MC predictions for protons, thus the primary mass composition is becoming lighter. For energies above 2 EeV, the behavior of both and is consistent with the increase of the average mass in the primary beam unger_mass_uhecr2018 .
Telescope Array experiment
The TA data discussed in this paper were collected by the fluorescence telescopes installed at the Black Rock Mesa (BR) and Long Ridge (LR) sites TA_ApJ2018_xmax . There are 12 fluorescence telescopes at each of the sites covering the total field-of-view of in azimuth and in elevation. These FD telescopes are placed in the southern part of the TA SD of area of 700 km2.
The properties of the atmospheric profiles at the TA site are obtained from the data of the Global Data Assimilation System and, for estimating the systematic uncertainties in the measurements of , from the data collected with the NOAA National Weather Service radiosondes. The VAOD is measured each 30 minutes using laser shots from the central laser facility. The reconstruction of is performed with an average for all nights and the VAOD measurements are then used for estimation of the systematic uncertainties of and . The cloud coverage and cloud thickness are judged by eye and logged hourly by operators in the field.
The TA events used in the analysis are hybrid, as in the case of Auger. For an event to be accepted it is required the triggering of both the FD and of three SD counters adjacent to each other. The details on the reconstruction and selection of the events can be found elsewhere TA_ApJ2018_xmax . Differently from the Auger analysis, no fiducial field-of-view selection or corrections for the reconstruction and acceptance biases are applied to the TA data. Consequently, a larger number of events is kept in the data set, but the comparison of the data to the predictions of the interaction models can be done only using the MC simulations processed through the same analysis chain as the data and including thus the analysis biases and the effects of the TA detector. The period of the data taking is , the data set consists of 3330 events with eV.
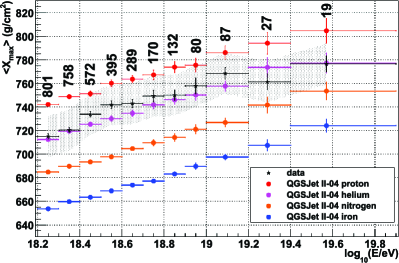
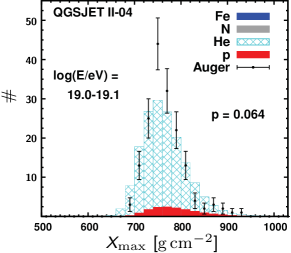
From the comparison of measured by the TA BR/LR to the predictions of the QGSJetII-04 model (Fig. 3) and from the analysis of the shapes of distributions TA_ApJ2018_xmax ; hanlon_mass_uhecr2018 , it follows that the data are compatible within the statistical and systematic errors to pure protons for all energies eV. Due to the lower detector acceptance for deep high energy showers and due to the low number of the detected events, for eV the shapes of the measured distributions become compatible also to the MC predictions for other pure primary compositions (helium, nitrogen) TA_ApJ2018_xmax ; hanlon_mass_uhecr2018 .
Remarks on the Auger and TA measurements
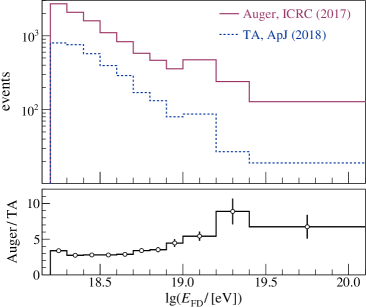
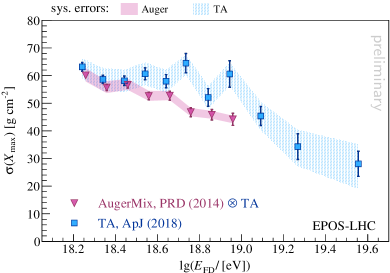
For energies above eV the first two moments, the shape of distributions and the elongation rate of measured by Auger are incompatible to the MC predictions for protons longXmax2014 ; auger_icrc2017_xmax (the same conclusions have been obtained from the measurements involving the information from the SD auger_mix_2016 ; augerDelta2017 ). The interpretation stating that the TA measurements are compatible to the predictions for QGSJetII-04 protons TA_ApJ2018_xmax ; hanlon_mass_uhecr2018 does not necessarily contradict the Auger results. In case of the TA BR/LR data, only the compatibility to the pure beams was tested, thus it can not be excluded that the TA data can be described well by the mixed compositions of QGSJetII-04 (as was already shown in cwg_icrc2017_xmax ) and of other interaction models. It should be noted as well that the statistical significance of such a comparison will be lower than in case of Auger due to the difference in the sizes of the data sets (Fig. 4) reflecting the difference in hybrid exposures (sizes of the SD arrays, data taking periods and detection/selection efficiencies) of the Auger and TA experiments.
Instead of comparing the interpretations, the primary aim of the composition working group is the comparison of the measurements themselves, including the check of the compatibility of the first two moments, of the shapes of the distributions and of the elongation rates. Further we present the technique for doing such a comparison, perform a preliminary qualitative comparison of and and outline the next steps needed for a completion of the full quantitative evaluation of the compatibility of the Auger and TA measurements.
3 A method of comparison of the Auger and TA measurements
As explained in the previous section, the Auger and TA measurements cannot be compared directly because of the use of different approaches to the analysis of the recorded events. In the case of Auger, due to the application of the fiducial field-of-view selection and consequent correction of the biases, the moments are free from the detector effects and can be compared directly to the ideal MC simulations. The data of the TA on the other hand include all detector and analysis biases.
To compare the Auger and TA data one should convert Auger values into the values folded with the TA detector effects (Auger TA). To do this, it was proposed cwg_uhecr2012 to find the MC compositions giving the best description of the shapes of the Auger distributions and to process these compositions through the full simulations and analysis chain used for the TA BR/LR data. The MC compositions describing the Auger distributions were found in longXmax_fits2014 ; auger_icrc2017_xmax and will be referred hereafter as AugerMix.
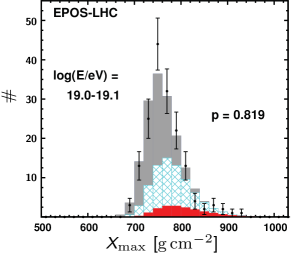
In Fig. 5 an example of AugerMix compositions for QGSJetII-04 and EPOS-LHC in comparison to the Auger data is shown for the energy bin . One can see that the MC template for EPOS-LHC provides a better description of the data compared to the template for QGSJetII-04. As demonstrated in auger_icrc2017_xmax , the -values characterizing the agreement between AugerMix of QGSJetII-04 and the Auger data are in all energy bins between 1 and 10 EeV. The reason for a non-satisfactory description of the data might be that the AugerMix of QGSJetII-04 is composed only of protons and helium and the widths of the distributions for such a mix of light elements are too wide compared to the widths found in data auger_icrc2017_xmax 111c.f. to the conclusions of auger_mix_2016 that independently on the interaction model the presence of elements heavier than helium is required to describe data on the correlation between and signal in the SD stations..
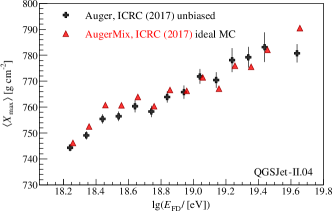
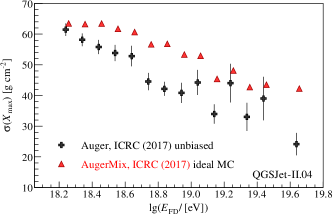
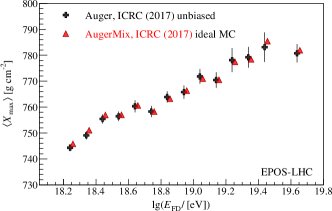
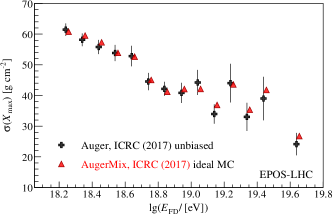
This fact is illustrated in Fig. 6 where one can see that for AugerMix of QGSJetII-04 is significantly larger compared to the values found in the data. Since the AugerMix compositions of QGSJetII-04 do not reproduce correctly the shapes of the distributions measured by Auger, they are not the optimal choice for performing the comparison of the Auger and TA measurements. For the proper comparison, one can use the mass composition templates found using EPOS-LHC: as shown in Fig. 6, with this interaction model both measured and are described well, as also indicated by the good -values found in auger_icrc2017_xmax testing the agreement between the distributions.
At the moment of writing of this paper the only available simulations for the TA BR/LR detector were done with QGSJetII-04 while EPOS-LHC simulations have not been finished yet222these simulations are to be finished before the end of 2018.. Thus for a preliminary comparison of the moments, one can only resort to a re-weighting procedure first introduced and thoroughly tested in cwg_uhecr2016 . The re-weighting allows one to transform distributions for the AugerMix of QGSJetII-04 into the distributions of the AugerMix of EPOS-LHC taking all reconstruction, selection biases and TA detector effects into account. Technically this is achieved by the re-weighting of each reconstructed event of QGSJetII-04 by a factor equal to the ratio of the p.d.f.’s AugerMix(EPOS-LHC)/AugerMix(QGSJetII-04) estimated at the true (generated) and energy of this event.
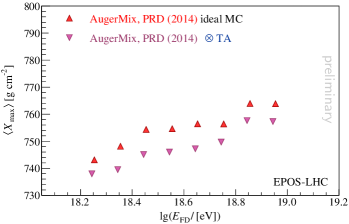
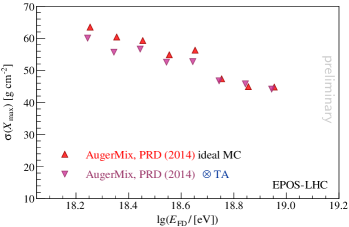
For the comparison presented here the re-weighting was performed using the AugerMix compositions from longXmax2014 for the energy range . From Fig. 7 one can see that TA are smaller than the generated values. This bias can be caused by the relatively smaller detector acceptance for the showers in the deeper tails of the distributions. Similarly, TA is also a few smaller than in the ideal MC.
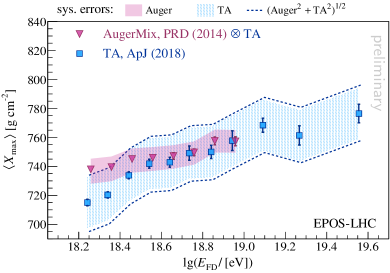
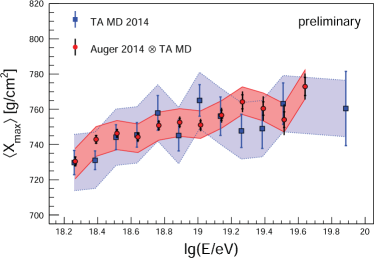
In Fig. 8 the comparison of AugerMix TA for EPOS-LHC (representing the Auger data transferred into the TA detector) to the TA BR/LR measurements is shown. One can see that of the two experiments agree within the statistical and systematic errors with mostly shallower values (heavier mass) for TA compared to Auger and that the agreement is getting better for eV. In the past (e.g. WGmass_UHECR2014 ) the agreement of the Auger data on to the Middle Drum TA measurements was tested, and it was found that both measurements are compatible with an average difference of and no apparent dependence on energy (see Fig. 9). The Middle Drum has different hardware and is located km farther away from the border of the SD compared to the BR/LR stations and might have worse efficiency for low energy ( eV) showers TA_ApJ2018_xmax .
The energy dependence in the comparison of the Auger and TA data can be naturally tested using the analysis of the measured elongation rates. The elongation rate of Auger is measured to be /decade between and eV, above eV it flattens to /decade auger_icrc2017_xmax indicating the increase of the primary mass. As noted previously, the TA elongation rate is folded with the detector effects and thus, due to the detector acceptance, it can be flatter than expected from the ideal MC. Given the acceptance biases, the statistical and systematic uncertainties on , it is premature to make interpretations claiming an evolution in composition from the TA BR/LR data. If is fit for all data observed, the slope is found to be /decade, but with /ndf of 24/9 (-value or significance) (see also watson_uhecr2018 ). If the lower energy of the fit is adjusted to eV, the slope is found to be /decade with an acceptable /ndf of . Model predictions of the elongation rate, folded with the BR/LR detector effects, for a single species is /decade.
Regarding the comparison of (Fig. 8) up to eV, there is a good agreement between the Auger and TA data. Above this energy, the statistical fluctuations in the TA data become quite large making it more difficult to draw any firm conclusions on the compatibility of the Auger and TA measurements.
4 Discussion
In this paper the Auger – TA working group on the mass composition has presented a method for comparing data of the two experiments and the preliminary qualitative checks of the compatibility of and for energies using the recently published data from the TA BR/LR stations. While we could not identify any discrepancies beyond the statistical and systematic errors, more definite conclusions can be obtained after the shower simulations with EPOS-LHC for the TA BR/LR will be available. Other factors which will need to be taken into account are the difference between the Auger and TA energy scales spectrumwg_uhecr2018 and systematic errors on the fractions of nuclei in the AugerMix MC templates used by Auger to fit the measured distributions. The eventual quantitative comparison will include the tests of the compatibility of the first two moments, of the distributions and of the elongation rates for the whole energy range eV.
References
- (1) A. Aab et al. (Pierre Auger), Nucl. Instrum. Meth. A798, 172 (2015), 1502.01323
- (2) H. Kawai, S. Yoshida, H. Yoshii et al., Nucl. Phys. B (Proc. Suppl.) 175-176, 221 (2008)
-
(3)
UHECR Symposium (2012),
http://2012.uhecr.org - (4) W. Hanlon, J. Bellido, J. Belz et al., JPS Conf. Proc. 19, 011013 (2018)
- (5) V. de Souza (Pierre Auger, Telescope Array), PoS ICRC2017, 522 (2018)
- (6) R.U. Abbasi et al. (Telescope Array), Astrophys. J. 858, 76 (2018), 1801.09784
- (7) S. Argiro, S.L.C. Barroso, J. Gonzalez et al., Nucl. Instrum. Meth. A580, 1485 (2007), 0707.1652
- (8) A. Aab et al. (Pierre Auger), Phys.Rev. D90, 122005 (2014), 1409.4809
- (9) J. Bellido (Pierre Auger), PoS ICRC2017, 506 (2018), 1708.06592
- (10) M. Unger (Pierre Auger) (2018), these Proceedings
- (11) W. Hanlon (Telescope Array) (2018), these Proceedings
- (12) A. Aab et al. (Pierre Auger), Phys. Lett. B762, 288 (2016), 1609.08567
- (13) A. Aab et al. (Pierre Auger), Phys. Rev. D96, 122003 (2017), 1710.07249
- (14) E. Barcikowski, J. Bellido, J. Belz et al. (HiRes, Pierre Auger, Telescope Array, Yakutsk), EPJ Web Conf. 53, 01006 (2013), 1306.4430
- (15) A. Aab et al. (Pierre Auger), Phys.Rev. D90, 122006 (2014), 1409.5083
- (16) R. Abbasi et al. (Pierre Auger, Telescope Array), JPS Conf. Proc. 9, 010016 (2016), 1503.07540
- (17) R. Abbasi et al. (Telescope Array), Astropart.Phys. 64, 49 (2014), 1408.1726
- (18) A.A. Watson (2018), these Proceedings
- (19) D. Ivanov (Pierre Auger, Telescope Array) (2018), these Proceedings