The ALMA Discovery of the Rotating Disk and Fast Outflow of Cold Molecular Gas in NGC 1275
Abstract
We present ALMA observations of the CO(2-1), HCN(3-2), and HCO+(3-2) lines in the nearby radio galaxy / brightest cluster galaxy (BCG) of NGC 1275 with the spatial resolution of pc. In the previous observations, the CO(2-1) emission was detected as radial filaments lying in the east-west direction on kpc scale. We resolved the inner filament and found that the filament cannot be represented by a simple infalling stream on sub-kpc scale. The observed complex nature of the filament resembles the cold gas structure predicted by numerical simulations of cold chaotic accretion. Within the central 100 pc, we detected a rotational disk of the molecular gas whose mass is . This is the first evidence of the presence of massive cold gas disk on this spatial scale for BCGs. A crude estimate suggests that the accretion rate of the cold gas can be higher than that of hot gas. The disk rotation axis is approximately consistent with the radio-jet axis. This probably suggests that the cold gas disk is physically connected to the innermost accretion disk which is responsible for jet launching. We also detected absorption features in the HCN(3-2) and HCO+(3-2) spectra against the radio continuum emission mostly radiated by -pc-size jet. The absorption features are blue-shifted from the systemic velocity by 300-600 km s-1, suggesting the presence of outflowing gas from the active galactic nucleus (AGN). We discuss the relation of the AGN feeding with cold accretion, the origin of blue-shifted absorption, and estimate of black hole mass using the molecular gas dynamics.
Subject headings:
galaxies: active, galaxies: nuclei, galaxies: elliptical and lenticular, cD, galaxies: individual (3C 84, NGC 1275, Perseus A), radio lines: galaxies1. Introduction
The Perseus cluster is a nearby (z=0.017) cluster of galaxies and has been the subject of extensive research over years at all wavelengths. The cluster harbors the radio galaxy / brightest cluster galaxy (BCG) NGC 1275, centered at the Perseus cluster. Nuclear emission of NGC 1275 was originally classified as a Seyfert 2 (Seyfert, 1943) but later has been also classified as a Seyfert 1.5/LINER (Véron-Cetty & Véron, 2006; Sosa-Brito et al., 2001) because of the presence of broad H wing. The total luminosity in 1990s was erg s-1 (Levinson et al., 1995). This luminosity is about 0.4% of the Eddington luminosity for a black hole mass of (Scharwächter et al., 2013). The radio luminosity of this source is W Hz-1 sr-1 at 178 MHz, which is classified as a Fanaroff-Riley I radio source (Fanaroff & Riley, 1974).
This galaxy shows an intermittent jet activity in which the most recent activity started in (Abdo et al., 2009; Nagai et al., 2010; Suzuki et al., 2012). This system is the brightest X-ray cluster of galaxies and one of the best examples of a prototypical “cool core” cluster with a signature of the interaction between the jet and the intra-cluster medium (ICM) (e.g. Fabian et al., 2003). In contrast to other nearby BCGs such as M87 (Tan et al., 2008; Perlman et al., 2007), NGC 1275 is the reservoir of a large amount of cold gas () with filamentary structures on kpc scales (Salomé et al., 2006, 2008; Lim et al., 2008), which is reminiscent of a cooling flow. These properties make NGC 1275 the ideal target to study the feeding and feedback between the central super massive black hole (SMBH) and the surrounding environment.
Despite extensive efforts, the gas fueling mechanism from the ICM to the SMBH is not yet clear. On kpc scales, molecular gas filaments are aligned in the east-west direction (Lim et al., 2008) and those filaments seem to coincide with the H nebulae (Fabian et al., 2008). While the gas kinematics in the outer filaments is consistent with the infalling motion, the inner filament of the molecular gas (: Lim et al., 2008) cannot be explained by either a simple inflow or outflow, and thus it is not clear if such a large amount of molecular gas is accreting to the center. On the other hand, the circumnuclear disk (CND) is clearly resolved by the warm H2 and ionized [Fe II] lines in the inner 50 pc, both in morphology and kinematics with the Gemini Telescope (Scharwächter et al., 2013). It was suggested from the observed velocity dispersion that the H2 emission traces the outer region of the disk which is likely to form a toroid while the [Fe II] line traces the inner region of the disk which is illuminated by the ionizing photons from the AGN. The inner ionized part is possibly associated with the “silhouette” disk, which is identified by the free-free absorption (FFA) of background synchrotron emission from the counter jet by VLBI observations (e.g Walker et al., 2000; Fujita & Nagai, 2017). Fujita & Nagai (2017) measured the opacity of free-free absorption () toward the counter jet component in the central pc region and found , which is different from that for a uniform density of . They argued that the absorbing medium is highly inhomogeneous and that it consists of regions of and .
Numerical simulations of giant elliptical galaxies suggest that the mass accretion is dominated by chaotic cold accretion (CCA) within the inner kpc (Barai et al., 2012; Gaspari et al., 2013). These simulations also predict that the CCA leads to a deflection of jets and strong variation in the AGN luminosity. Such a jet deflection and luminosity change are indeed observed in NGC 1275/3C 84 in radio, X-ray, and -ray bands (Nagai et al., 2010; Dutson et al., 2014; Fabian et al., 2015), though the connection between different frequency bands is not well understood (Nagai et al., 2012, 2016; Hodgson et al., 2018). Thus, Gaspari’s simulation seems to represent the observed AGN properties of NGC 1275. Contrary to other elliptical galaxies in a cool-core cluster system such as M87 (Forman et al., 2007), NGC 1275 indeed possesses a large amount of cold gas in the center (MMsun: Lazareff et al., 1989; Mirabel et al., 1989; Lim et al., 2008; Salomé et al., 2008). Salomé et al. (2011) discussed a possibility of the presence of CO molecular disk within 2 kpc. However, resolving the inner ( kpc) region has so far been difficult because of the lack of resolution at mm wavelengths. High resolution observations of the cold molecular gas with ALMA are key to uncovering the missing link between the outer kpc and the inner pc, which is crucial to understand the mass accretion from the ICM to SMBH.
In broader perspectives, it is also intriguing to study the relation of the observed CND with the AGN torus in terms of the unified scheme (Antonucci, 1993). Although many studies have been done for prototypical Seyfert galaxies with ALMA in this regard (e.g. Imanishi et al., 2018), the properties of the CND and its relation to the AGN torus in BCG/radio galaxies is less clear. From theoretical studies, it is predicted that the thickness of the CND can vary with the accretion rate (e.g. Kawakatu & Wada, 2008). It should be noted that the Eddington ratio of NGC 1275 () is close to the boundary between Seyfert AGN and low luminosity AGN, which are thought to have a standard disk and RIAF-type accretion flows (Narayan & Yi, 1994; Yuan & Narayan, 2014), respectively. Thus, the disk thickness of NGC 1275 may be different from that in typical Seyfert AGNs.
In the cosmological context, BCGs provide a unique opportunity to test the hierarchical galaxy formation scenario along with the cluster formation. BCGs are the most luminous and massive galaxies in the Universe at the present epoch and typically located near the center of their parent clusters. They are basically interpreted to form through the merger of several massive galaxies in the cluster’s history (Dubinski, 1998; De Lucia et al., 2006; Tonini et al., 2012). Galaxy mergers are thought to grow the SMBH and drive the scaling relation between SMBHs and their host galaxies (e.g. Kormendy & Ho, 2013; McConnell & Ma, 2013). It is therefore natural to expect that the most massive SMBHs reside in BCGs. ALMA can probe molecular gas dynamics within the sphere of gravitational influence (SoI) for the nearby BCGs including NGC 1275, which allows us to measure the SMBH mass.
In this paper, we present the ALMA observations of NGC 1275 using the CO(2-1), HCN(3-2), and HCO+(3-2) lines to study the cold gas morphology and kinematics from sub-kpc to pc scale. Throughout this paper, we use =70.5, , and . At the 3C 84 distance, corresponds to 34.4 pc.
2. OBSERVATIONS and DATA ANALYSIS
We proposed ALMA observations to study the morphological and kinematical properties of the cold molecular gas in the circumnuclear region ( pc) of NGC 1275 in ALMA Cycle 5 which was approved as the project code of 2017.1.01257.S. The proposal consists of two Group Observing Unit Sets (OUSs), the one for the observation of the CO(2-1) transition and the other for the observation of the HCN(3-2) and HCO+(3-2) transitions. Each Group OUS splits into two Member OUSs where the one is for the observation with an extended configuration (C43-7) and the other is for the observation with a compact configuration (C43-4). This paper presents the results from the observations with the extended configuration.
The observations were done in ALMA Band 6 (1.3 mm) with 47 antennas on 2017 November 27 and 2017 November 28 for the CO(2-1) and HCN(3-2)/HCO+(3-2), respectively. The maximum and minimum baseline lengths are 2.5 km and 92.1 m. respectively. The observations consist of 52 scans for the CO(2-1) and 46 scans for the HCN(3-2)/HCO+(3-2) with a 54.4-sec integration for each scan bracketed by the scans for the complex gain calibrator observations. Integration time per an interferometric visibility was set to 2 sec. Table 1 summarizes the observations. Both X and Y linear polarizations were received and parallel-hand correlations (XX and YY) were obtained by the ALMA 64-input correlator. For the CO(2-1) observation, two spectral windows (spws) were set in both the lower sideband (LSB) and the upper sideband (USB), with 1920 channels per spw (0.977 MHz channels resolution or 1.3 km/s velocity resolution) and 64 channels per spw (15.625 MHz channels resolution or 19.5 km/s velocity resolution) for the LSB and USB, respectively. One of the spws in the LSB was centered at the frequency slightly shifted from the expected CO(2-1) frequency so that another spw in the LSB can partially cover the CN(2-1) line 111The CN(2-1) is not detected from our observations. The spectral dynamic range should be similar to that of the CO(2-1) spw. Thus, we can give an upper limit of mJy (see Table 3).. For the HCN(3-2) and HCO+(3-2) observations, two spectral windows (spws) were set in both the LSB and the USB, with 64 channels per spw (15.625 MHz channels resolution or 19 km/s velocity resolution) and 1920 channels per spw (0.977 MHz channels resolution or 1.1 km/s velocity resolution) for the LSB and USB, respectively. Two spws in the USB were centered at the HCN(3-2) and HCO+(3-2) lines, respectively.
The data were processed at EA-ARC with the CASA 5.1.1-5 and ALMA Pipeline version 40896. Amplitude calibration was performed using measurements of the system Temperature (Tsys) on a channel-by-channel basis. Rapid phase variations on timescales of less than the gain calibration cycle were corrected using the water vapor radiometer. Unreliable data such as amplitude phase jumps and low antenna gains were automatically identified by the ALMA Pipeline and flagged. The bandpass calibration was done both in phase and amplitude. Temporal variation of the gain amplitude and phase was calibrated using the averaged XX and YY correlations of a gain calibrator. Flux scaling was derived on the bandpass calibrator using the flux information provided by the Joint ALMA Observatory (JAO). The referenced flux was derived with the interpolation (power-law spectral index of ) from measurements in Bands 3 and 7 on 2017 November 27.
After applying all calibrations, it was found that the pipeline calibration was not sufficient to correct the phase delay, which was seen in both gain calibrator and NGC 1275. The residual delay was antenna-dependent and time variable from scan to scan, which showed variations within at most psec. This amount of delay can cause the phase slope of a few degrees across one spw. Thanks to bright continuum emission of NGC 1275 (7 Jy), we calibrated the residual delay using the CASA task gaincal with gaintype=K. Since NGC 1275 can be observed at low elevation from the ALMA site, the visibility phase showed very rapid time variation, which cannot be fully corrected with usual gain calibration nor WVR correction. Thus, we performed self-calibration using the continuum emission of NGC 1275 in both phase and amplitude. The phase and amplitude self-calibration were done per integration time and scan, respectively.
The continuum emission was identified at line-free channels with the fitting order of one using the CASA task uvcontsub. Images were created with the velocity resolution of 20 km/s with the “nearest” interpolation in frequency. Deconvolution was done with the CLEAN algorithm using the CASA task tclean non-interactively. In the following sections, we show images with both naturally weighting and Briggs weighting (Briggs, 1995) of robust parameter 0.5. The beam shapes for all images are summarized in Table 2. Those for archival data (see §3.2) are also summarized in the same Table.
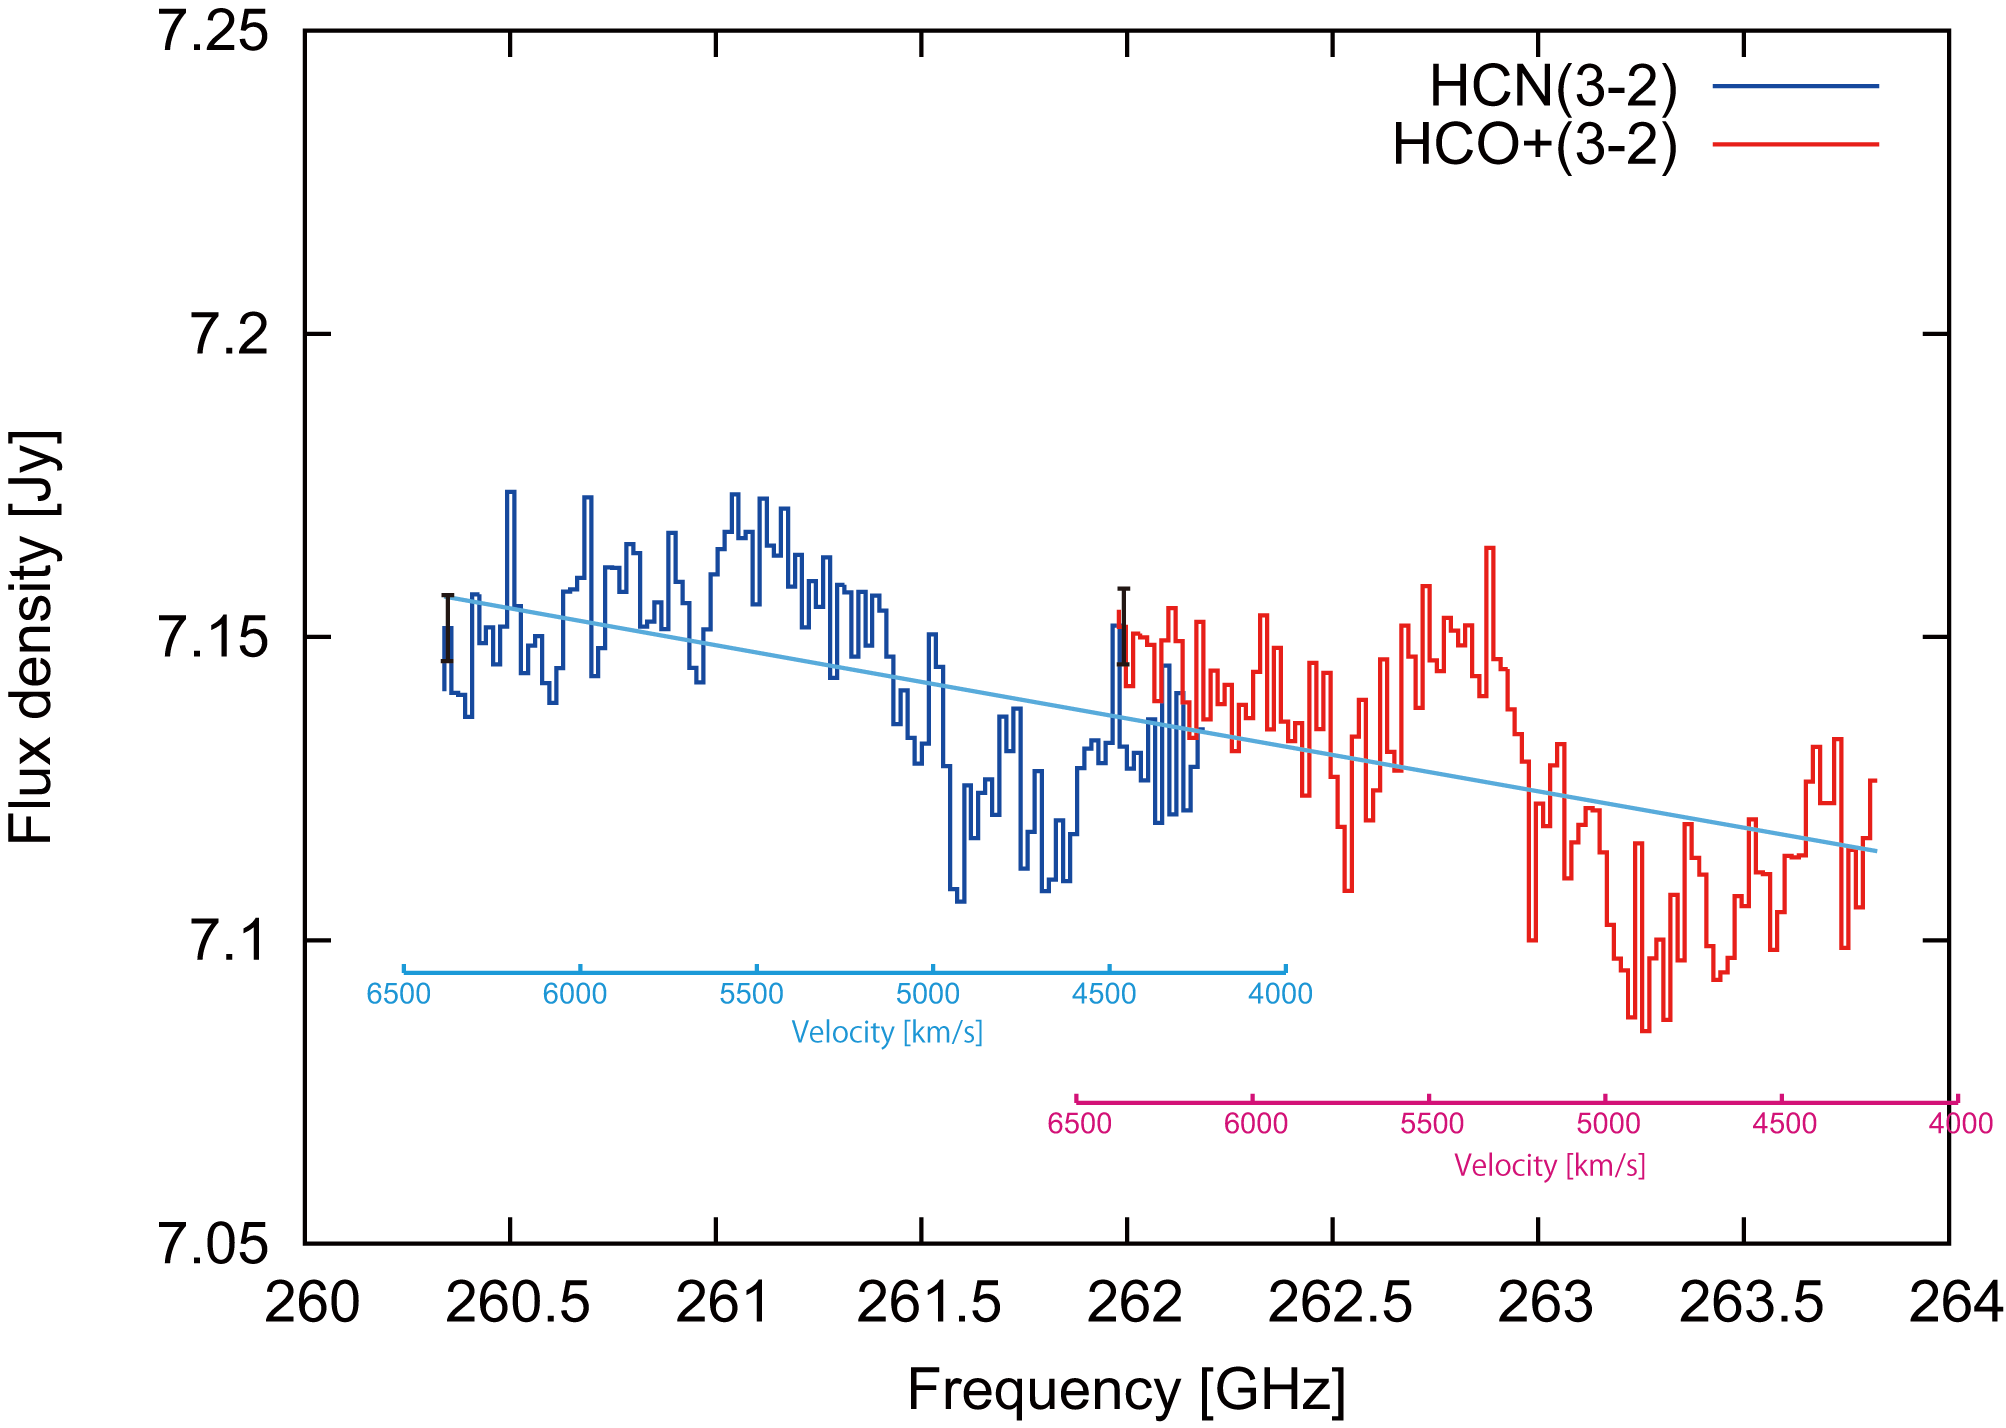
We note that some residual emissions at the image center are seen at the line-free channels even after the continuum subtraction. Those emissions are not constant over the channels but appears almost randomly from channel to channel. This is most likely due to the limitation of spectral dynamic range caused by the bandpass calibration uncertainty. Assuming that the bandpass accuracy depends on the signal-to-noise ratio of bandpass calibrator and the residual after the bandpass calibration is random over antennas and frequency, we can estimate the spectral dynamic range as where is the flux density of bandpass calibrator and is the sensitivity for the bandpass calibrator scan. We estimate using the measured image rms on the bandpass calibrator image. The image of the target source should also exhibit the error given by after the continuum subtraction, where is the continuum flux density of target source. Table 3 summarizes the value of these parameters. The estimated spectral dynamic range is nearly consistent with the demonstrated spectral dynamic range of given in the ALMA Proposer’s Guide and Technical Handbook (Andreani et al., 2018; Warmels et al., 2018). Using the measured continuum emission for IT, we obtain an uncertainty () of 6.8 mJy, 5.5 mJy, and 6.3 mJy for the CO(2-1), HCN(3-2), and HCO+(3-2) lines, respectively. These uncertainties dominate the off-position image rms of mJy (see section 3). In the following sections, we will show the observed spectra integrated over the aperture of -diameter circle and -diameter circle. We propagate the above uncertainties into our analysis for the spectra. We obtain of 4.3 mJy for both the HCN(3-2) and HCO+(3-2) for the archival data (see §3.2). The reason for a better in the archival data is that the data was taken in relatively good weather condition in terms of the Tsys and WVR, and the bandpass calibrator is brighter so that it provides a better signal-to-noise ratio for the bandpass calibration. For an additional validation, we measured the image rms within the same aperture used for Figure 3 after the continuum subtraction for the line-free spws. The measured rms is about 0.9 mJy, which is smaller than . Thus, we confirmed that the baseline oscillation in line-free spws does not exceed the estimated uncertainties.
| Target Lines | ToS [min]aafootnotemark: | NoAbbfootnotemark: | Bandpassccfootnotemark: | Gainddfootnotemark: | Tsyseefootnotemark: | MRSfffootnotemark: |
|---|---|---|---|---|---|---|
| CO(2-1) | 45 | 47 | J0237+2848 | J0313+4120 | 100 K | (610 pc) |
| HCN(3-2), HCO+(3-2) | 39 | 47 | J0237+2848 | J0313+4120 | 120 K | (530 pc) |
| Target Lines | Naturalaafootnotemark: | Briggsbbfootnotemark: |
|---|---|---|
| CO(2-1) | at | at |
| HCN(3-2) | at | at |
| HCO+(3-2) | at | at |
| HCN(3-2) (archival data) | -ccfootnotemark: | at |
| HCO+(3-2) (archival data) | -ccfootnotemark: | at |
| Target Lines | [GHz] aafootnotemark: | IBP [Jy]bbfootnotemark: | [mJy]ccfootnotemark: | Dspecddfootnotemark: | IT [Jy]eefootnotemark: | [mJy]fffootnotemark: |
|---|---|---|---|---|---|---|
| CO(2-1) | 230.538 | 1.082 | 1.03 | 1050 | 7.15 | 6.81 |
| HCN(3-2) | 265.886 | 0.989 | 0.76 | 1301 | 7.14 | 5.49 |
| HCO+(3-2) | 267.558 | 0.985 | 0.87 | 1132 | 7.13 | 6.30 |
| HCN(3-2) (archival data) | 265.886 | 1.595 | 0.75 | 2141 | 9.26 | 4.33 |
| HCO+(3-2) (archival data) | 267.558 | 1.590 | 0.75 | 2134 | 9.26 | 4.34 |
3. RESULTS
3.1. The CO(2-1) Line
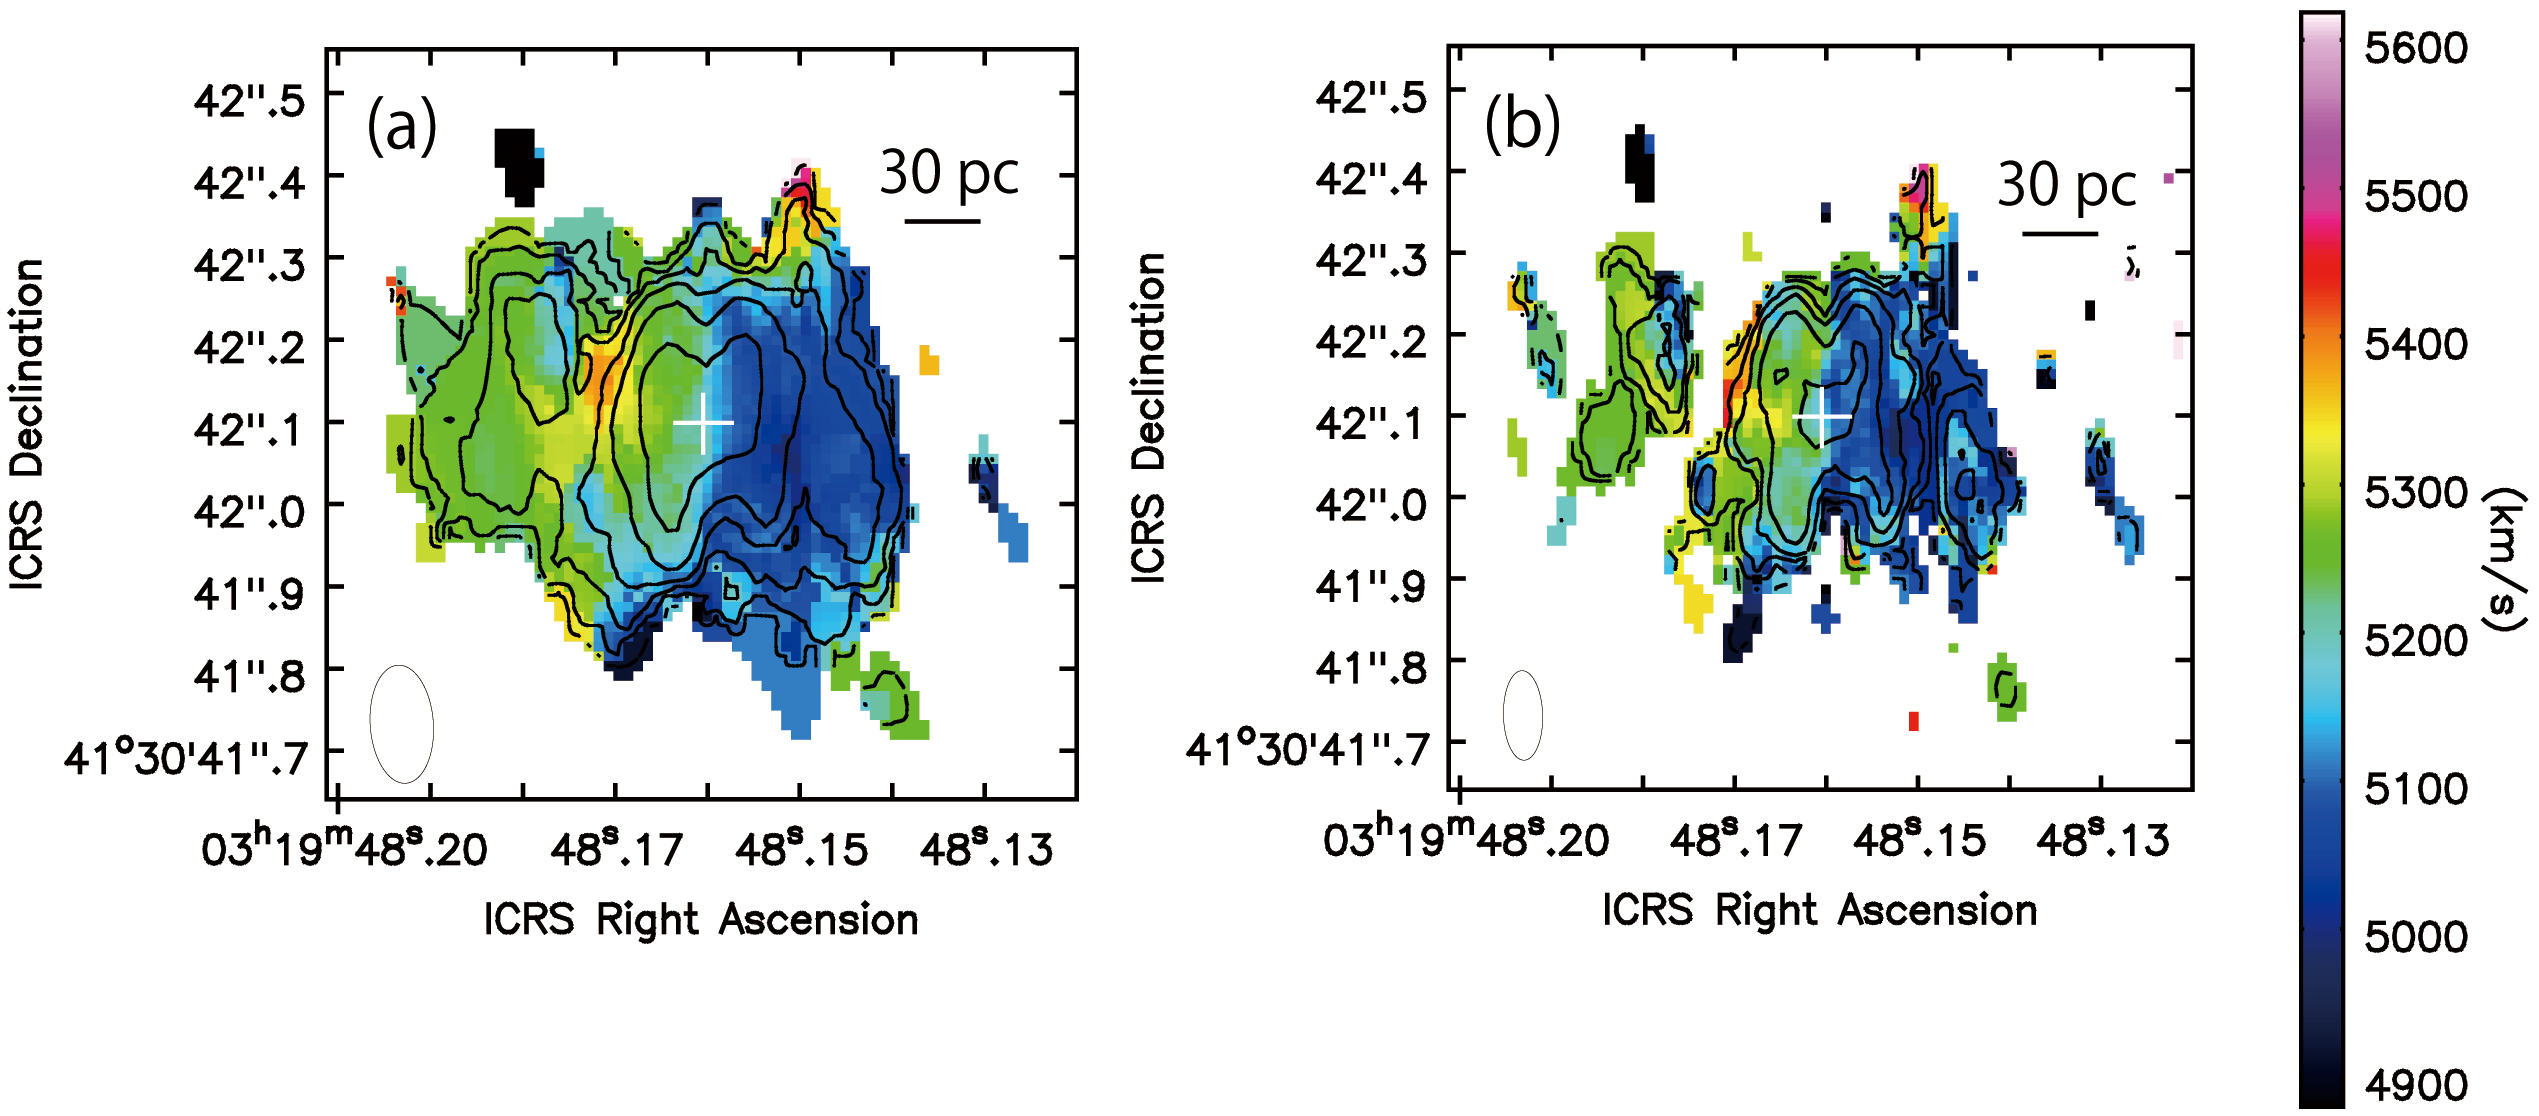
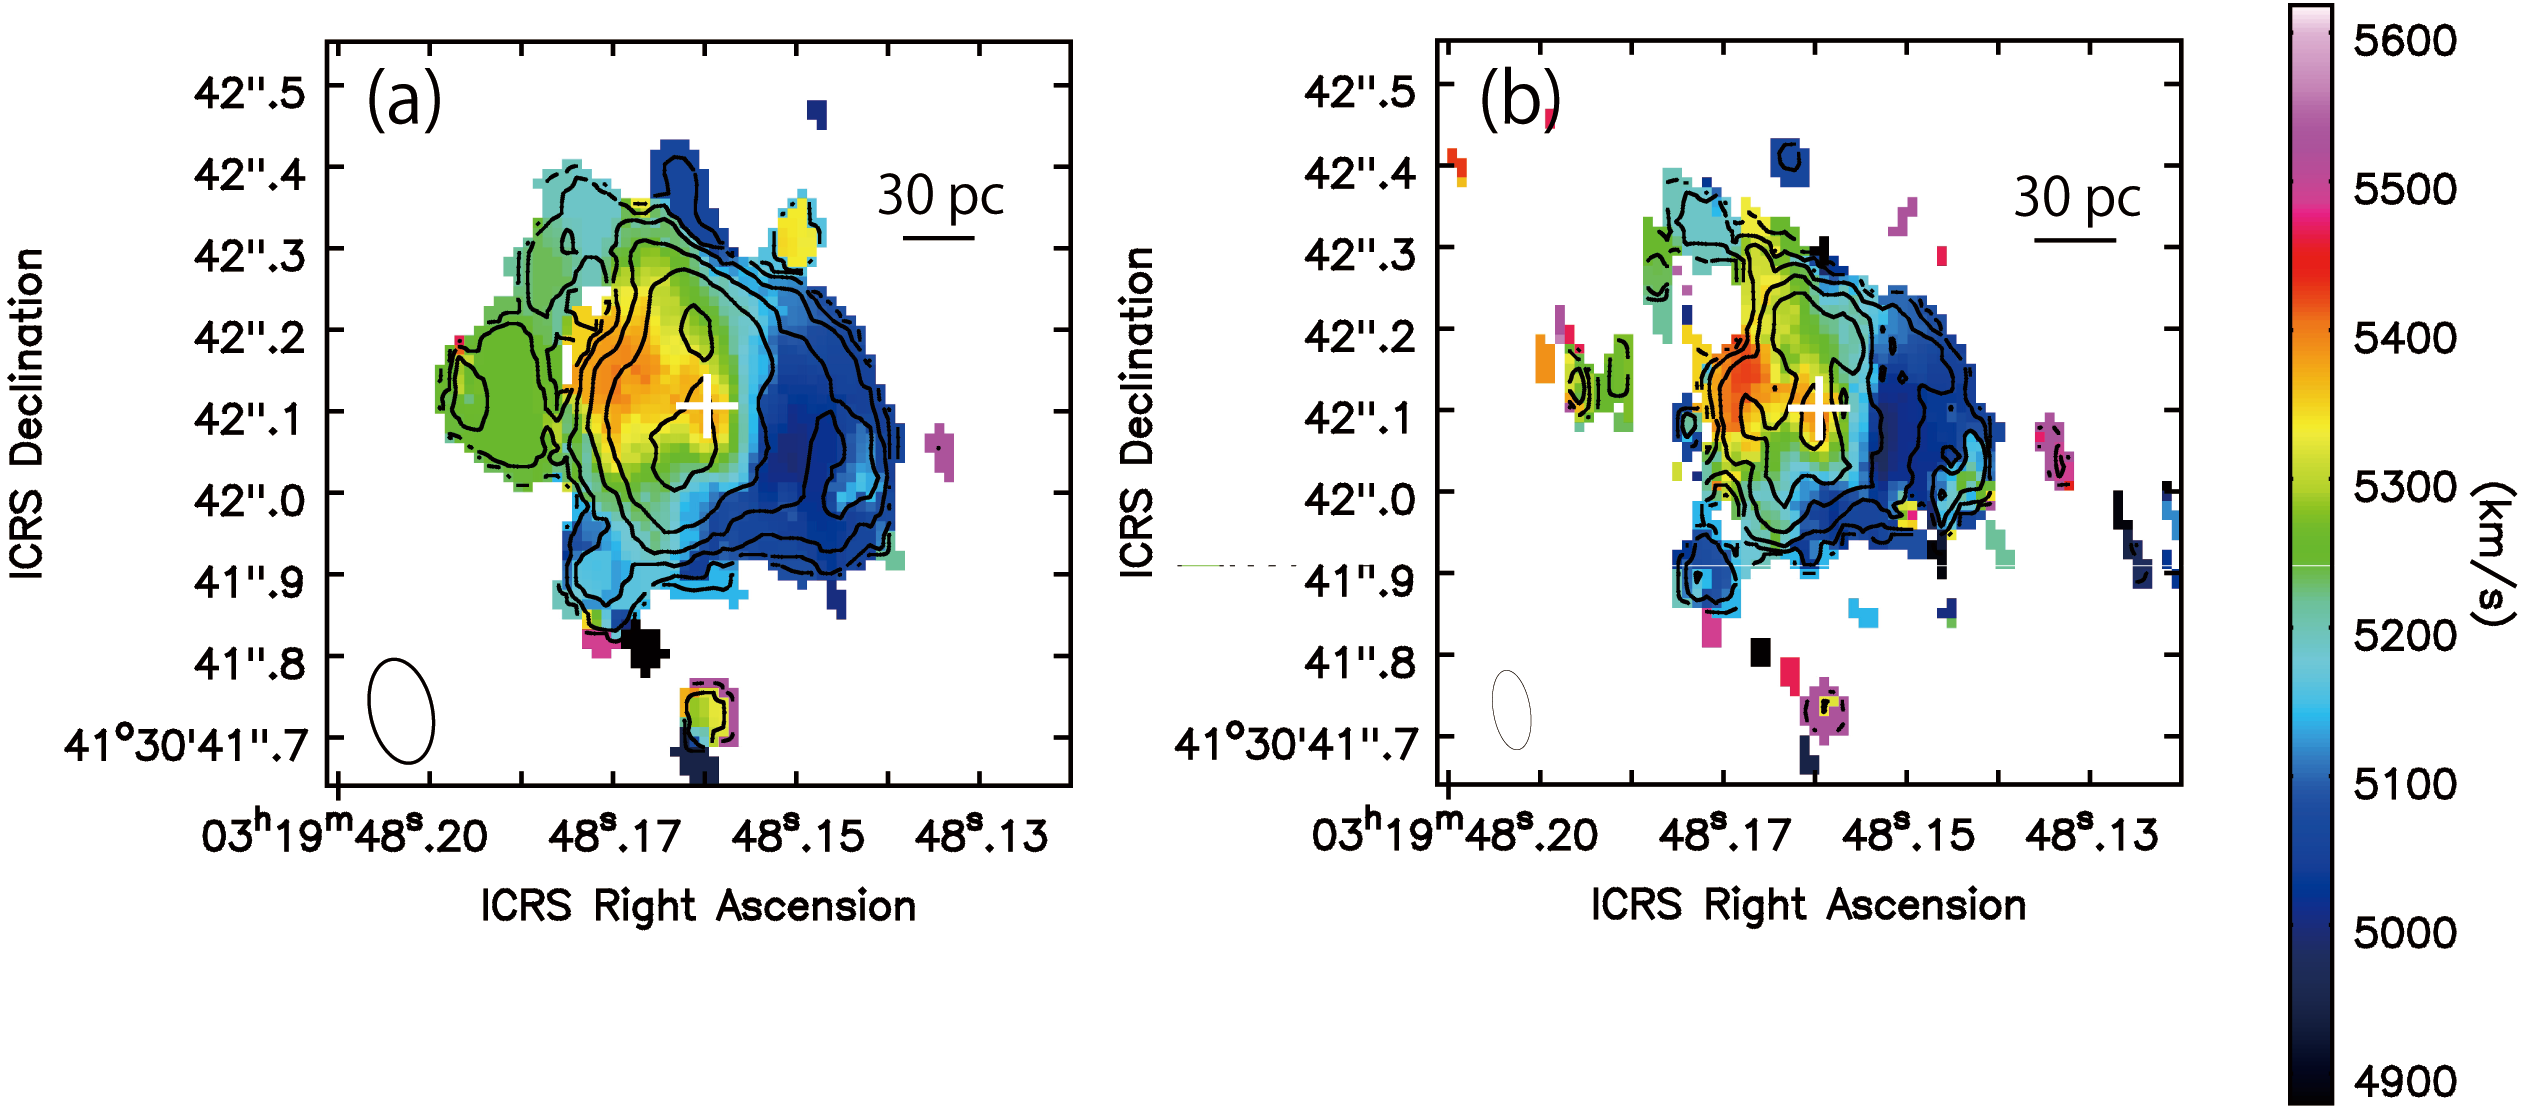
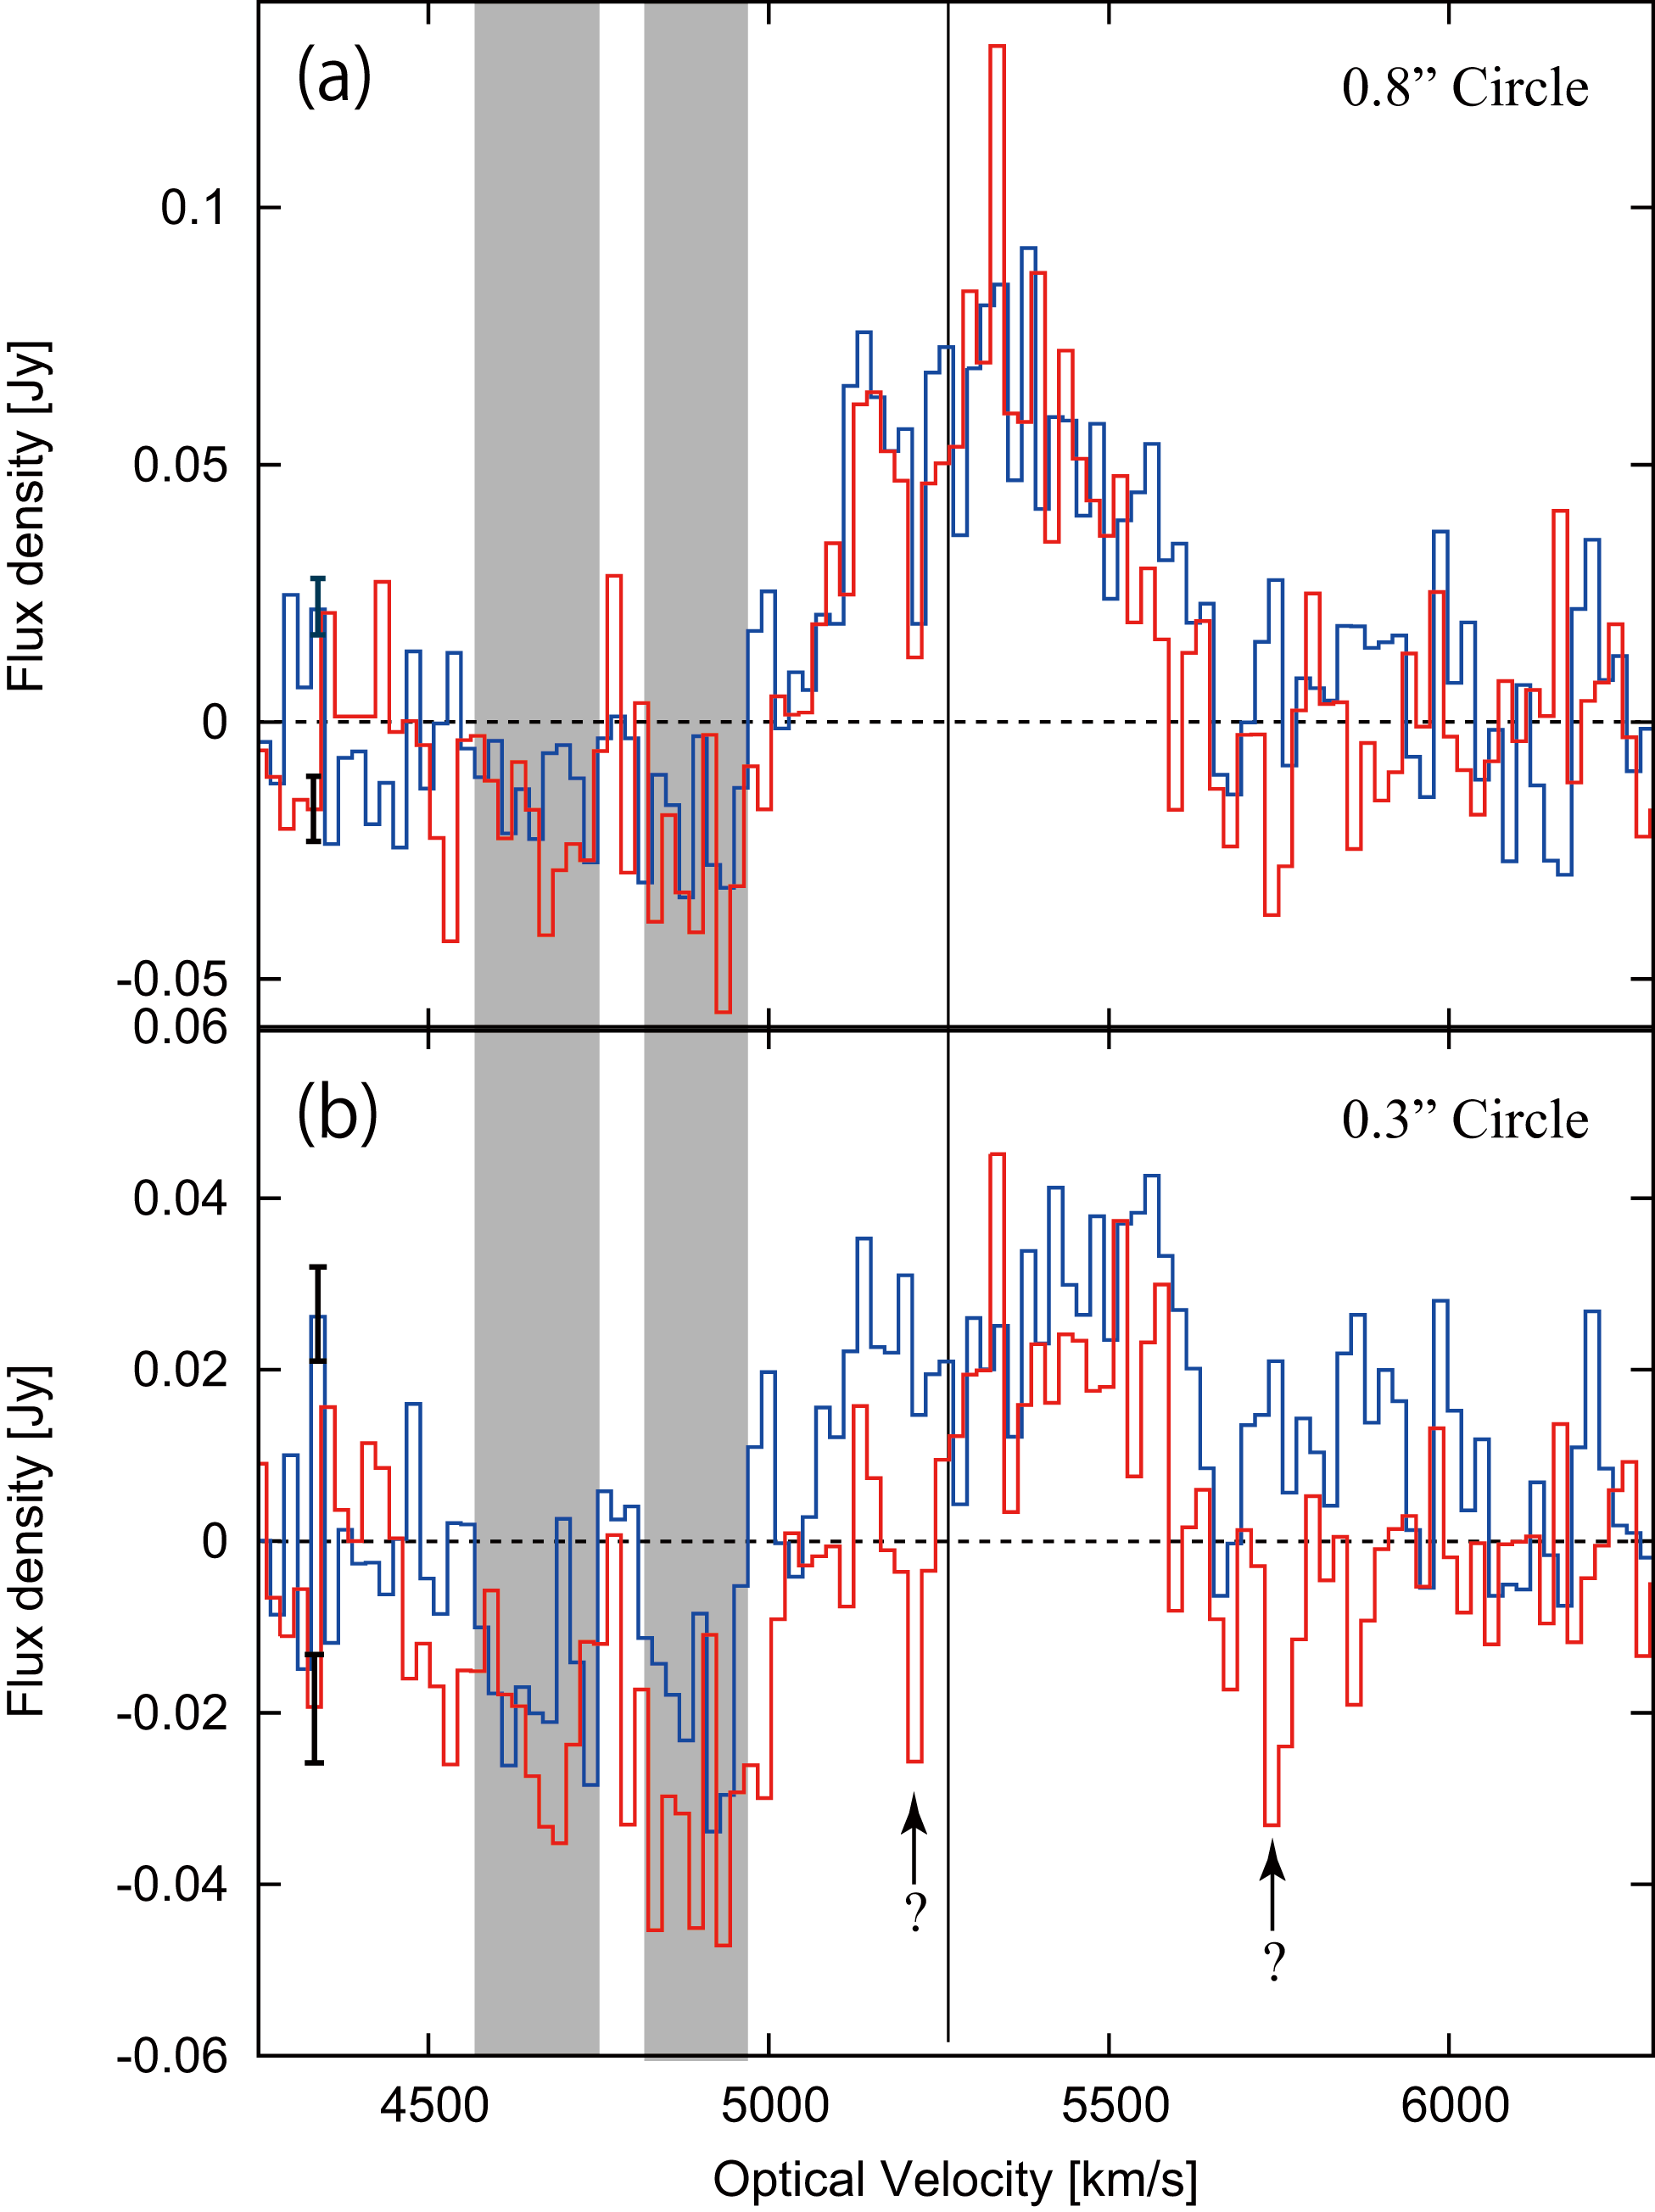
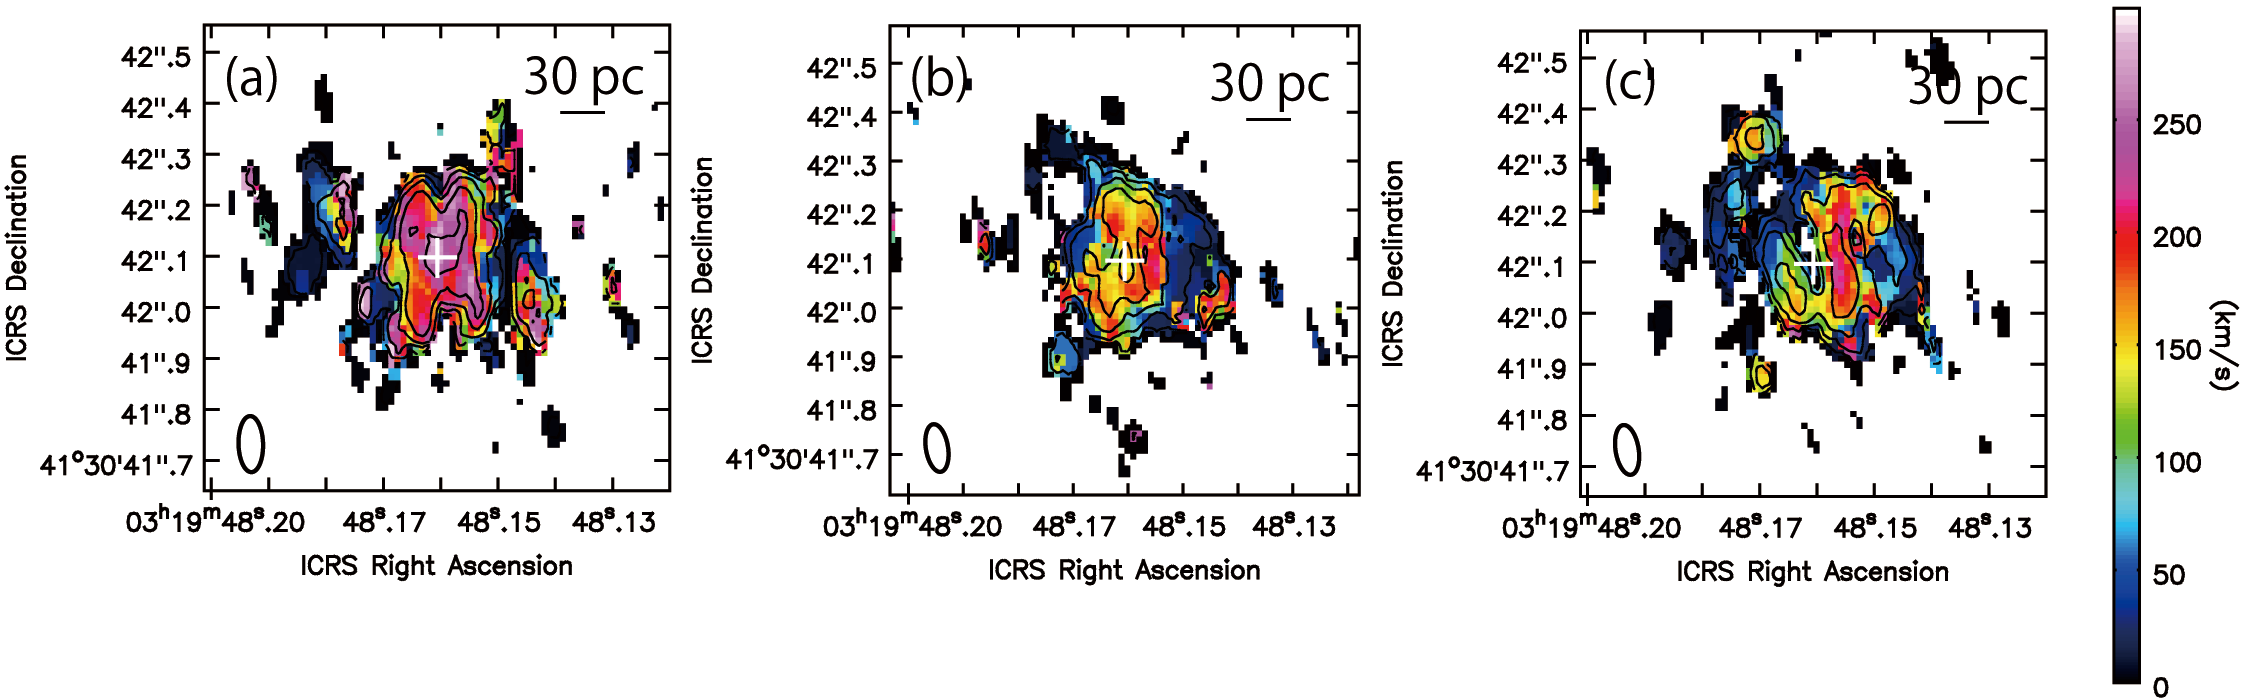
Figure 1(a) shows the contour of naturally-weighted velocity-integrated map (moment 0 map) overlaid on the velocity-weighted intensity map (moment 1 map) of the CO(2-1) line. The emissions are mostly detected within a radius of 100 pc. The structure seems to show a disk-like morphology. We can see a clear velocity gradient with about km s-1 in a position angle of (Figure 2). The intensity-weighted velocity at the AGN position is about 5200 km s-1, which is consistent with the optical systemic velocity. The velocity gradient likely originates in the rotational motion of the gas disk, which is also evident in the HCN(3-2) and HCO+(3-2) emissions (see next subsection). The integrated spectrum over the central 0.8 is shown in Figure 3. The emission is centered nearly at the systemic velocity, ranging from km s-1 ( km s-1) to km s-1 ( km s-1). Previous Gemini observations of the warm H2 gas (Scharwächter et al., 2013) revealed a similar rotating disk structure within a radius of ( pc). The line width of the warm H2 gas shows km s-1 of FWHM. Both morphological and kinematical structures of CO(2-1) as well as its spectral shape are quite consistent with those for the warm H2 gas, but our observed disk seems to have clumpy or filamentary substructures (see the higher angular resolution image created using the Briggs weighting with the robust parameter of 0.5, Figure 1(b)). The CO counterpart of the H2 gas stream, the south-west from the center (Scharwächter et al., 2013), is not detected in our images. We note that there should be missing flux of extended structure in our data because of the lack of short interferometric baselines, so the whole structure of the disk can be larger. The peak flux ( Jy) of the integrated spectrum (Figure 3) is about a half of that of the “inner filament” (see Fig. 4(a)) presented in Lim et al. (2008). The peak of the spectrum is at 5340 km s-1, which is about 100 km s-1 redshifted from the systemic velocity, while the spectral shape of the inner filament in Lim et al. (2008) is rather symmetric and centered at the systemic velocity. This indicates that the blue-shifted emission is resolved-out even more strongly in our observations.
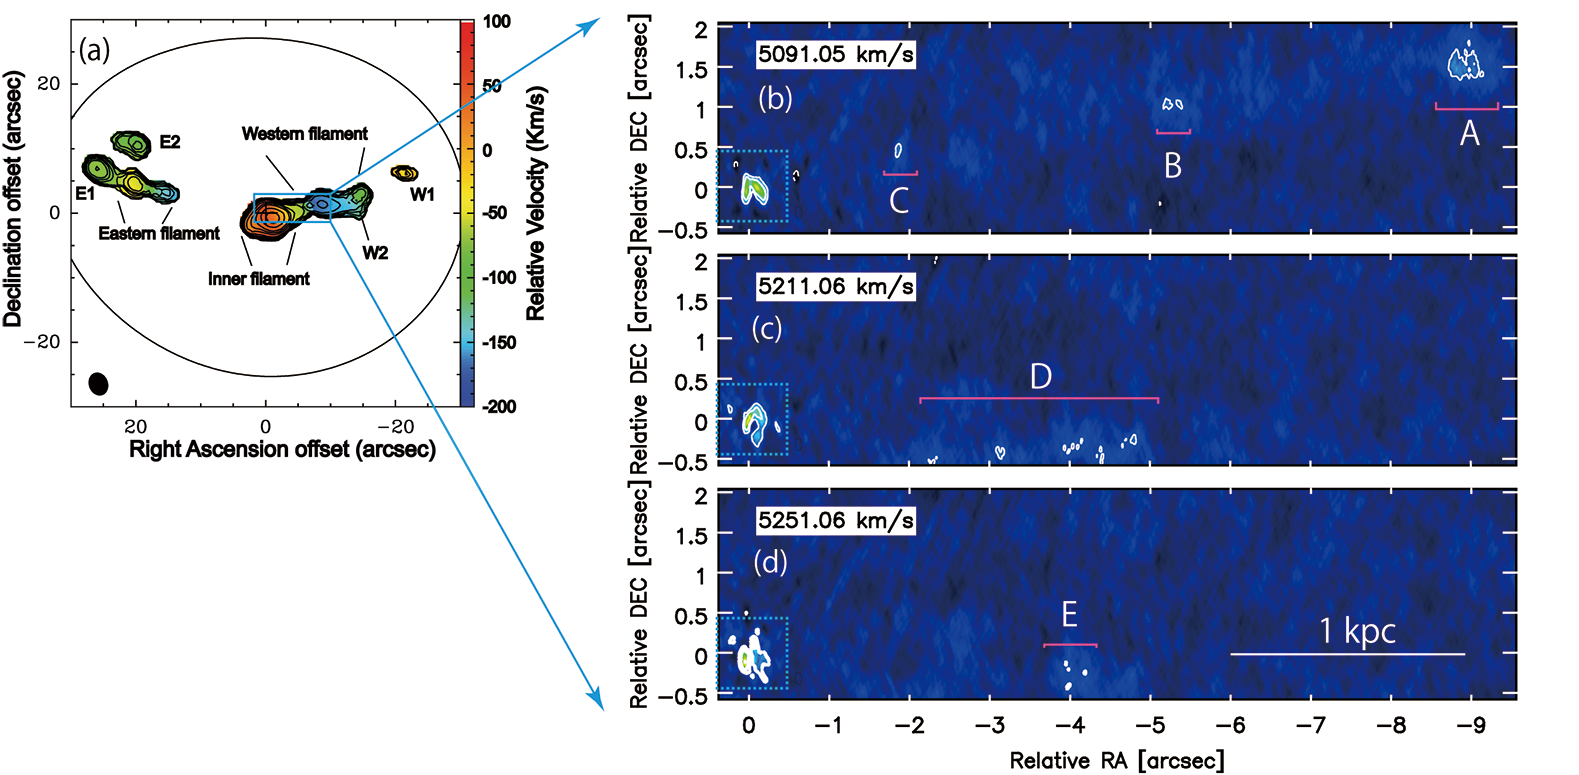
Some extended features are marginally detected in the western region in the naturally-weighted image (Figure 4). Three components (denoted A, B, and C in Figure 4(b)) are mainly detected at , , and from the center in a position angle of at km s-1 ( km s-1). Those components probably represent dense, compact regions within the filaments reported by Lim et al. (2008). One of the outer components (A) was identified as a prominent knot-like feature with relative velocity of km s-1 in the western filament in Lim et al. (2008). The inner components (B and C) seems to constitute the western elongation of the inner filament. Another features (denoted D in Figure 4(c)) is marginally detected at - from the center in a position angle of deg at km s-1 ( km s-1). A part of the feature is also detected at km s-1 ( km s-1, denoted E in Figure 4(d)). No emission, except for the main disk emission, is detected at other velocity channels. All the features from km s-1 to km s-1 seems to be hardly reproduced by a single stream of infalling gas since all the components are not aligned in the same position angle. Lim et al. (2008) also pointed out that the inner filament and the western filament are separate structures because of their different kinematic structures, and we confirmed this in our high resolution images.
3.2. The HCN(3-2) and HCO+(3-2) Lines
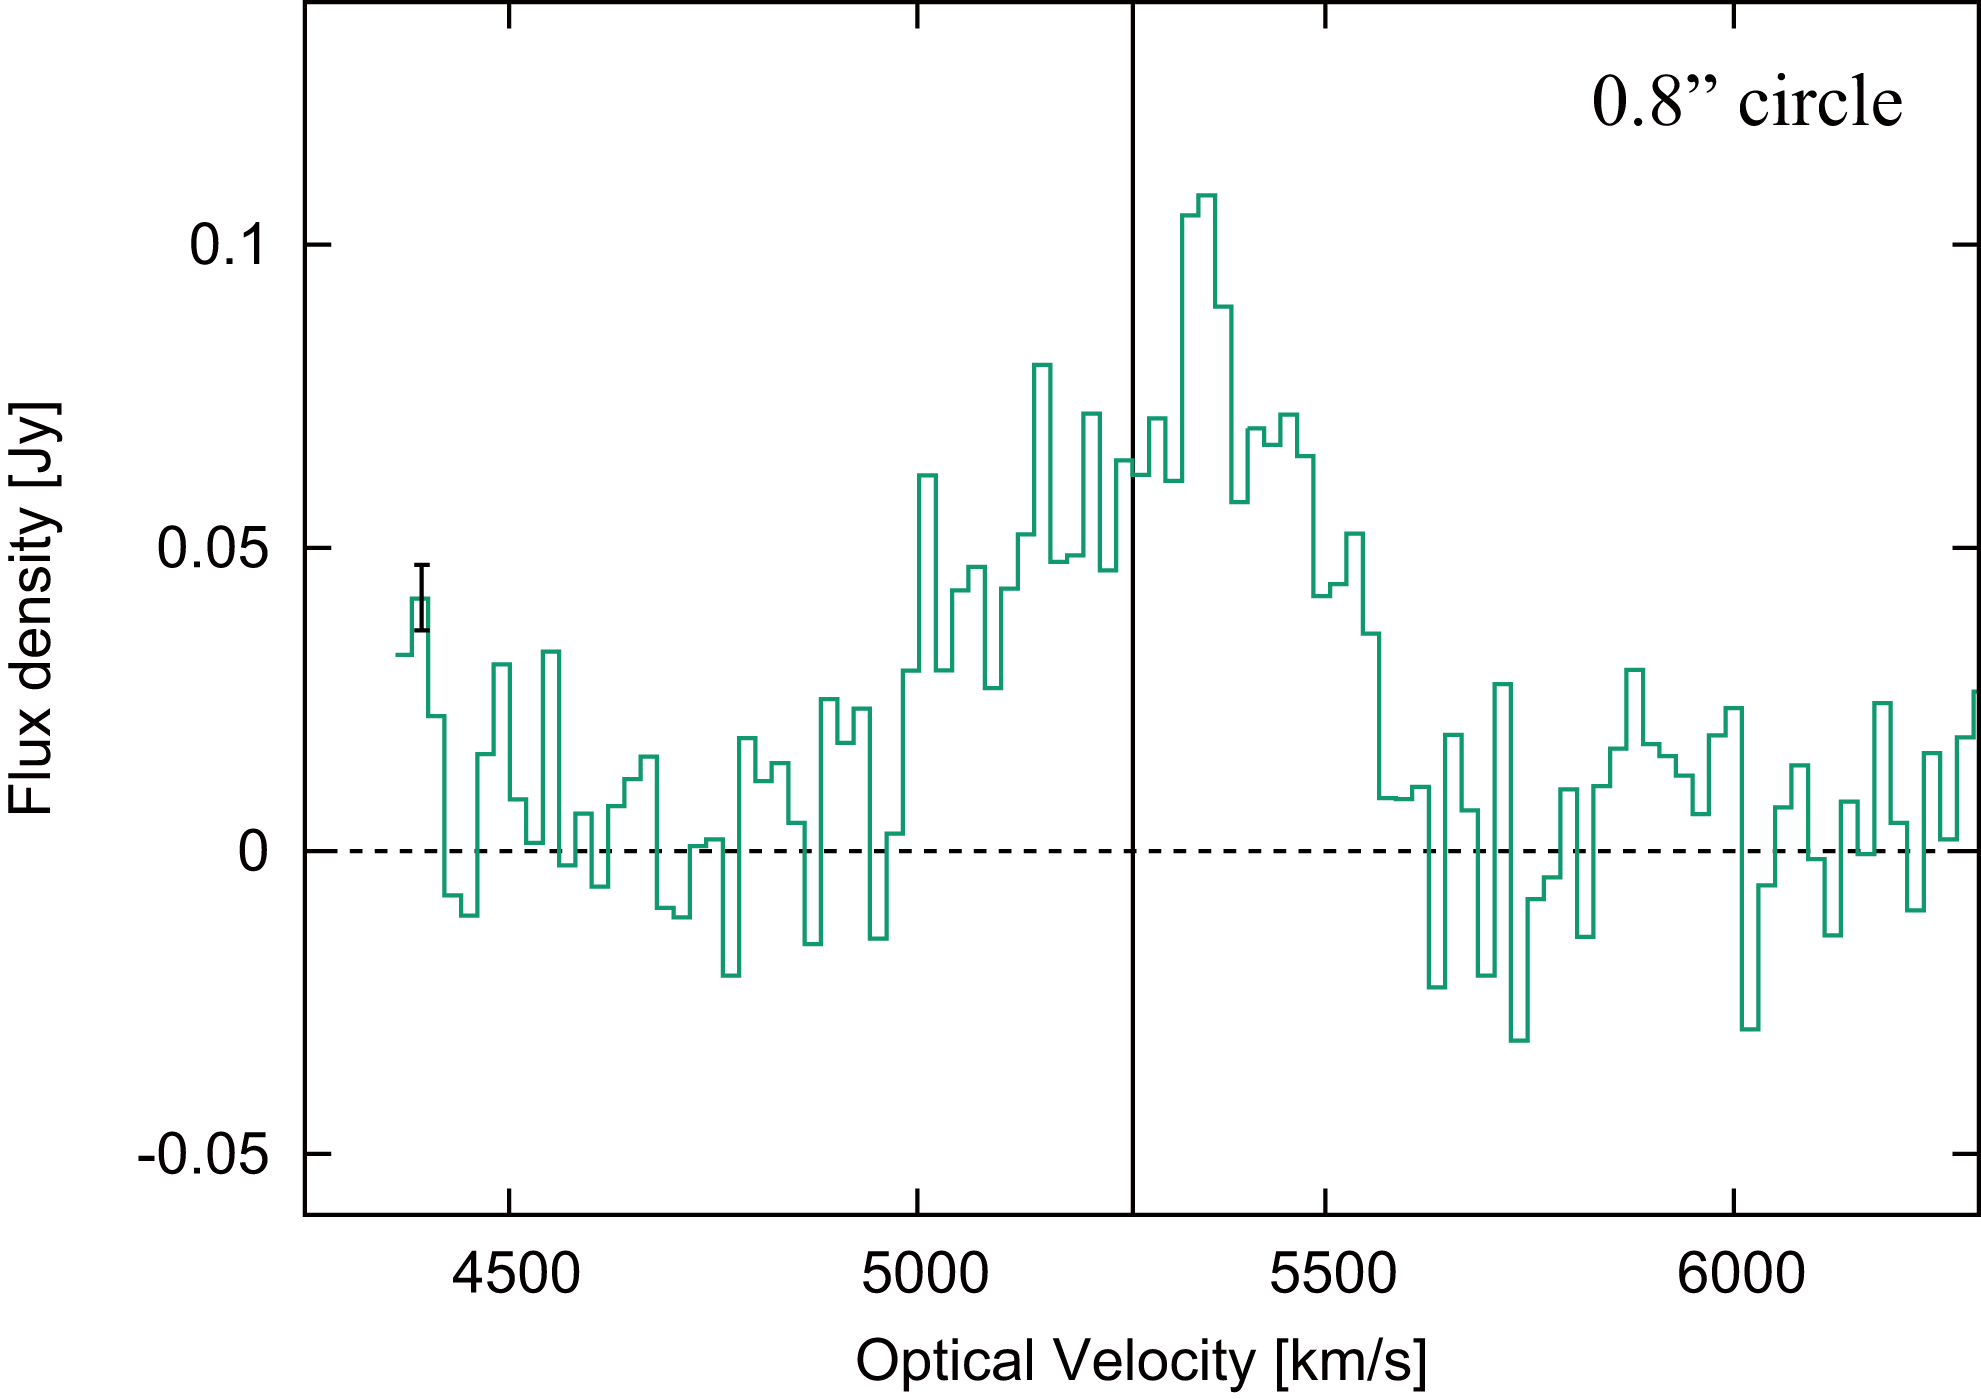
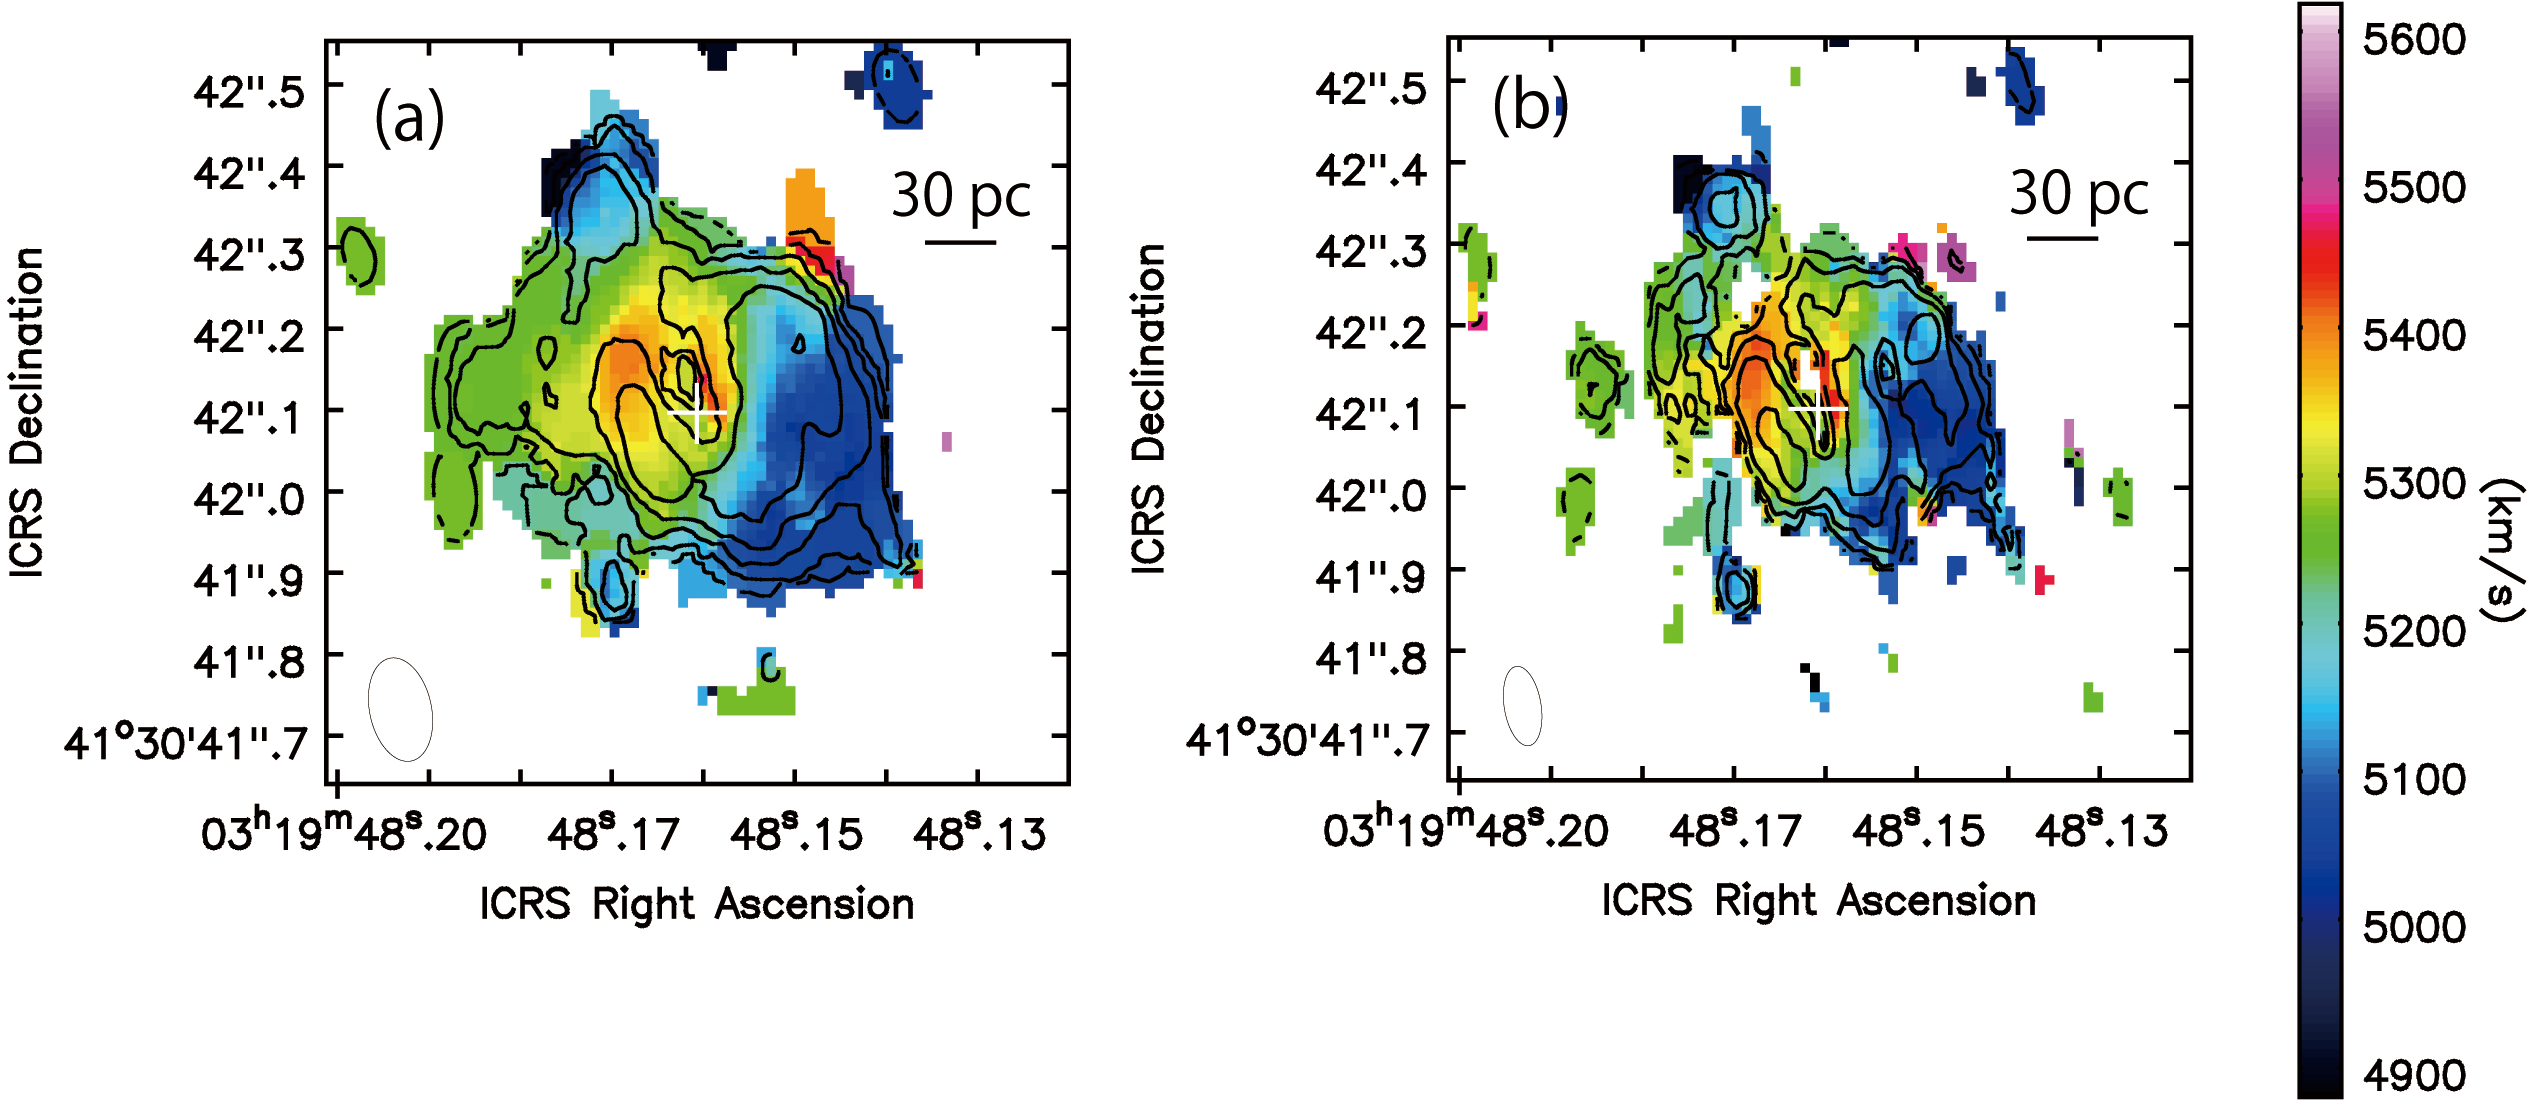
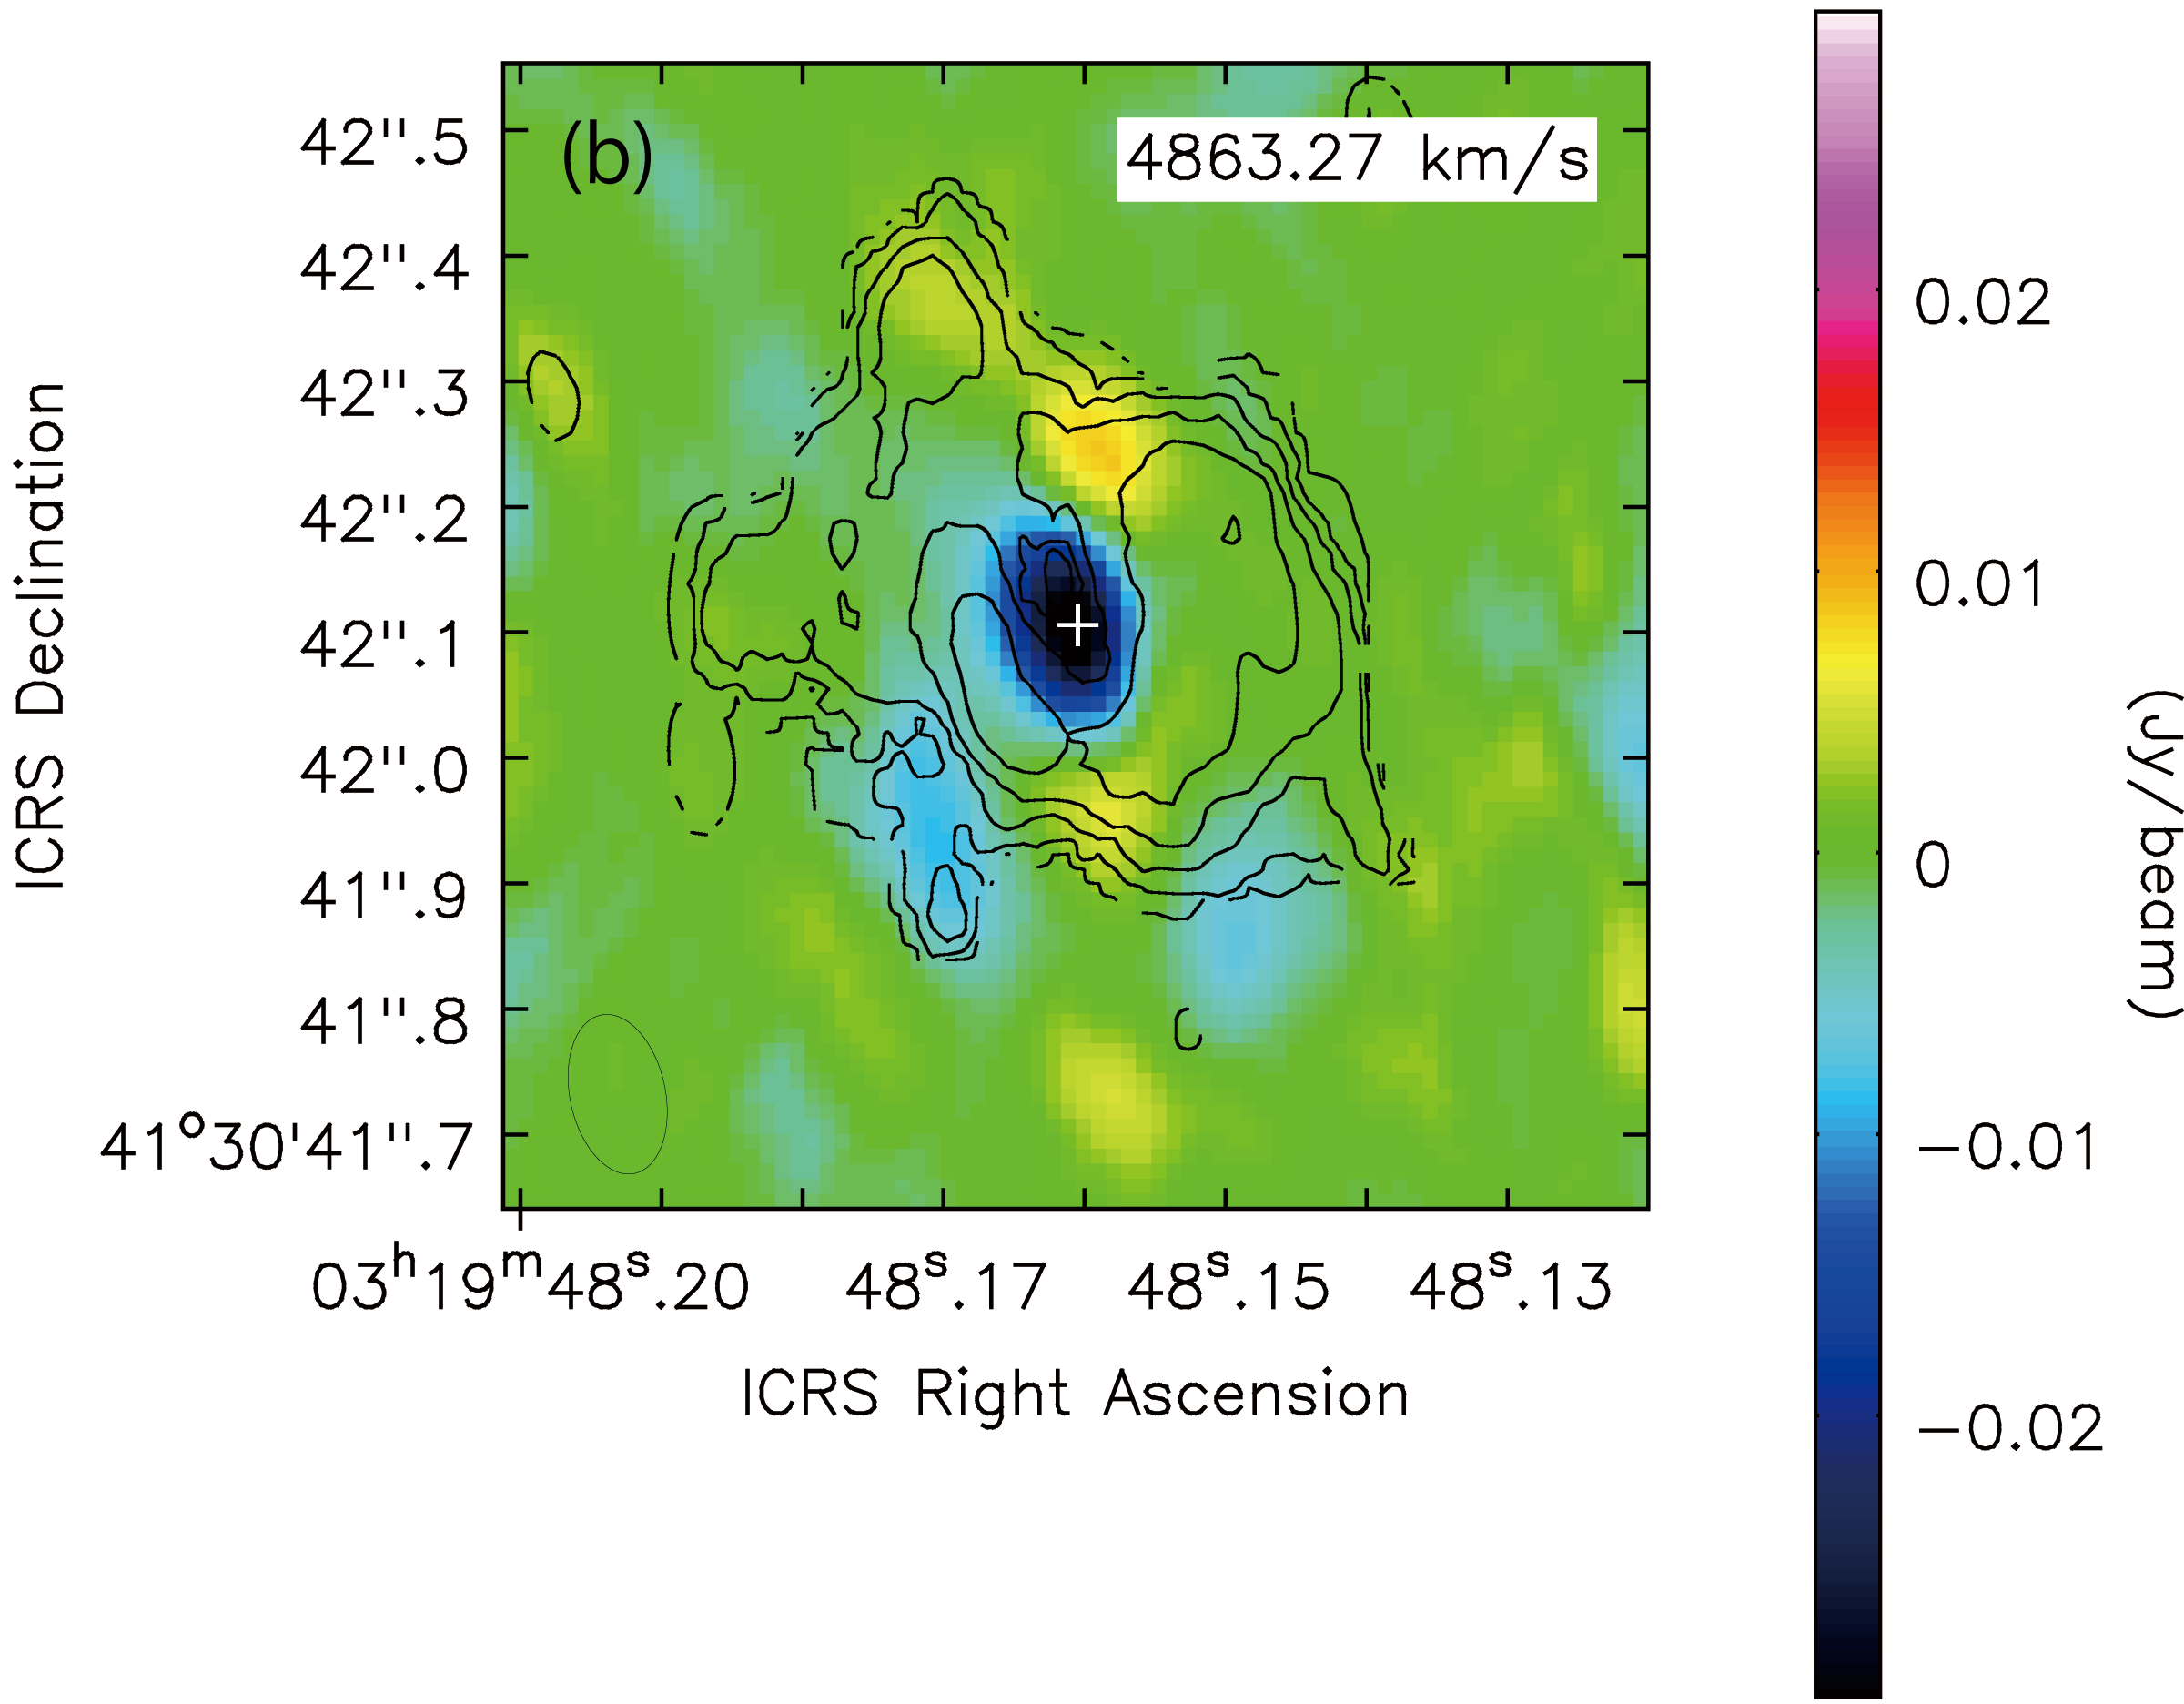
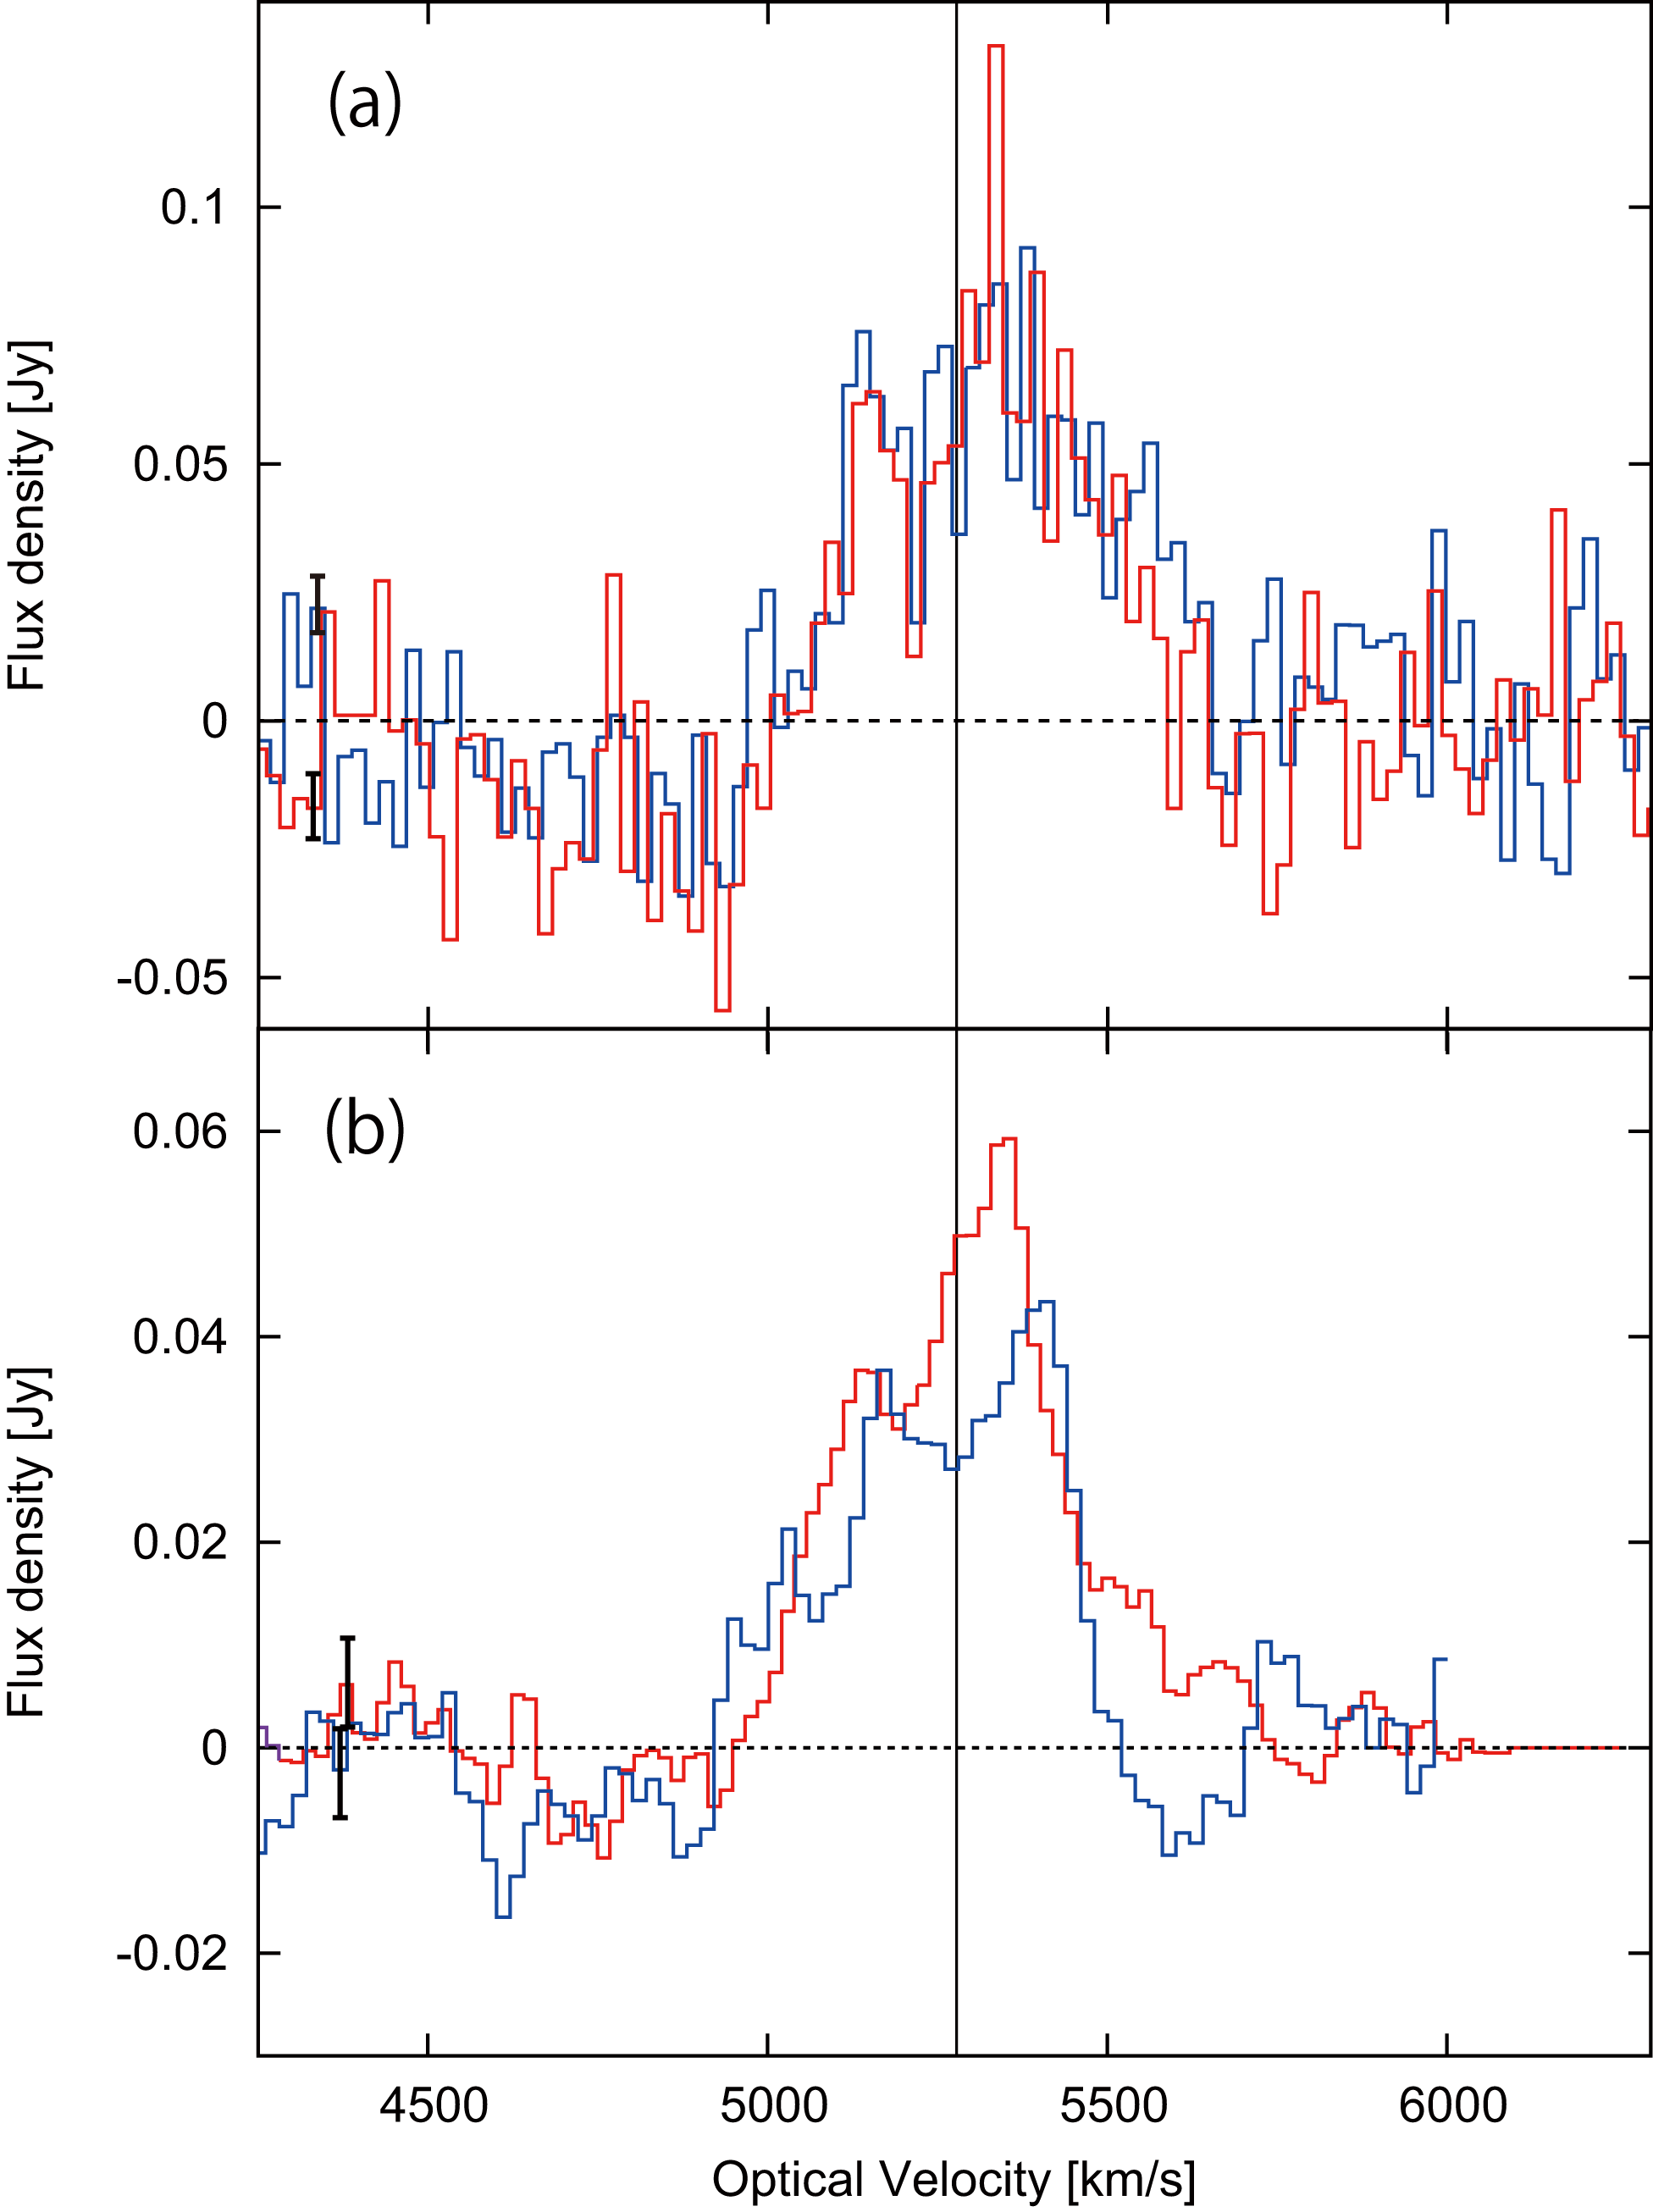
Figure 5(a) and Figure 6(a) show the contours of naturally-weighted moment 0 maps overlaid on the moment 1 maps of the HCN(3-2) and HCO+(3-2), respectively. The images created with the Briggs weighting are also shown in Figure 5(b) and Figure 6(b). These emissions are detected only within a radius of 100 pc, and the morphological and kinematical structures are also similar to those of the CO(2-1) emission. Those molecules also show the velocity gradient, as seen in the CO(2-1) emission. Figure 7(a) shows the spectrum integrated over the central . Those spectral shapes are similar to the CO(2-1) spectrum, which is peaked at km s-1 and ranging from 5000 km s-1 to 5600 km s-1. Previous single dish observations showed a consistent line width and line peak (Salomé et al., 2008; Bayet et al., 2011).
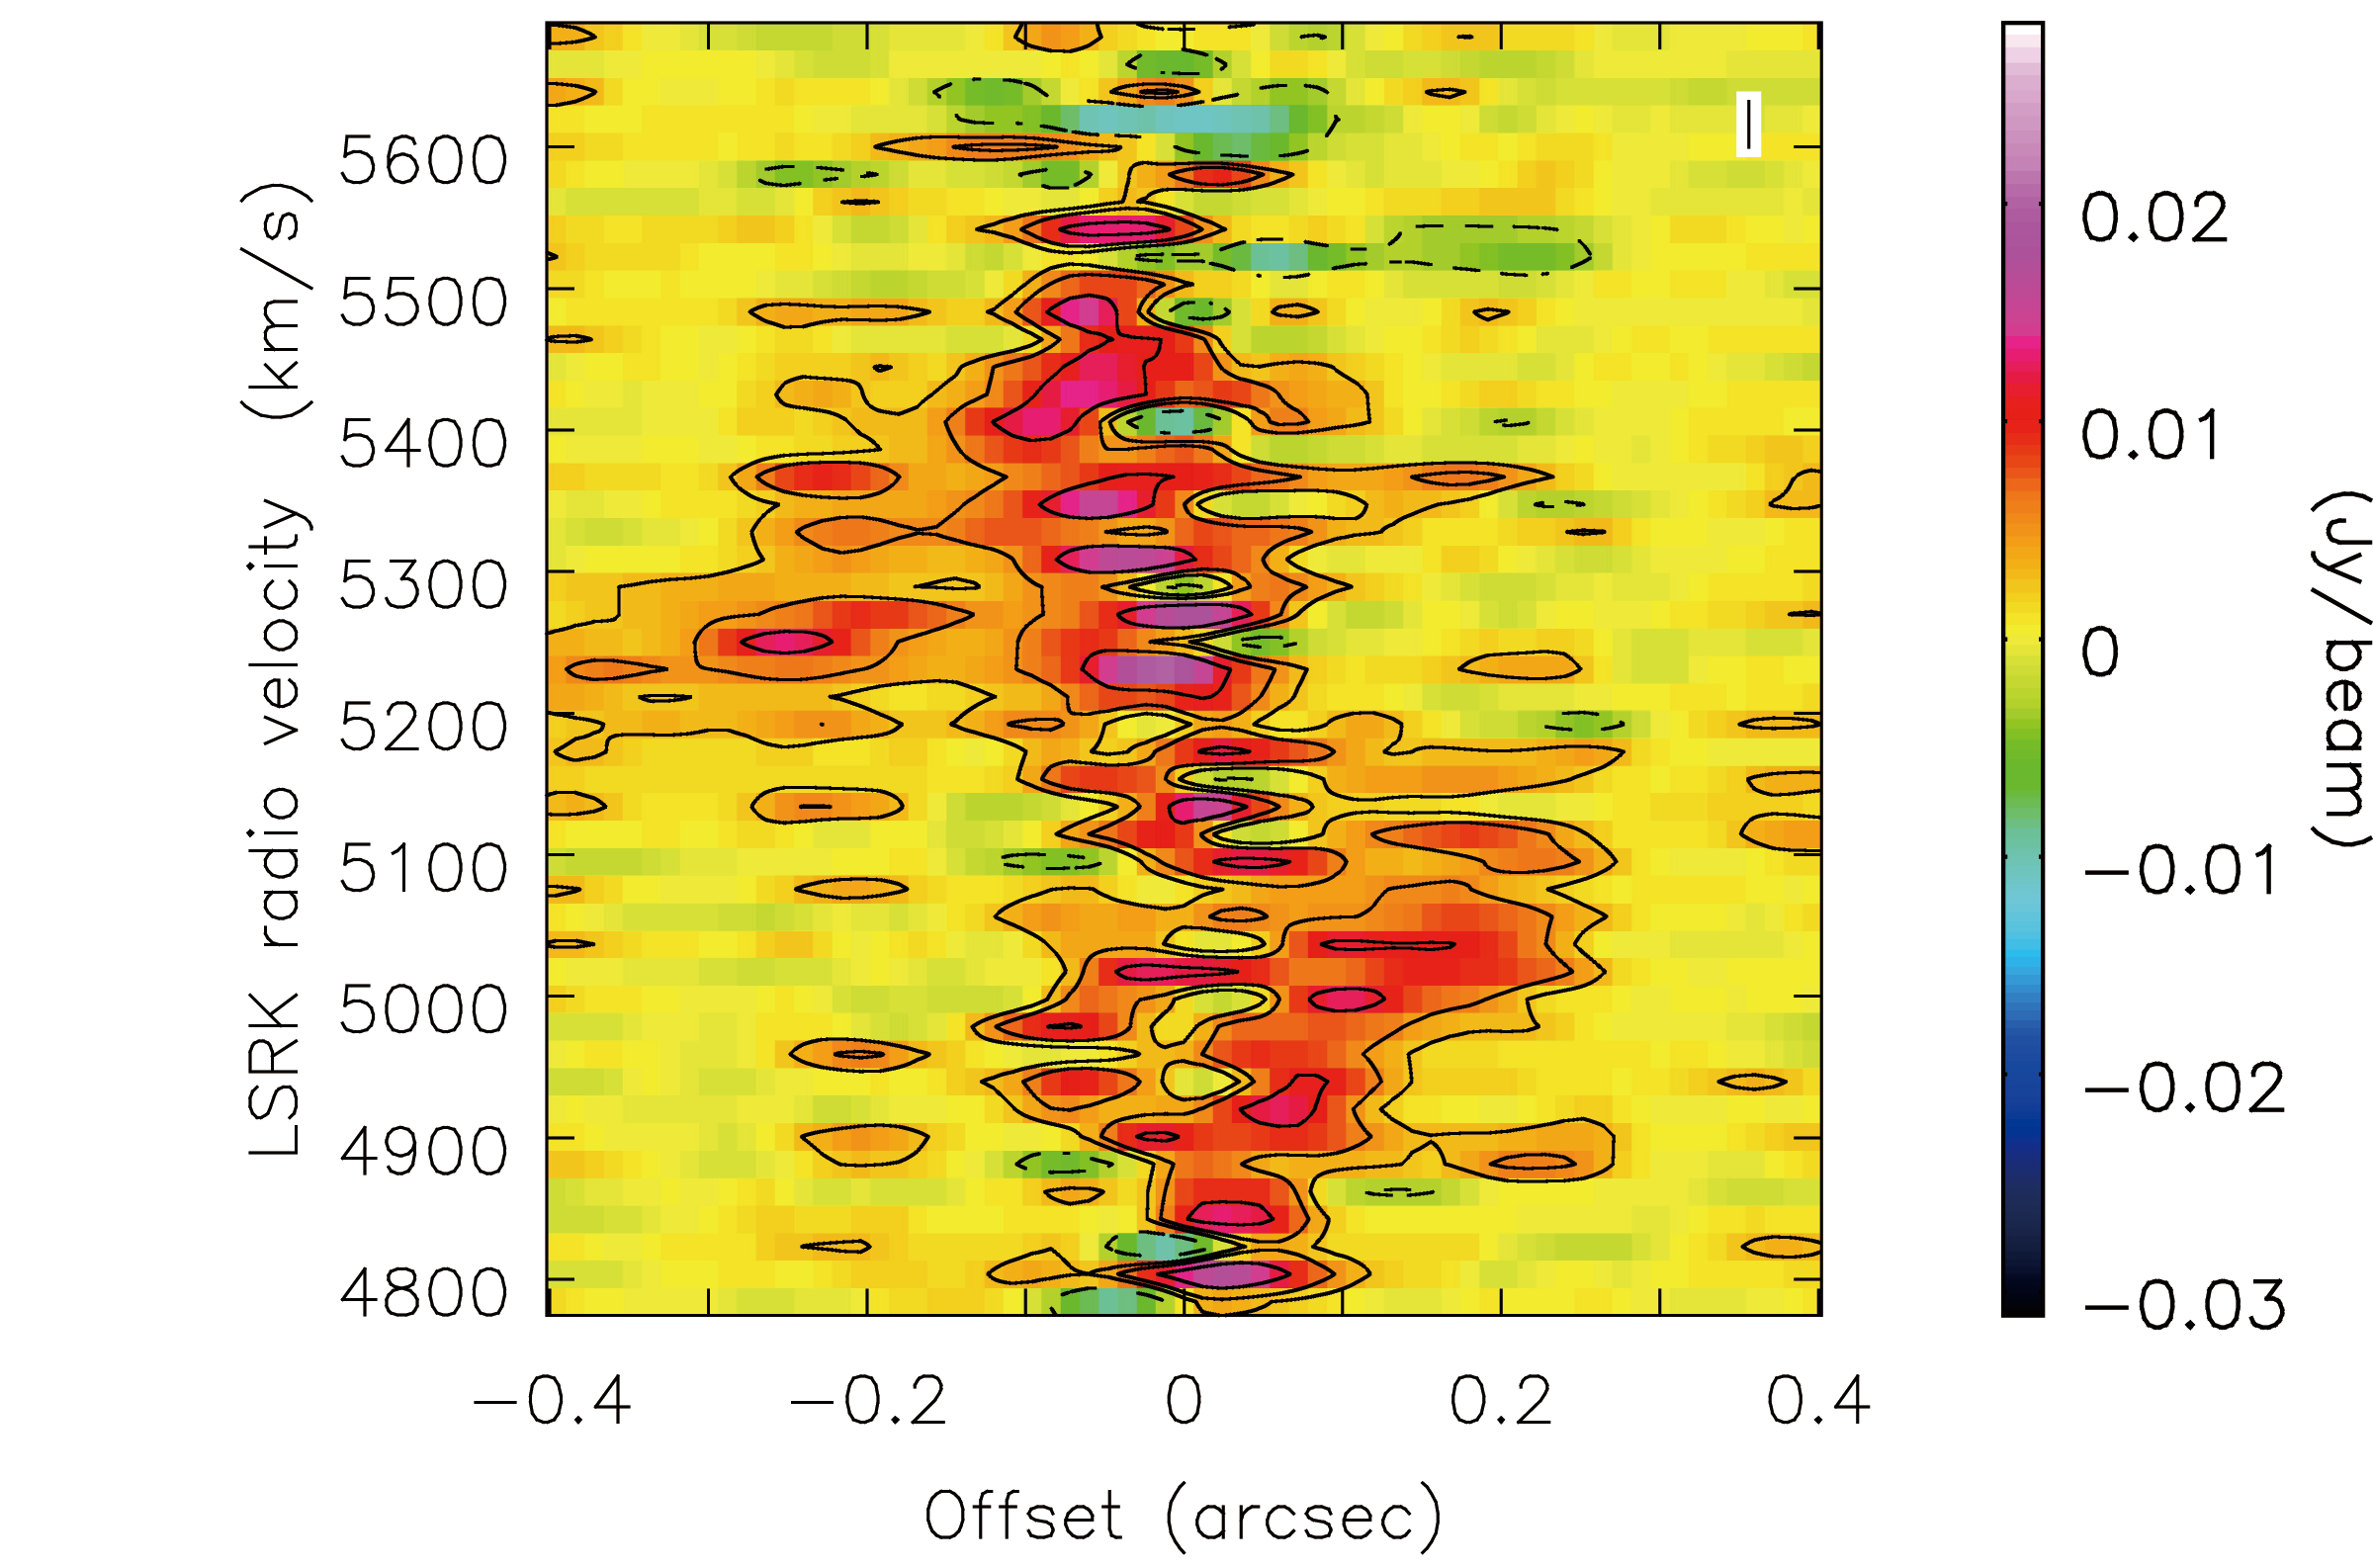
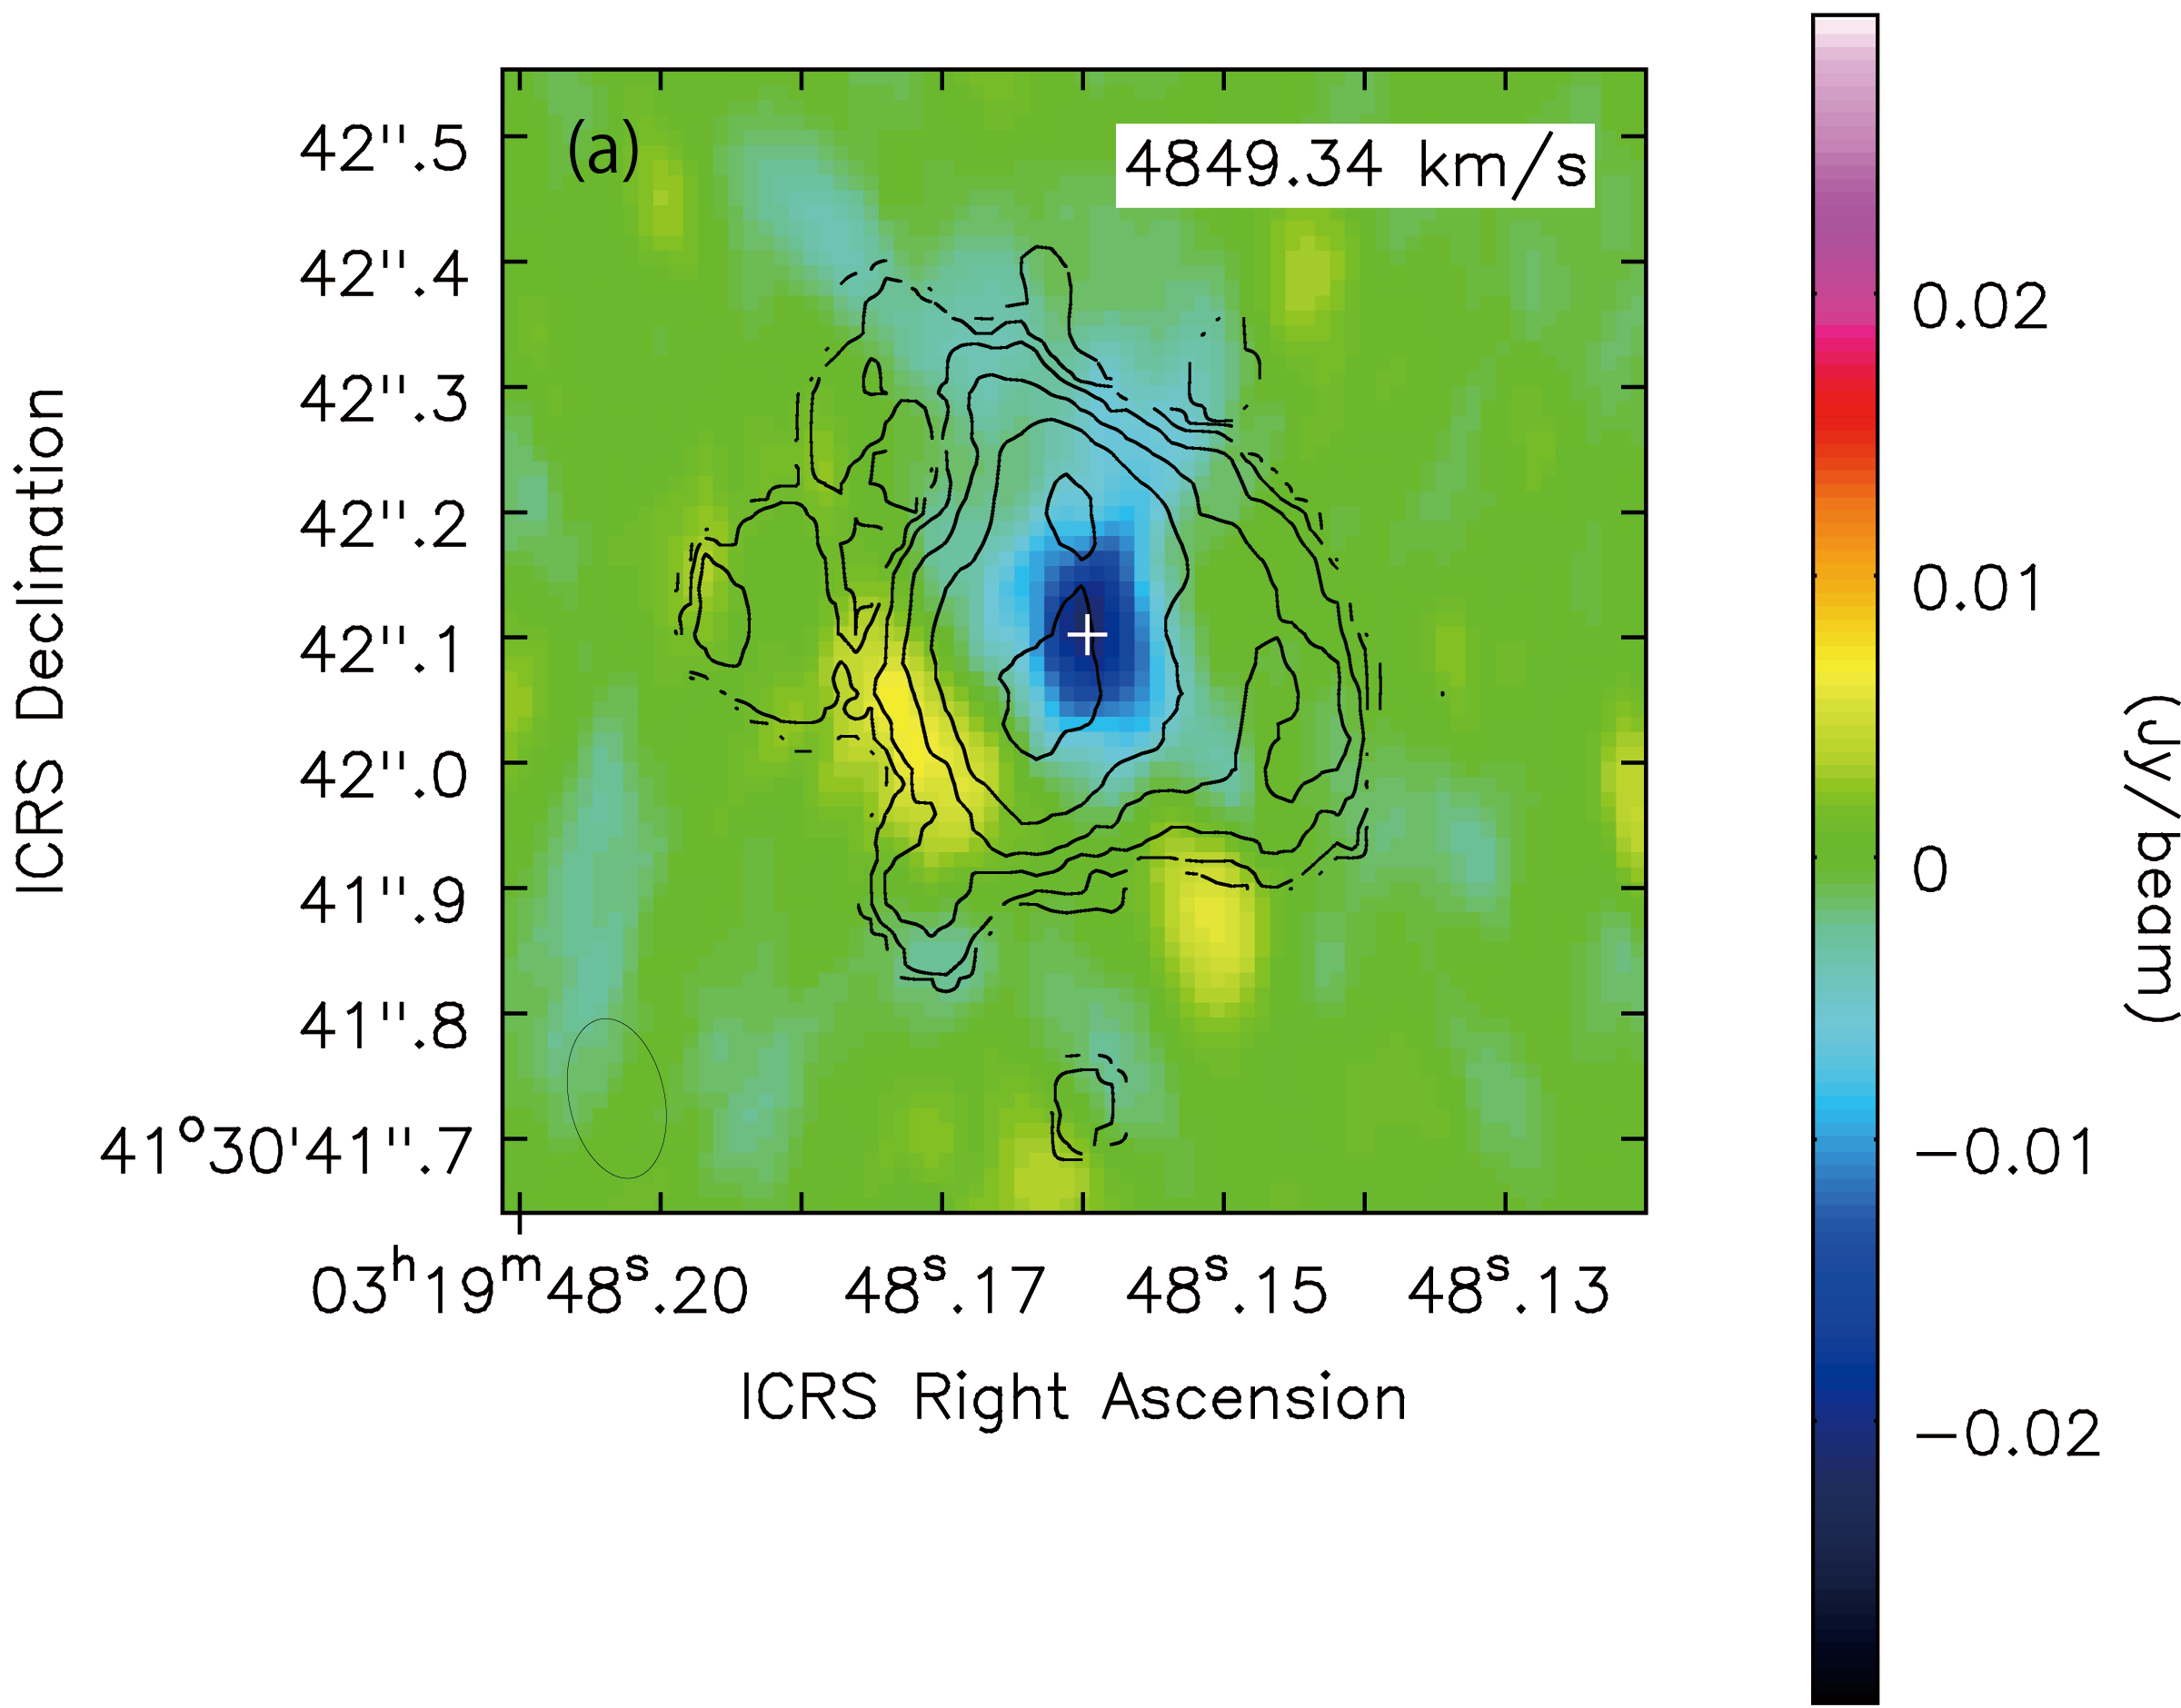
One notable finding is that absorption features are detected at velocities of 4600-4900 km s-1 (Figure 7). The significance is more than and at the deepest absorption channels for HCN(3-2) and HCO+(3-2), respectively. Since there is no corresponding major transitions of molecules at these frequencies, those features are most likely the blue-shifted components of the HCN(3-2) and HCO+(3-2) lines shifted by 300-600 km s-1 with respect to the systemic velocity. Figure 8 shows an example of a channel map where the absorption is detected. This indicates that the absorption is caused on the direction to the central bright continuum associated with the AGN jet. Flux density of the background continuum emission is about 7 Jy beam-1 while the peak flux of the absorption features is about 40 mJy beam-1, yielding the optical depth of 0.0057. Under the assumption of the local thermodynamic equilibrium and a covering factor of 1, we obtain the H2 column density of cm-2. Here we assume a HCN-H2 abundance ratio of (Smith & Wardle, 2014). To check that these features are not an artifact caused by the process of continuum subtraction, we also show the spectrum measured on the continuum unsubtracted images in Figure 9. Troughs in the spectrum are clearly seen between 261.6 GHz and 261.9 GHz for the HCN(3-2) and between 263.2 GHz and 263.7 GHz for the HCO+(3-2).
To confirm the detection of absorption features, we also reduced archival data which observed NGC 1275 as the phase calibrator (Project ID: 2013.1.01102.S). This data covered the frequency of the HCN(3-2) and HCO+(3-2) lines. Figure 10(b) shows the spectrum of the those lines. Absorptions in the spectrum could be marginally detected at the velocity of -4900 km s-1 with the significance of at most for HCN(3-2) and for HCO+(3-2) at the deepest absorption channels. Low significance might be due to a relatively large beam size for the archival data. However, we note that the marginal detection does not conflict with the detection with our data because of a possible time variation of the properties of absorbers. We will discuss this in detail in section 4.3.
4. DISCUSSION
4.1. Filaments
Our ALMA observations detected two distinct filamentary structures – the one is seen at km s-1 at a position angle of deg (A, B, and C in Figure 4), and another is seen at -5251 km s-1 in a position angle of deg (D and E in Figure 4). Each component has a total H2 gas mass of (The assumptions used for this estimate is discussed in §4.2.). Note that the estimated mass should be a lower limit since the total emissions cannot be recovered because of the lack of short interferometric baselines. Lower velocity components mainly constitute the western filament while the higher velocity ones constitute the inner filament. Previous authors argued that the large-scale gas filaments can be infalling and settling into the CND (e.g. Scharwächter et al., 2013). However, these features may not be a representation of a single infalling stream since they are not simply connected to each other in terms of both morphology and kinematics. We have not so far detected a direct evidence of the connection between the filaments and the CND.
Yet, the complex filaments in NGC 1275 can be a natural consequence of CCA enhanced by thermal instabilities. It is suggested by numerical simulations of elliptical galaxies that the growth of thermal instabilities in the hot halo/cluster gas leads to the condensation of cold clouds and filaments (Gaspari et al., 2013, 2017). As a result, the accretion flow from cluster scales to the central black hole is dominated by CCA, i.e., the cold clouds show complex structures and non-ballistic orbits (Pizzolato & Soker, 2010; Gaspari et al., 2013, 2017). The observed complex morphology of the CO filaments seems to be consistent with the simulations. As we noted in section 1, deflection of jets and strong variation in the AGN luminosity of NGC 1275 is observed. This is also consistent with the predictions of the CCA. Our observations may not be sufficient to reconstruct the entire gas structures because of the lack of short interferometric baselines. Observations with a compact antenna configuration would aid to image more diffuse and extended structures.
How much of the cold gas is accreted by the SMBH? We can make a crude estimate if the cold accretion is the dominant feeding mechanism for the NGC 1275 system. Assuming each component is infalling to the center, we can roughly estimate the mass accretion rate as
| (1) | |||||
Here is the cold gas mass, is the infalling velocity, and is the distance to each clump from the AGN. For the first-order approximation, we assume that 3-dimensional velocity of each component is similar to the observed line-of-sight velocity. As an example, the most pronounced component (component A in Figure 4(b) has a velocity of km s-1 relative to the systemic velocity. Each of components A-E in Figure 4 has a H2 gas mass of (see section 4.2 about the details of conversion from the observed flux density to gas mass). Taking into account that the estimated gas mass is a lower limit because of missing flux, we obtain yr-1. Similar estimates were done by Lim et al. (2008), and they obtained a mass accretion rate of several tens of solar masses per year. Thus, our estimate does not conflict with the estimate by Lim et al. (2008). Fujita et al. (2016) estimated the Bondi power of NGC 1275 using Chandra X-ray observations of the hot gas and the argument of momentum balance between the jet/cocoon and ambient medium. The resultant Bondi accretion rate was yr-1 considering current jet activities (see Fujita et al. (2016) for more details). This suggests that the cold accretion can be more efficient than the hot accretion on kpc scale of NGC 1275.
4.2. Inner Gas Disk
Rotating disk-like morphology and kinematics are detected in the CO(2-1), HCN(3-2), and HCO+(3-2) lines. The gas disk spatially coincides with that of the warm H2 gas disk (Scharwächter et al., 2013), and the velocity structure is also very similar between the two data sets. Although only our data alone cannot give a robust constraint on the gas temperature, the temperature of the CND traced by the cold molecular lines (CO(2-1), HCN(3-2), and HCO+(3-2)) is probably smaller than 100 K (e.g. Myers, 1978). On the other hand, the H2 emission can trace the gas with the temperature of greater than 1000 K (Wilman et al., 2005; Scharwächter et al., 2013). Therefore, it is natural to expect that the cold and warm gas phases are distributed at the same radii but are stratified. This multiphase gas structure can be realized if the gas disk consists of many small gas clumps where the temperature of outer surface of clumps is raised by shocks or UV and X-ray irradiation so that the H2 molecules can be collisionally excited while the temperature of the inner part remains at low temperature and is where the cold molecular lines are emitted. Such a multiphase-gas system is also predicted by the CCA simulations (Gaspari et al., 2017).
We calculate the total H2 gas mass using equations (3) and (4) in Solomon & Vanden Bout (2005) and obtain . Here we get the CO(2-1) integrated flux density of 40 Jykm s-1 within the central with a velocity FWHM of 400 km s-1. We assumed the CO(2-1)-to-CO(1-0) ratio of one and the CO luminosity-to-H2 mass conversion factor in our Galaxy ( pc-2(K km s-1)-1) (Solomon & Vanden Bout, 2005). The derived gas mass is about 20% of the total gas mass of the inner filament presented in Lim et al. (2008). If we use 0.6-0.8, which is widely used as the conversion factor for gas-rich galaxies at high redshift and local U/LIRGs (Downes & Solomon, 1998; Papadopoulos et al., 2012), we obtain the total gas mass of 5-7. Izumi et al. (2016) reported a correlation between the mass of cold molecular gas () in the CND and black hole accretion rate for Seyfert galaxies. Using the derived correlation relation and , we obtain of yr-1, which shows an agreement with the accretion rate ( yr-1) inferred from the bolometric luminosity (Nagai et al., 2017) within a factor of two.
The CCA simulations predict that the condensation evolution in a quiescent rotating hot halo leads to the formation of a multiphase disk (Gaspari et al., 2017). In the equatorial plane (- plane), the infalling gas spins-up increasing the rotational velocity to conserve the initial angular momentum. The gas also gradually goes into free fall along the direction (perpendicular to the equatorial plane). This drives a gas motion following a conical helix, but after a long duration (40 Myr in Gaspari et al. (2017)), the angular momentum in and directions are canceled out by the cloud-cloud collisions and the multiphase gas converges to the equatorial disk. Low gas density along the jet direction is indeed suggested by VLBI observations (Fujita et al., 2016; Fujita & Nagai, 2017). Both cold gas (CO(2-1), HCN(3-2) and HCO+(3-2)) disk and the warm H2 disk extend to a radius of ( pc). We can conclude that the rotational motion dominates the turbulent motion at pc in terms of the CCA. Gaspari et al. (2017) reported that the dense disk blocks the inflow of gas at large distance from the center, leading to the expansion of the disk radius with time. Larger cold gas disks, extending to a few kpc, are found in many other early-type galaxies by the CARMA CO(1-0) imaging survey of early-type galaxies (Alatalo et al., 2013) and radio galaxies by ALMA CO(2-1) (Ruffa et al., 2019). As compared to those early-type galaxies or radio galaxies, the gas disk in NGC 1275 is remarkably small. This might be explained by relatively strong jet activity. NGC 1275 has repeated strong AGN outbursts, and thus could have uplifted the gas and stirred up the turbulence by the jet/cocoon in the polar region (Churazov et al., 2001; Enßlin & Vogt, 2006). This can suppress gas infall from the hot atmosphere. The extended emission line nebula around NGC 1275 (Hatch et al., 2006; Fabian et al., 2008; Gendron-Marsolais et al., 2018) could be a signature of such uplifted gas by the radio jets/bubbles. All galaxies in Alatalo et al. (2013) shows much lower radio continuum flux than NGC 1275, so the jet feedback can be less efficient for those galaxies. This scenario also supports the lack of kpc-scale gas disks in PKS 0745-191 (Russell et al., 2016), Phoenix cluster (Russell et al., 2017), and A2597 (Tremblay et al., 2016) for which all these sources show strong jet activities. Contrary, radio galaxies Hydra A and 3C 31 have a kpc-scale molecular gas/dust disks (Okuda et al., 2005; Fujita et al., 2013; Hamer et al., 2014). In particular, Hydra A shares many properties, including the strong jet activity, with NGC 1275 (Hamer et al., 2014). The existence of a cold gas disk on kpc scales of Hydra A may suggest that the cluster gas is less turbulent for some reasons so the CCA cannot develop. Low turbulence is also indicated by low velocity dispersion of the CO(2-1) gas revealed by the ALMA observations (Rose et al., 2019). The future X-ray satellite mission XRISM would help to uncover the gas motion of BCGs in more detail.
A velocity gradient of the gas is observed in position angle of . This rotation axis is nearly parallel to the innermost jet axis which was revealed by the space VLBI observation with Radioastron (Giovannini et al., 2018). Hiura et al. (2018) reported the non-linear jet/hotspot motion on parsec-scale and discussed the possibility that the non-linear motion was caused by the precession of the jet base. Nevertheless, the precession angle is only a few degrees. Thus, the disk rotation axis is still approximately consistent with the jet axis. The coincidence of the disk and jet axis alignment probably indicates that the molecular gas disk is connected to the inner accretion disk, which is responsible for the jet launching. Alternatively, this might indicate that the spin axis of the central SMBH is aligned to the molecular gas disk if the Blandford-Znajek mechanism (Blandford & Znajek, 1977) is responsible for the jet production.
Let us estimate the accretion timescale of the molecular gas in the observed disk. If we assume that the cold gas disk is thin and the kinetic viscosity is the main source of angular momentum transfer, the accretion timescale () can be given by (e.g. Shakura & Sunyaev, 1973; Pringle, 1981), where is the disk radius, is the viscosity parameter, is the sound speed, is the turbulent velocity, and is the scale height. Assuming a thin disk (), we get
| (2) |
Here we adopt the observed typical velocity dispersion (see Figure 11) for the turbulent velocity (). We should notice that the velocity dispersion at the inner part of CND in Figure 11 does not reflect true turbulent velocity. An apparent large velocity dispersion ( km s-1) is probably an artifact which is caused by convolving the synthesized beam to a large velocity gradient (see in Figure 2). We therefore adopt typical velocity dispersion in the outer region ( km s-1). We can roughly estimate the averaged accretion rate () of the gas disk within a radius of 100 pc as . For - and (see §4.2), we get - yr-1 and yr-1, respectively. This accretion rate of cold gas is again higher than Bondi accretion rate of (Fujita et al., 2016). This manifests that the cold accretion is a dominant channel on tens-pc scale.
Comparison between accretion timescale and cooling timescale of hot ICM would give a hint for the timescale of AGN activity. Sanders et al. (2004) showed the cooling time of hot gas in NGC 1275 at the radius down to 5 kpc. Within 10 kpc, cooling time is estimated to be yr and does not change very much as a function of distance. The density profile of BCGs is well represented by a -model with a flat density profile within the core radius. The flat density profile is favored even in the inner region ( pc) of NGC 1275 (Fujita et al., 2016). Since the cooling time is inversely proportional to the density, it should be reasonable to assume that the cooling timescale does not change much within the core radius. We here use the cooling time of yr on 100-pc scale. This is longer than the accretion timescale. If the angular momentum of the black hole accretion disk is controlled by the cold gas of the CND, the jet-launching direction can be also controlled by the global angular momentum of the CND. We therefore expect that the jet direction would be kept more or less in the same direction on the accretion timescale ( yr). However, the subsequent mass accretion from larger spatial scales may change the global angular momentum in the case of CCA, and thus the jet launching direction can change from the current direction on longer timescales. This idea is supported by the observed radio morphology: While the radio axis within 1 arcsec ( kpc) is similar to the current jet axis (Taylor & Vermeulen, 1996; Silver et al., 1998; Walker et al., 2000; Asada et al., 2006), the radio lobes/bubbles on kpc scales are misaligned from the inner radio axis (Pedlar et al., 1990). The change in the jet direction, as well as spreading energy over large volumes by buoyant bubbles (Zhang et al., 2018), helps to heat up the galactic halo or cluster atmosphere efficiently and globally (Cielo et al., 2018), which can mitigate the issue that radio-mode feedback tends to be efficient only in the jet direction.
Even though our observations have not reached to the spatial scale of the putative torus for the AGN unification scheme (1-10 pc), the observed molecular gas (in particular HCN(3-2) and HCO+(3-2)) shows a central concentration. It seems to be reasonable to assume that the molecular gas disk is reaching to the pc scale. As we discussed in section 3.2, we detected the absorption lines of HCN(3-2) and HCO+(3-2) only in blue-shifted velocity ranges. The absence of a redshifted absorption feature suggests that the molecular gas disk at pc scale, where the gas is likely infalling to the AGN, should not intercept our line of sight toward the AGN. In order to realize this, the molecular gas disk must be thin ( where is the disk height and is the disk radis) since we are viewing the AGN from a relatively large angle (: Fujita & Nagai (2017)). From the AGN unification viewpoint, NGC 1275 was originally classified as a Narrow Line Radio Galaxy or Seyfert 2, which required obscuration of the central engine by the putative torus. However, the broad H wing was later identified and NGC 1275 was classified as a Seyfert 1.5/LINER (Véron-Cetty & Véron, 2006; Sosa-Brito et al., 2001). The broad H emission with the velocity FWHM of 4150-6000 km s-1 as well as the Pa and C IV has been also recently detected (Punsly et al., 2018). Those detections of broad emissions lines are consistent with the presence of a thin disk as suggested from our observations. The thin disk was also reported in another low-luminosity AGN, NGC 1097 (Izumi et al., 2017). Izumi et al. (2017) suggested that a thinner disk in NGC 1097 than in NGC 1068 (Imanishi et al., 2018) arose as the result of its low luminosity ( erg s-1; Nemmen et al. (2006)), which is supported by theoretical predictions (e.g. Elitzur & Shlosman, 2006). It is not clear if the relatively high luminosity of NGC 1275 ( erg s-1; Levinson et al. (1995)) can be explained by the same mechanism. We need more samples to improve our understanding of the thickness of the disk/torus.
Hitomi Collaboration et al. (2018) has recently reported the detection of Fe-K line emission associated with the AGN of NGC 1275. The observed velocity width of Fe-K is -1600 km s-1. This velocity width suggests that the fluorescing matter is located at a distance of 1.4-14 pc from the black hole, if we attribute it to the Keplerian rotation velocity of a black hole mass . The absence of time variability of the emission over 10 years by Hitomi, XMM-Newton, and Chandra also supports the inferred distance of the fluorescing matter. The small equivalent width of the Fe-K line suggests that the fluorescing matter of NGC 1275 is gas with a relatively low-column density and/or low-covering fraction as compared to other Seyfert galaxies. Hitomi Collaboration et al. concluded that the source of the Fe-K line is a low-covering-fraction molecular torus or a rotating molecular disk which probably extends from a parsec to hundreds of parsecs scale. An intriguing comparison is that the velocity width of the HCN(3-2) and HCO+(3-2) does not exceed km s-1 while the velocity width of Fe-K is -1600 km s-1. A part of the fluorescing matter can be our observed gas disk, but the higher velocity side of the Fe-K emission can originate in other sources, perhaps the inner part of the disk, e.g, the F II emitters (Scharwächter et al., 2013) or free-free absorber (Walker et al., 2000; Fujita & Nagai, 2017).
4.3. Origin of Absorption Feature
The absorption feature is detected at 4600-4900 km s-1 in both HCN(3-2) and HCO+(3-2). The absorbers must be located somewhere between the observer and the AGN of NGC 1275. The absorption against the continuum flux is at most mJy beam-1 (or % attenuation), which corresponds to an optical depth of 0.0057. The total H2 column density of the absorbers is calculated to about cm-2 using the equation (2) given by Sanhueza et al. (2012). Here we assume the excitation temperature of 100 K and the HCN-to-H2 conversion factor of . We adopt this conversion factor based on the results from the abundance ratio estimates in the galactic circumnuclear disk ((0.2-4.1); Smith & Wardle, 2014) and dense molecular outflow in Mrk 231 (; Aalto et al., 2015).
What is the origin of the absorbers? The background continuum emission is mostly coming from the jet of -pc length (Nagai et al., 2010, 2014) while the extended radio emission arises from larger scale from 10 pc to 10 kpc (Romney et al., 1995; Silver et al., 1998; Pedlar et al., 1990; Asada et al., 2006), which are probably associated with the past episodes of jet activities, are negligibly small at this frequency (e.g., Silver et al., 1998). Thus, the absorbers are likely located between the observers and the innermost jet with projected size of about 1.2 pc. The beam filling factor of the jet is about . Thus, it is very unlikely that a gas clump at a large distance from the AGN causes the absorptions. It is natural to expect that the absorptions are associated with the clouds close to the nucleus. Since the absorbers are blue-shifted from the systemic velocity by - km s-1, they must be moving toward us.
One promising candidate is outflowing materials associated with the approaching side of the radio jet. The approaching jet is moving toward the south, and the total extension is about 1.2 pc (Nagai et al., 2017). Nagai et al. (2017) and Kino et al. (2018) found the abrupt change in the position of hotspot of the southern jet in 2015-2016 with an enhancement of polarized emission. This hotspot motion, as well as the enhancement of the polarization, can be caused by the interaction between the jet and a dense ambient medium, probably a dense gas clump with the size of pc. The dense cloud can be expelled from the AGN by this interaction (e.g. Wagner et al., 2012). We speculate that the outflowing absorbers are candidates for the dense cloud. Such a jet-ISM interaction was also identified in the compact radio jet of 4C 12.50 as HI absorption by VLBI observations (Morganti et al., 2013). Assuming a spherical clump with the radius of 0.1 pc, we obtain the total gas mass of the cloud and the H2 gas density cm-3. This gas density is in agreement with that estimated by the Faraday rotation observations under the equipartition condition within a factor of 4 (Nagai et al., 2017) and the one estimated by the hotspot dynamics within its uncertainty (Kino et al., 2018). This gas mass can be a lower limit if the clump has been elongated by the jet interaction, as seen in the 4C 12.50 case. Alternatively, the absorber could be the molecular outflow expelled from the innermost region of the CND by the radiation pressure from the AGN. The observed velocity (- km s-1) is in fact consistent with that predicted by numerical simulations (Wada, 2015). Further observations with other lines may help to better understand the origin of absorber. In particular, the shock tracer (e.g., SiO) would be detected if the absorber is associated with the jet-ISM interaction.
Previous VLBI observations (Nagai et al., 2017; Kino et al., 2018) suggest that the interaction between the jet and the cloud started in late 2015. The archival data shown in section 3.2 was taken in 2015 June when the jet interaction had not started or just started. Therefore, it can be a natural consequence that the absorption lines are less obvious in the archival data.
One may ask why the absorption feature is not detected for the CO(2-1) line. Although the detailed physical mechanism is not clear, several studies have argued that the harsh environment in the close vicinity of the AGN and the influence by the radio jet can increase the HCN or HCO+ transitions. Meijerink et al. (2011) modeled the intensity ratio of molecular species under the condition of strong cosmic-ray and mechanical heating. For the condition of strong mechanical heating, the HCN/CO intensity ratio increases, and this trend can be boosted, depending on the cosmic-ray heating rate. Harada et al. (2013) also reported that the intensity ratio of HCN/CO can be larger than unity in the region where the X-ray irradiation is strong. This might explain the absence of CO(2-1) absorption lines since the dense cloud could be mechanically heated by the jet interaction and also be strongly irradiated by cosmic-rays and X-rays from the AGN. The enhancement of HCN and HCO+ was also reported in the outflow of Mrk 231(Aalto et al., 2015) and NGC 253 (Walter et al., 2017). One intriguing comparison is that Michiyama et al. (2018) reported the detection of the HCN(1-0) and HCO+(1-0) emission in the outflow from the southern nucleus of the merging galaxy NGC 3256 where a low-luminosity AGN is located. On the other hand, the HCN(1-0) and HCO+(1-0) are undetected in the outflow from the northern nucleus where there is no AGN signature. They claimed that the enhancement of the HCN(1-0) and HCO+(1-0) emissions is caused by the formation of dense clumps associated with the jet-ISM interaction, possibly via shocks.
The main disk emission shows a double-peak structure in the HCO+(3-2) spectrum for both our data and archive data (see Figure 7 and Figure 10). This spectral shape was not observed in the previous single dish observations (Bayet et al., 2011). The deficit between the two peaks in the HCO+ spectrum is possibly caused by the absorption, which is evident in the spectrum only at the image center where the AGN is located (see Figure 7(b)). Another absorption-like feature may be seen in the redshift-side at km s-1. However, these two features are not seen in the HCN(3-2) spectrum. We therefore need a confirmation by new observations.
5. Black Hole Mass
SMBH mass is a fundamental parameter to determine the AGN physics in connection with the galaxy evolution. It also determines the Schwarzschild radius, which characterizes various physical quantities, such as Bondi radius and SoI (SoI where is the gravitational constant, is the black hole mass, and is the central stellar velocity dispersion.). Although there is a well-known empirical correlation between the SMBH mass and stellar velocity dispersion ( relation, e.g., Bettoni et al. (2003); Kormendy & Ho (2013); van den Bosch (2016)), dynamical measurement of the SMBH mass within the SoI, where the gravitational potential is thought to be dominant, is important to derive a robust SMBH mass. Using the stellar dispersion velocity of km s-1 and of (Bettoni et al., 2003), we obtain SoI of 60 pc. Therefore, molecular gas dynamics revealed by our ALMA observations should be useful to give a robust constraint on the SMBH mass of NGC 1275. Previously, the SMBH mass measurements using the warm H2 gas dynamics were made by Wilman et al. (2005) () and Scharwächter et al. (2013) (). Although those measurements probed the gas dynamics with a similar spatial resolution with our data, the cold gas (CO(2-1), HCN(3-2), and HCO+(3-2)) and warm H2 gas can be stratified as we discussed in section 4.2. Therefore, an independent SMBH mass measurement is still intriguing.
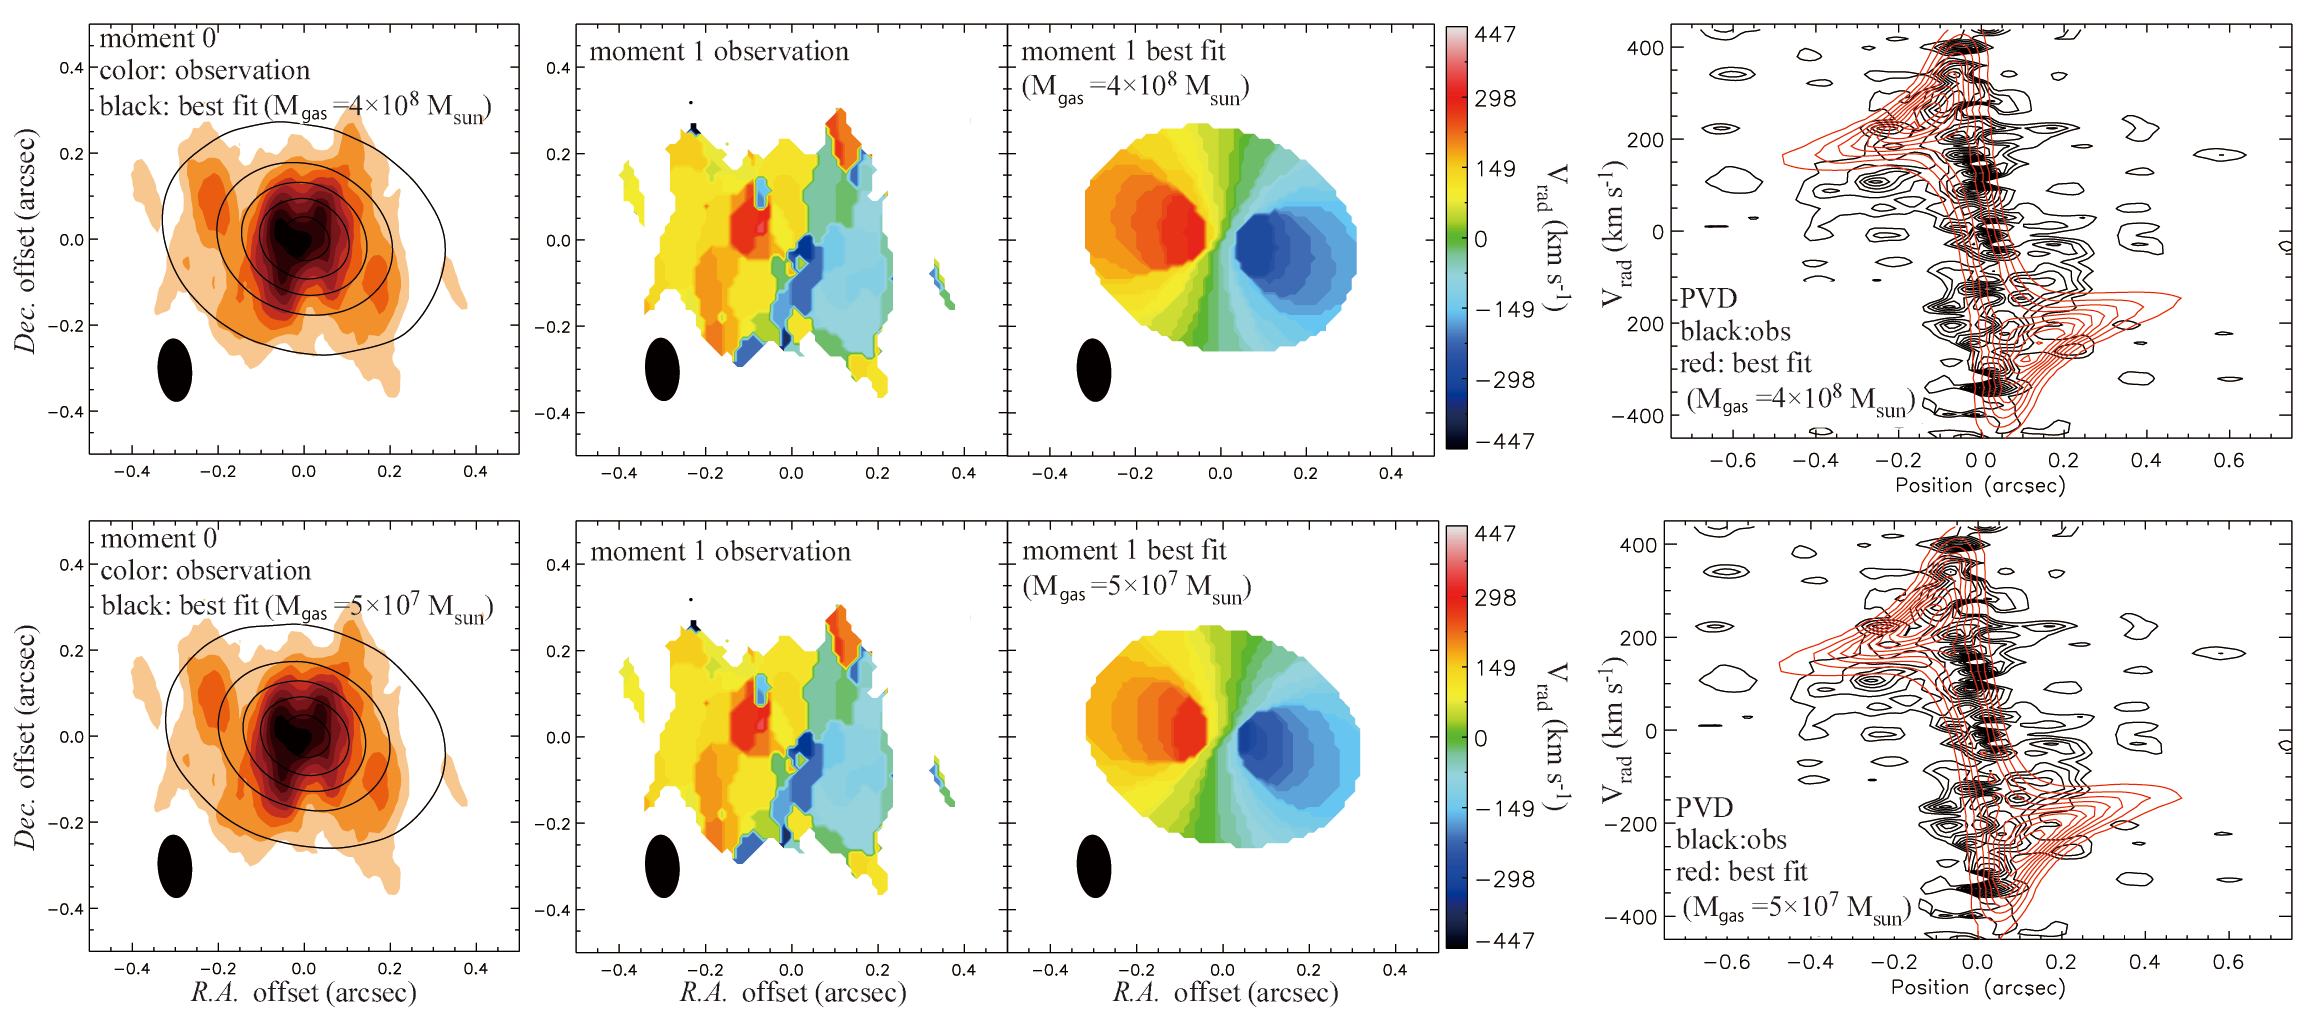
We here model the rotating molecular gas disk traced by the CO(2-1) and directly measure the SMBH mass by following a standard procedure as described in Onishi et al. (2017); Davis et al. (2017, 2018). We use an image cube with natural weighting (see Section 2), that yields a beam size of . The fitting area is defined here as the central region and from to km s-1, thus pixels. We model the galaxy mass profile (stars and the SMBH) by using the Multi Gaussian Expansion method (MGE; Emsellem et al., 1994; Cappellari, 2002), and include gas mass self gravity by using the publicly available KINematic Molecular Simulation (KinMS; Davis et al., 2013) tool222https://github.com/TimothyADavis/KinMS.
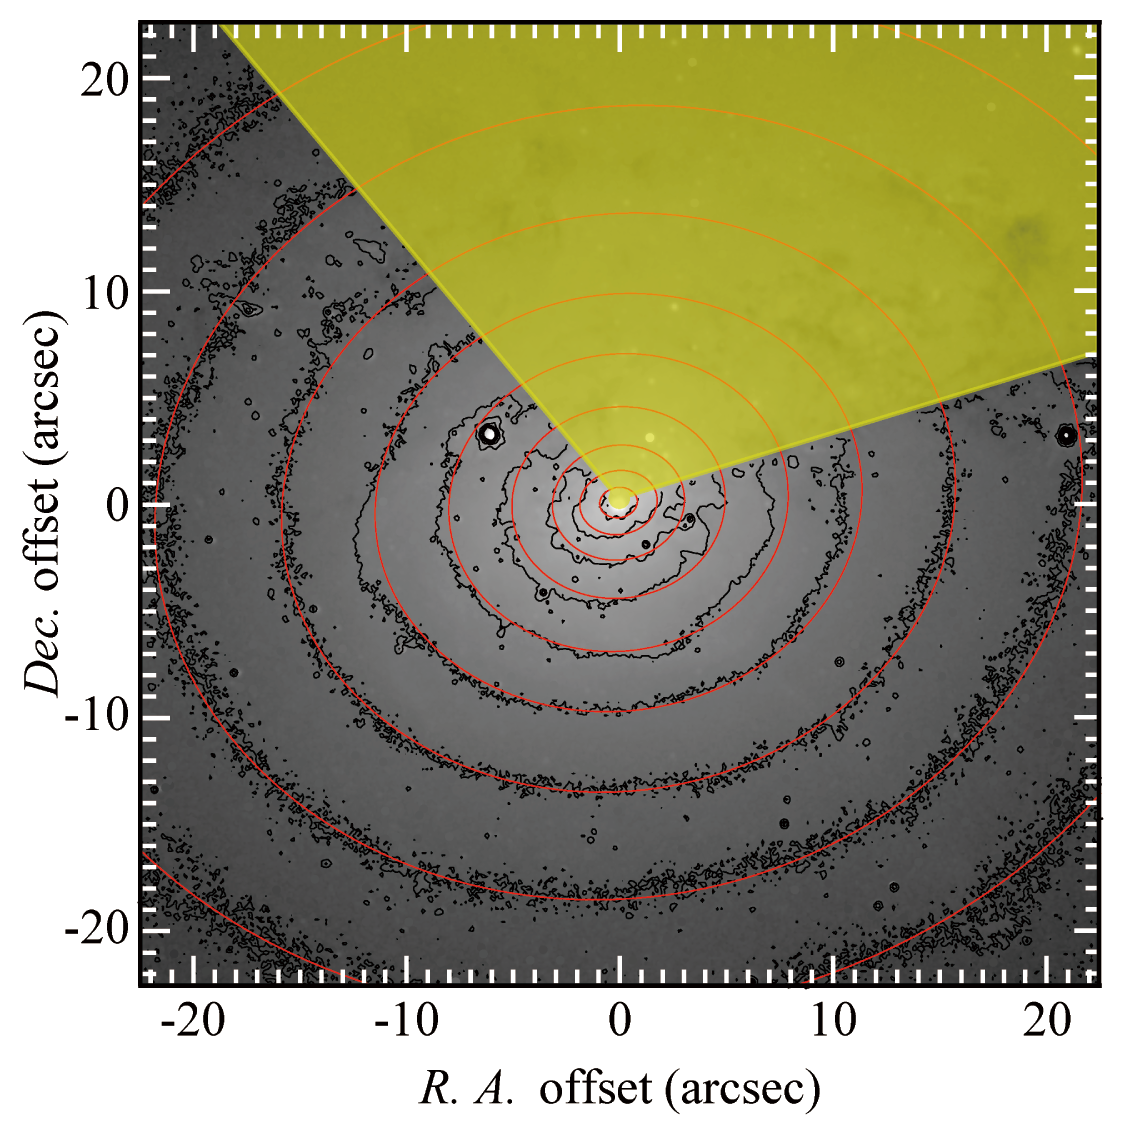
We use HST -band archival image taken with the F814W filter on Wide Field Planetary Camera 2 to model the stellar mass component. The HST PSF for this observation was estimated by using TinyTim Version 6.3 (Krist et al., 2011). Before modeling the -band luminosity distribution with multiple Gaussians, we mask a region within radius from the AGN position, comparable to the size of the PSF (FWHM of ), to avoid any light from the AGN. The dust-attenuated region in the north west is also masked (see Figure 12). We then take the unmasked region of the image () and fit the luminosity distribution by using the PSF and the procedure mge_fit_sectors_regularized, contained in the MGE_fit_sectors IDL package333http://purl.org/cappellari/software of Cappellari (2002). Figure 12 shows the HST -band image (greyscale) with the mask (colored in yellow) and the MGE model (red contours) overlaid. A spatially uniform stellar mass-to-light ratio () is then multiplied by the model luminosity profile to create a stellar mass model. The SMBH mass (delta function) is then added at the center. NGC 1275 is known to have a substantial amount of gas at the center, that possibly affects the kinematics (Scharwächter et al., 2013). The molecular gas mass of , estimated in Section 4.2, is thus included in the mass model. We also consider a different estimation of the molecular gas mass (, also described in Section 4.2) in a different fitting run in order to see the effect.
By using the mass model described above with parameters of and the SMBH mass, a circular velocity curve is calculated from the MGE_circular_velocity procedure contained in the JAM package of Cappellari (2008), assuming an axisymmetric potential and circular motion. By utilizing the KinMS, we take observational effects such as beam smearing and velocity resolution into account, and generate dynamical models of the molecular gas disk. The molecular gas disk is assumed to be in a form of an exponential disk (/); where corresponds to radius and is the scale length). We consider inclination angle, kinematic position angle, , gas velocity dispersion (assumed to be uniform over the disk), central position (R.A., Dec, and velocity) and the disk luminosity scaling as parameters to describe the disk. For clarification, gas velocity dispersion given here represents the intrinsic velocity dispersion of gas, such as that occurred by turbulence. These parameters determine each dynamical model of the molecular gas disk, that is created in the form of a simulated data cube. The simulated cube is then compared to the observed data to evaluate the difference.
We first searched for a set of parameters to minimize the difference between the observed data and the model by using mpfit that is developed in IDL. The results from two different runs with and are summarized in Table 4.
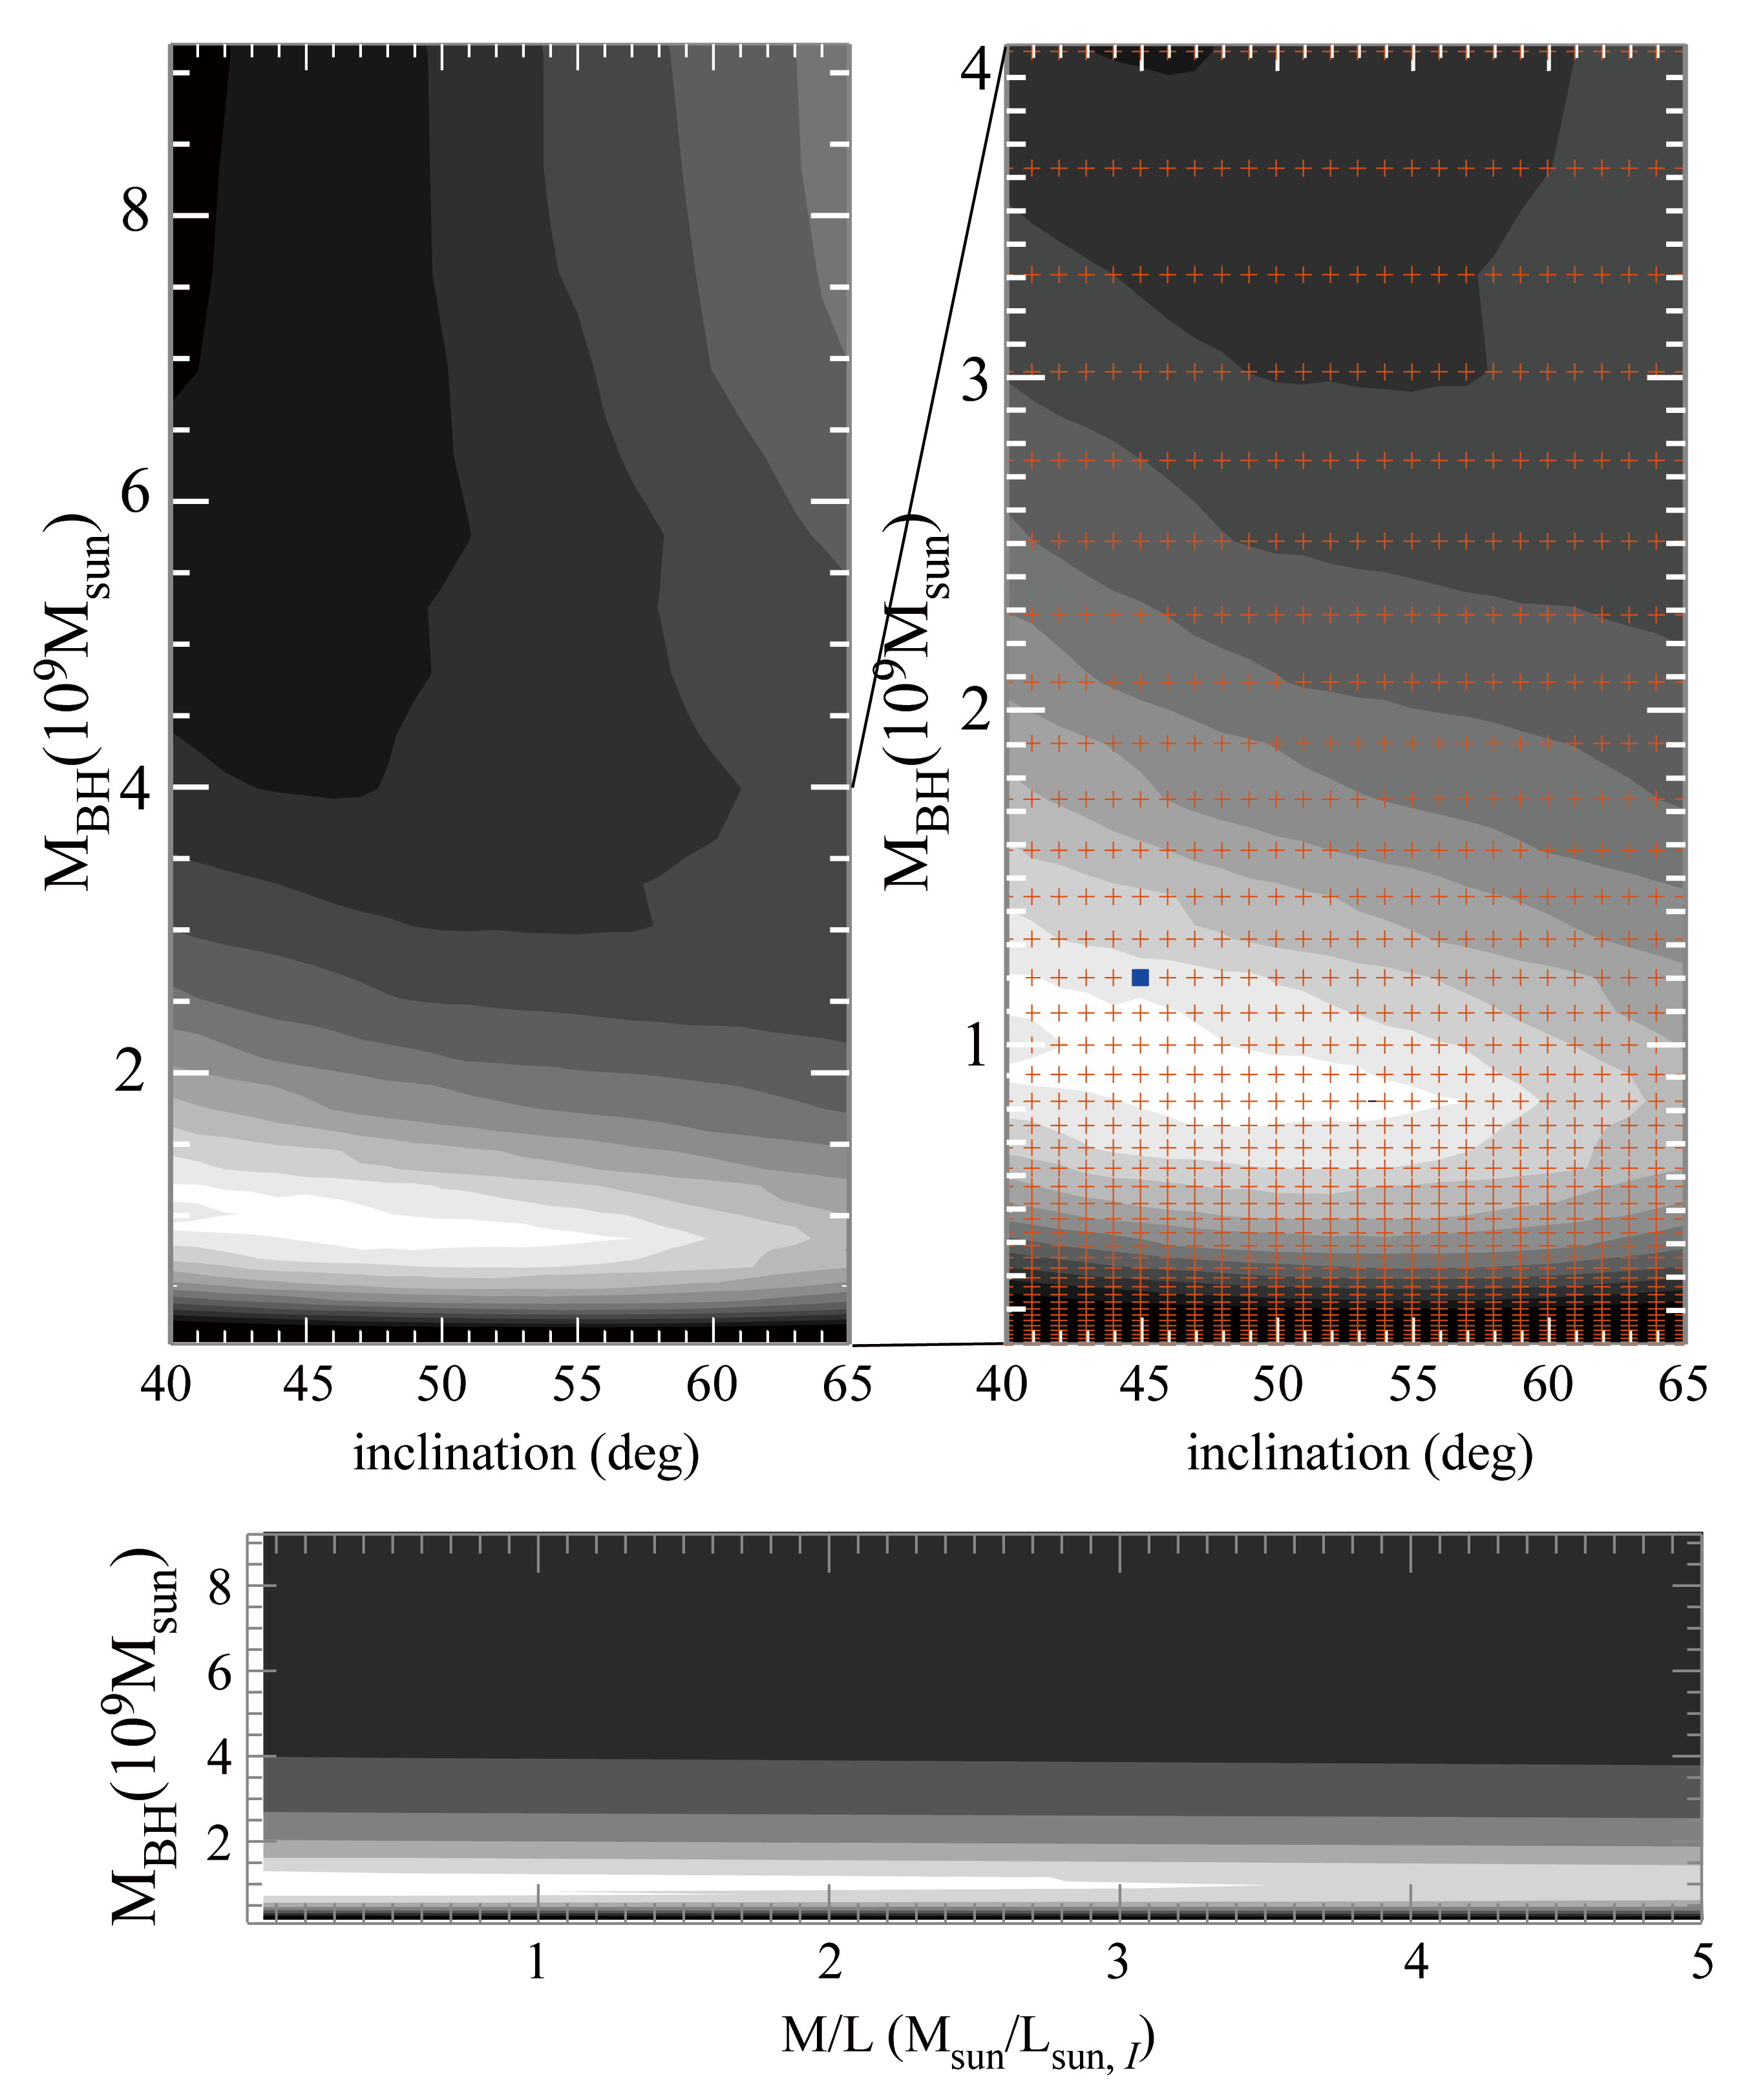
We then evaluate error budgets for parameters those have crucial effect on the SMBH mass. We here select gas disk inclination and the SMBH mass to search the parameters in grids, while other parameters are fixed to the mpfit results. does not affect the SMBH mass for the case of NGC 1275, suggesting that the stellar mass within the fitting area is ignorable (Scharwächter et al., 2013). We confirm this by giving three different values, , and to see negligible difference (see the lowest panels in Figures 14 and 15). Figure 14 (the case of ) and Figure 15 (the case of ) show residual contours for the SMBH mass and inclination. The residual is calculated in the same manner as the , thus . This residual is useful to judge the fitting results but is not equivalent to the , as the neighboring pixels in the observed cube are correlated.
The best fit values given by the mpfit are , inclination of deg444Inclination angle of and correspond to the face-on disk and edge-on disk, respectively., and the when molecular gas mass is , and , inclination of deg, and the when molecular gas mass is . Comparisons with what we observed in a form of moment 0 and moment 1 and position-velocity diagram is shown in Figure 13. Our assumption of exponential disk may not perfectly describe the molecular gas distribution of NGC 1275, but we consider the model distribution has only ignorable effect on the resulting SMBH mass.
The error budget is defined for the SMBH mass and inclination using the residual contours as given in Figures 14 and 15. The large number of pixels (; number of degree of freedom excluding negligible number of free parameters), however, gives non-negligible standard deviation to the , as noted in van den Bosch & van de Ven (2009) and Mitzkus et al. (2017). In order to avoid unrealistically small errors resulting from this , we follow the approach of van den Bosch & van de Ven (2009) to conservatively increase the level by multiplying all observed rms noise by , that is exactly equivalent to decreasing the by , and thus redefining the confidence level of . Again, the rescaled residual values are not equivalent to the , but we judge the error by allowing all parameters that realize residuals less than where is the minimum rescaled residual value during the grid search ( when , when ). We obtained the best-fit SMBH mass of and inclination of deg when molecular gas mass is , and and inclination of deg when molecular gas mass is . We here note that the inclination angle hits the lower limit of the search range, which is given from the stellar mass MGE model. The inclination will at least not reduce the SMBH mass down to zero, simply judging from the residual contours (Figures 14 and 15).
Since the estimated gas mass could be a lower limit because of the lack of short baselines, let us check how the missing mass affects the BH mass estimate. We assume that the whole structure of disk consists of our detected component with a radius of and a more extended component which is completely filter out in our observations. We assume that the total gas mass of the inner filament of (Lim et al., 2008) uniformly distributes over the beam area of the observations by Lim et al. (). The missing mass within a radius of can be estimated as . This is very well within the SMBH mass error, and thus we conclude the missing mass will not give a big change to our result.
While the derived SMBH mass shows a good agreement with that derived from the warm H2 gas dynamics (Scharwächter et al., 2013), there is a huge discrepancy with the SMBH mass using the virial estimate of broad emission lines (, Onori et al. (2017); Koss et al. (2017)). More recently, Punsly et al. (2018) also pointed out that the virial mass estimate can be 10-100 times smaller than the required SMBH mass in order to explain the bolometric luminosity. If we take and emission line velocity () of km s-1, the emission region radius () is estimated to be pc using the virial relation . Netzer & Laor (1993) suggested that the outer edge of the broad line region (BLR) conincided with the dust sublimation radius of the torus/CND, and reverberation mapping observations also show that the BLR extends out to the dusty torus (Suganuma et al., 2006). Using equation (1) in Kishimoto et al. (2007) and UV luminosity estimated of erg s-1 by Kino et al. (2017), the dust sublimation radius can be estimated as
| (3) | |||||
Here is the UV luminosity, is the sublimation temperature, and is the grain radius. This estimate suggests that there is a discrepancy between and by a factor of 4. On the other hand, if we take , we then get =0.2 pc, which is more than one order of magnitude larger than . Punsly et al. (2018) defined the deprojection factor of the orbital radius of the BLR by taking into account the BL Lac nature of NGC 1275. Assuming a small jet viewing angle, they derived from the virial mass estimate using the broad emission lines. However, the small viewing angle assumption is not consistent with the viewing angle estimate using jet/counter-jet length ratio (Fujita & Nagai, 2017) unless the jet angle drastically changes from the jet base to parsec scale. In conclusion, it is difficult to relate the SMBH mass estimate using broad emission lines with the observed nature of NGC 1275. Since NGC 1275 exhibits repeated AGN outbursts, the ionizing photon flux from the accretion disk is probably highly time variable. This could make the BLR complex, resulting in the discrepancies described above.
We here note that our model still stands on some assumptions that can be explored more carefully. For example, the inclination angle and can have a radial dependence (such as would be the case for a warped disk), and the gas distribution can be better described with multiple Gaussians rather than the exponential disk. Also, additional uncertainties can arise from the imperfectly known distance to the object. We can calculate the proper by comparing the data and the model in the (u, v) plane. We however do not probe this in detail and leave these points for our future work.

| mol. gas | mol. gas | ||||
|---|---|---|---|---|---|
| parameter | Search range | MPFIT best | grid search error | MPFIT best | grid search error |
| SMBH () | – | , | |||
| () | – | – | – | ||
| incl. (deg) | – | , | , | ||
| PA (deg) | – | – | – | ||
| (arcsec) | – | – | – | ||
| gas (km s-1) | – | – | – | ||
| central offset x (arcsec) | – | – | – | ||
| y | – | – | – | ||
| v (km s-1) | – | – | – | ||
| luminosity scaling | – | – | – | ||
6. Conclusion
We reported the ALMA observations of the CO(2-1), HCN(3-2), and HCO+(3-2) lines on NGC 1275. All three lines are detected within the central 100 pc significantly. Only the CO(2-1) emission is also marginally detected on the sub-kpc scale, though it is heavily resolved. The sub-kpc CO(2-1) emission forms filamentary structures, but those cannot be represented by a single infalling stream both morphologically and kinematically. Observed complex behavior of CO(2-1) is consistent with the chaotic cold accretion predicted by recent numerical simulations. The mass accretion rate inferred from the CO gas can be higher than the Bondi accretion rate, which suggest that the cold accretion can be a dominant mechanism in this system.
The main CO(2-1), HCN(3-2), and HCO+(3-2) emissions appear to show disk morphology. The velocity distribution shows a velocity gradient in a position angle of , which can be interpreted as the disk rotation. The observed disk morphology and kinematics are similar to those of warm H2 gas disk shown by previous Gemini observations. This suggests that the cold and warm gas phases are distributed at the same radii but are stratified. Intriguingly, the disk rotation axis is approximately the same with the jet axis on the subpc scale. This may indicate that the cold gas disk is physically connected to the further inner accretion disk, which is responsible for jet launching, and thus the cold accretion may play an important role to characterize the AGN activity. Higher spatial resolution would be crucial to study the nature of cold accretion in further inner region, as well as the connection with the FFA disk identified by VLBI observations.
Overall, our observations suggest that the cold accretion can play an essential role for the AGN feeding in the representative of nearby BCGs, which are thought to be the most massive galaxies and the hosts of the most massive SMBH in the local Universe. A better angular resolution with more extended ALMA configurations will allow us to resolve the Bondi radius ( pc) of NGC 1275 in future Cycles, which is crucial to better understand the physics of black hole accretion.
We detected the blue-shifted absorption lines in the HCN(3-2) and HCO+ spectra and confirmed it with the archived HCO+(3-2) spectrum. The most probable candidate for the absorber is a dense gas clump interacting with the radio jet, which was recently identified as the abrupt change in the hotspot motion by VLBI observations. Alternatively, the absorber could be the outflowing gas expelled from the innermost CND by radiation pressure. Time variability of the absorption feature would be detected if such an interaction is underway. This will be verified with future monitoring observations.
Using the observed velocity structure and archival HST data, we measured the dynamical mass of the SMBH. The measured SMBH is , which agrees with the dynamical measurement using the warm H2 gas but disagrees with the virial mass estimate using broad emission lines. The discrepancies can be arisen by the complexity of BLR structure, which is possibly related to the violent time variation of AGN activity in NGC 1275. Similar comparisons with other AGNs would be helpful to figure out the cause. Increasing the sample of SMBH mass estimate by molecular gas dynamics with ALMA (e.g. Barth et al., 2016; Boizelle et al., 2019; Smith et al., 2019) is one of key approaches to shed light on this problem.
We thank the referee for constructive comments. This paper makes use of the following ALMA data: ADS/JAO.ALMA#2017.0.01257.S and ADS/JAO.ALMA#2013.1.01102.S. ALMA is a partnership of ESO (representing its member states), NSF (USA) and NINS (Japan), together with NRC (Canada), MOST and ASIAA (Taiwan), and KASI (Republic of Korea), in cooperation with the Republic of Chile. The Joint ALMA Observatory is operated by ESO, AUI/NRAO and NAOJ. HN is supported by JSPS KAKENHI Grant Number JP18K03709. NK is supported by JSPS KAKENHI Grant Number JP16K17670. YF is supported by JSPS KAKENHI Grant Number JP18K03647. MK is supported by JSPS KAKENHI Grant Numbers JP18K03656 and JP18H03721. KO acknowledges support from Shimadzu Science Foundation.
References
- Aalto et al. (2015) Aalto, S., Garcia-Burillo, S., Muller, S., et al. 2015, A&A, 574, A85
- Abdo et al. (2009) Abdo, A. A., Ackermann, M., Ajello, M., et al. 2009, ApJ, 699, 31
- Andreani et al. (2018) Andreani, P., Carpenter, J., Diaz Trigo, M., et al. 2018, ALMA Cycle 6 Proposer’s Guide
- Antonucci (1993) Antonucci, R. 1993, ARA&A, 31, 473
- Asada et al. (2006) Asada, K., Kameno, S., Shen, Z.-Q., et al. 2006, PASJ, 58, 261
- Alatalo et al. (2013) Alatalo, K., Davis, T. A., Bureau, M., et al. 2013, MNRAS, 432, 1796
- Barai et al. (2012) Barai, P., Proga, D., & Nagamine, K. 2012, MNRAS, 424, 728
- Bayet et al. (2011) Bayet, E., Viti, S., Hartquist, T. W., & Williams, D. A. 2011, MNRAS, 417, 627
- Barth et al. (2016) Barth, A. J., Boizelle, B. D., Darling, J., et al. 2016, ApJ, 822, L28
- Begelman & Cioffi (1989) Begelman, M. C., & Cioffi, D. F. 1989, ApJ, 345, L21
- Bettoni et al. (2003) Bettoni, D., Falomo, R., Fasano, G., & Govoni, F. 2003, A&A, 399, 869
- Blandford & Znajek (1977) Blandford, R. D., & Znajek, R. L. 1977, MNRAS, 179, 433
- Boizelle et al. (2019) Boizelle, B. D., Barth, A. J., Walsh, J. L., et al. 2019, arXiv e-prints, arXiv:1906.06267
- Briggs (1995) Briggs D., 1995, PhD Thesis, New Mexico Institute of Mining and Technology
- Cappellari (2002) Cappellari, M. 2002, MNRAS, 333, 400
- Cappellari (2008) Cappellari, M. 2008, MNRAS, 390, 71
- Churazov et al. (2001) Churazov, E., Brüggen, M., Kaiser, C. R., Böhringer, H., & Forman, W. 2001, ApJ, 554, 261
- Cielo et al. (2018) Cielo, S., Babul, A., Antonuccio-Delogu, V., Silk, J., & Volonteri, M. 2018, A&A, 617, A58
- Davis et al. (2013) Davis, T. A., Bureau, M., Cappellari, M., Sarzi, M., & Blitz, L. 2013, Nature, 494, 328
- Davis et al. (2017) Davis, T. A., Bureau, M., Onishi, K., et al. 2017, MNRAS, 468, 4675
- Davis et al. (2018) Davis, T. A., Bureau, M., Onishi, K., et al. 2018, MNRAS, 473, 3818
- De Lucia et al. (2006) De Lucia, G., Springel, V., White, S. D. M., Croton, D., & Kauffmann, G. 2006, MNRAS, 366, 499
- Downes & Solomon (1998) Downes, D., & Solomon, P. M. 1998, ApJ, 507, 615
- Dubinski (1998) Dubinski, J. 1998, ApJ, 502, 141
- Dutson et al. (2014) Dutson, K. L., Edge, A. C., Hinton, J. A., et al. 2014, MNRAS, 442, 2048
- Elitzur & Shlosman (2006) Elitzur, M., & Shlosman, I. 2006, ApJ, 648, L101
- Emsellem et al. (1994) Emsellem, E., Monnet, G., & Bacon, R. 1994, A&A, 285, 723
- Enßlin & Vogt (2006) Enßlin, T. A., & Vogt, C. 2006, A&A, 453, 447
- Fabian et al. (2003) Fabian, A. C., Sanders, J. S., Allen, S. W., et al. 2003, MNRAS, 344, L43
- Sanders et al. (2004) Sanders, J. S., Fabian, A. C., Allen, S. W., et al. 2004, MNRAS, 349, 952
- Fabian et al. (2005) Fabian, A. C., Reynolds, C. S., Taylor, G. B., & Dunn, R. J. H. 2005, MNRAS, 363, 891
- Fabian & Sanders (2007) Fabian, A. C., & Sanders, J. S. 2007, Heating versus Cooling in Galaxies and Clusters of Galaxies, 65
- Fabian et al. (2008) Fabian, A. C., Johnstone, R. M., Sanders, J. S., et al. 2008, Nature, 454, 968
- Fabian et al. (2015) Fabian, A. C., Walker, S. A., Pinto, C., Russell, H. R., & Edge, A. C. 2015, MNRAS, 451, 3061
- Fanaroff & Riley (1974) Fanaroff, B. L., & Riley, J. M. 1974, MNRAS, 167, 31P
- Forman et al. (2007) Forman, W., Jones, C., Churazov, E., et al. 2007, ApJ, 665, 1057
- Fujita et al. (2013) Fujita, Y., Okabe, N., Sato, K., et al. 2013, PASJ, 65, L15
- Fujita & Nagai (2017) Fujita, Y., & Nagai, H. 2017, MNRAS, 465, L94
- Fujita et al. (2016) Fujita, Y., Kawakatu, N., Shlosman, I., & Ito, H. 2016, MNRAS, 455, 2289
- Gaspari et al. (2013) Gaspari, M., Ruszkowski, M., & Oh, S. P. 2013, MNRAS, 432, 3401
- Gaspari et al. (2017) Gaspari, M., Temi, P., & Brighenti, F. 2017, MNRAS, 466, 677
- Gendron-Marsolais et al. (2018) Gendron-Marsolais, M., Hlavacek-Larrondo, J., Martin, T. B., et al. 2018, MNRAS, 479, L28
- Giovannini et al. (2018) Giovannini, G., Savolainen, T., Orienti, M., et al. 2018, Nature Astronomy, 2, 472
- Hamer et al. (2014) Hamer, S. L., Edge, A. C., Swinbank, A. M., et al. 2014, MNRAS, 437, 862
- Harada et al. (2013) Harada, N., Thompson, T. A., & Herbst, E. 2013, ApJ, 765, 108
- Hatch et al. (2006) Hatch, N. A., Crawford, C. S., Johnstone, R. M., & Fabian, A. C. 2006, MNRAS, 367, 433
- Hiura et al. (2018) Hiura, K., Nagai, H., Kino, M., et al. 2018, PASJ, 70, 83
- Hitomi Collaboration et al. (2018) Hitomi Collaboration, Aharonian, F., Akamatsu, H., et al. 2018, PASJ, 70, 13
- Hodgson et al. (2018) Hodgson, J. A., Rani, B., Lee, S.-S., et al. 2018, MNRAS, 475, 368
- Imanishi et al. (2018) Imanishi, M., Nakanishi, K., Izumi, T., & Wada, K. 2018, ApJ, 853, L25
- Izumi et al. (2016) Izumi, T., Kawakatu, N., & Kohno, K. 2016, ApJ, 827, 81
- Izumi et al. (2017) Izumi, T., Kohno, K., Fathi, K., et al. 2017, ApJ, 845, L5
- Kawakatu & Wada (2008) Kawakatu, N., & Wada, K. 2008, ApJ, 681, 73
- Kino et al. (2017) Kino, M., Ito, H., Wajima, K., et al. 2017, ApJ, 843, 82
- Kino et al. (2018) Kino, M., Wajima, K., Kawakatu, N., et al. 2018, ApJ, 864,
- Kishimoto et al. (2007) Kishimoto, M., Hönig, S. F., Beckert, T., & Weigelt, G. 2007, A&A, 476, 713
- Kormendy & Ho (2013) Kormendy, J., & Ho, L. C. 2013, ARA&A, 51, 511
- Koss et al. (2017) Koss, M., Trakhtenbrot, B., Ricci, C., et al. 2017, ApJ, 850, 74
- Krist et al. (2011) Krist, J. E., Hook, R. N., & Stoehr, F. 2011, Proc. SPIE, 8127, 81270J
- Lazareff et al. (1989) Lazareff, B., Castets, A., Kim, D.-W., et al. 1989, ApJ, 336, L13
- Levinson et al. (1995) Levinson, A., Laor, A., & Vermeulen, R. C. 1995, ApJ, 448, 589
- Lim et al. (2008) Lim, J., Ao, Y., & Dinh-V-Trung 2008, ApJ, 672, 252-265
- Mirabel et al. (1989) Mirabel, I. F., Sanders, D. B., & Kazes, I. 1989, ApJ, 340, L9
- Myers (1978) Myers, P. C. 1978, ApJ, 225, 380
- McConnell & Ma (2013) McConnell, N. J., & Ma, C.-P. 2013, ApJ, 764, 184
- Meijerink et al. (2011) Meijerink, R., Spaans, M., Loenen, A. F., & van der Werf, P. P. 2011, A&A, 525, A119
- Michiyama et al. (2018) Michiyama, T., Iono, D., Sliwa, K., et al. 2018, ApJ, 868, 95
- Mitzkus et al. (2017) Mitzkus, M., Cappellari, M., & Walcher, C. J. 2017, MNRAS, 464, 4789
- Morganti et al. (2013) Morganti, R., Fogasy, J., Paragi, Z., Oosterloo, T., & Orienti, M. 2013, Science, 341, 1082
- Nagai et al. (2010) Nagai, H., Suzuki, K., Asada, K., et al. 2010, PASJ, 62, L11
- Nagai et al. (2012) Nagai, H., Orienti, M., Kino, M., et al. 2012, MNRAS, 423, L122
- Nagai et al. (2016) Nagai, H., Chida, H., Kino, M., et al. 2016, Astronomische Nachrichten, 337, 69
- Nagai et al. (2014) Nagai, H., Haga, T., Giovannini, G., et al. 2014, ApJ, 785, 53
- Nagai et al. (2017) Nagai, H., Fujita, Y., Nakamura, M., et al. 2017, ApJ, 849, 52
- Narayan & Yi (1994) Narayan, R., & Yi, I. 1994, ApJ, 428, L13
- Nemmen et al. (2006) Nemmen, R. S., Storchi-Bergmann, T., Yuan, F., et al. 2006, ApJ, 643, 652
- Netzer & Laor (1993) Netzer, H., & Laor, A. 1993, ApJ, 404, L51
- Okuda et al. (2005) Okuda, T., Kohno, K., Iguchi, S., & Nakanishi, K. 2005, ApJ, 620, 673
- Onishi et al. (2017) Onishi, K., Iguchi, S., Davis, T. A., et al. 2017, MNRAS, 468, 4663
- Onori et al. (2017) Onori, F., Ricci, F., La Franca, F., et al. 2017, MNRAS, 468, L97
- Papadopoulos et al. (2012) Papadopoulos, P. P., van der Werf, P., Xilouris, E., Isaak, K. G., & Gao, Y. 2012, ApJ, 751, 10
- Pedlar et al. (1990) Pedlar, A., Ghataure, H. S., Davies, R. D., et al. 1990, MNRAS, 246, 477
- Perlman et al. (2007) Perlman, E. S., Mason, R. E., Packham, C., et al. 2007, ApJ, 663, 808
- Pizzolato & Soker (2010) Pizzolato, F., & Soker, N. 2010, MNRAS, 408, 961
- Pringle (1981) Pringle, J. E. 1981, ARA&A, 19, 137
- Punsly et al. (2018) Punsly, B., Marziani, P., Bennert, V. N., Nagai, H., & Gurwell, M. A. 2018, ApJ, 869, 143
- Romney et al. (1995) Romney, J. D., Benson, J. M., Dhawan, V., et al. 1995, Proceedings of the National Academy of Science, 92, 11360
- Rose et al. (2019) Rose, T., Edge, A. C., Combes, F., et al. 2019, arXiv:1902.01863
- Ruffa et al. (2019) Ruffa, I., Prandoni, I., Laing, R. A., et al. 2019, arXiv:1901.07513
- Russell et al. (2016) Russell, H. R., McNamara, B. R., Fabian, A. C., et al. 2016, MNRAS, 458, 3134
- Russell et al. (2017) Russell, H. R., McDonald, M., McNamara, B. R., et al. 2017, ApJ, 836, 130
- Salomé et al. (2006) Salomé, P., Combes, F., Edge, A. C., et al. 2006, A&A, 454, 437
- Salomé et al. (2008) Salomé, P., Combes, F., Revaz, Y., et al. 2008, A&A, 484, 317
- Salomé et al. (2011) Salomé, P., Combes, F., Revaz, Y., et al. 2011, A&A, 531, A85
- Sanhueza et al. (2012) Sanhueza, P., Jackson, J. M., Foster, J. B., et al. 2012, ApJ, 756, 60
- Scharwächter et al. (2013) Scharwächter, J., McGregor, P. J., Dopita, M. A., & Beck, T. L. 2013, MNRAS, 429, 2315
- Seyfert (1943) Seyfert, C. K. 1943, ApJ, 97, 28
- Shakura & Sunyaev (1973) Shakura, N. I., & Sunyaev, R. A. 1973, A&A, 24, 337
- Silver et al. (1998) Silver, C. S., Taylor, G. B., & Vermeulen, R. C. 1998, ApJ, 502, 229
- Smith et al. (2019) Smith, M. D., Bureau, M., Davis, T. A., et al. 2019, MNRAS, 485, 4359
- Smith & Wardle (2014) Smith, I. L., & Wardle, M. 2014, MNRAS, 437, 3159
- Solomon & Vanden Bout (2005) Solomon, P. M., & Vanden Bout, P. A. 2005, ARA&A, 43, 677
- Sosa-Brito et al. (2001) Sosa-Brito, R. M., Tacconi-Garman, L. E., Lehnert, M. D., & Gallimore, J. F. 2001, ApJS, 136, 61
- Suganuma et al. (2006) Suganuma, M., Yoshii, Y., Kobayashi, Y., et al. 2006, ApJ, 639, 46
- Suzuki et al. (2012) Suzuki, K., Nagai, H., Kino, M., et al. 2012, ApJ, 746, 140
- Taylor & Vermeulen (1996) Taylor, G. B., & Vermeulen, R. C. 1996, ApJ, 457, L69
- Tan et al. (2008) Tan, J. C., Beuther, H., Walter, F., & Blackman, E. G. 2008, ApJ, 689, 775
- Tonini et al. (2012) Tonini, C., Bernyk, M., Croton, D., Maraston, C., & Thomas, D. 2012, ApJ, 759, 43
- Tremblay et al. (2016) Tremblay, G. R., Oonk, J. B. R., Combes, F., et al. 2016, Nature, 534, 218
- van den Bosch & van de Ven (2009) van den Bosch, R. C. E., & van de Ven, G. 2009, MNRAS, 398, 1117
- van den Bosch (2016) van den Bosch, R. C. E. 2016, ApJ, 831, 134
- Véron-Cetty & Véron (2006) Véron-Cetty, M.-P., & Véron, P. 2006, A&A, 455, 773
- Wada (2015) Wada, K. 2015, ApJ, 812, 82
- Wagner et al. (2012) Wagner, A. Y., Bicknell, G. V., & Umemura, M. 2012, ApJ, 757, 136
- Walker et al. (2000) Walker, R. C., Dhawan, V., Romney, J. D., Kellermann, K. I., & Vermeulen, R. C. 2000, ApJ, 530, 233
- Walter et al. (2017) Walter, F., Bolatto, A. D., Leroy, A. K., et al. 2017, ApJ, 835, 265
- Warmels et al. (2018) Warmels, R., Biggs, A., Cortes, P., et al. 2018, ALMA Technical Handbook, ALMA Doc. 6.3, ver. 1.0, ISBN 978-3-923524-66-2
- Wilman et al. (2005) Wilman, R. J., Edge, A. C., & Johnstone, R. M. 2005, MNRAS, 359, 755
- Yuan & Narayan (2014) Yuan, F., & Narayan, R. 2014, ARA&A, 52, 529
- Zhang et al. (2018) Zhang, C., Churazov, E., & Schekochihin, A. A. 2018, MNRAS, 478, 4785