Evidence for the radiation-pressure dominated accretion disk in bursting pulsar GRO J174428 using timing analysis
The X-ray pulsar GRO J174428 is a unique source which shows both pulsations and type-II X-ray bursts, allowing studies of the interaction of the accretion disk with the magnetosphere at huge mass accretion rates exceeding g s-1 during its super-Eddington outbursts. The magnetic field strength in the source, G, is known from the cyclotron absorption feature discovered in the energy spectrum around 4.5 keV. Here, we explore the flux variability of the source in context of interaction of its magnetosphere with the radiation-pressure dominated accretion disk. Particularly, we present the results of the analysis of noise power density spectra (PDS) using the observations of the source in 1996–1997 by the Rossi X-ray Timing Explorer (RXTE). Accreting compact objects commonly exhibit a broken power-law shape of the PDS with a break corresponding to the Keplerian orbital frequency of matter at the innermost disk radius. The observed frequency of the break can thus be used to estimate the size of the magnetosphere. We found, however, that the observed PDS of GRO J174428 differs dramatically from the canonical shape. Furthermore, the observed break frequency appears to be significantly higher than what is expected based on the magnetic field estimated from the cyclotron line energy. We argue that these observational facts can be attributed to the existence of the radiation-pressure dominated region in the accretion disk at luminosities above 2 erg s-1. We discuss a qualitative model for the PDS formation in such disks, and show that its predictions are consistent with our observational findings. The presence of the radiation-pressure dominated region can also explain the observed weak luminosity-dependence of the inner radius, and we argue that the small inner radius can be explained by a quadrupole component dominating the magnetic field of the neutron star.
Key Words.:
accretion, accretion disks – magnetic fields – stars: individual: GRO J174428 – X-rays: binaries – stars: neutron1 Introduction
GRO J174428 is a transient X-ray pulsar (XRP) discovered in December 1995 with the Burst and Transient Source Experiment (BATSE) on Compton Gamma-Ray Observatory (Fishman et al., 1995). It showed frequent, spectrally hard bursts and the source was suspected to be an accreting neutron star (NS) with type II bursts, that is, bursts originating from accretion instabilities (Kouveliotou et al., 1996). Persistent pulsations with a period of 467 ms and subsequent spin-up confirmed that the source is indeed a magnetised NS accreting from a low-mass companion star via a disk. The binary orbital period was measured to be 11.8 days (Finger et al., 1996). Since the source was the first to show both bursts and pulsations, it was given the nickname “Bursting Pulsar”. The attempts of observing the companion have been inconclusive (Cole et al., 1997; Gosling et al., 2007), therefore the distance to the source is rather uncertain. The hydrogen column density was, however, measured from spectra to be around cm-2, which is consistent with typical values for sources located in the Galactic center, and thus the distance to the source is usually assumed to be around 8 kpc (Dotani et al., 1996; Nishiuchi et al., 1999). For that distance the apparent luminosities at the peaks of major outbursts exceed the Eddington luminosity for a NS.
Recently, D’Aì et al. (2015) found a cyclotron absorption line at keV in the spectrum obtained with EPIC/pn instrument on board of XMM-Newton, indicating the surface magnetic field strength of G. The same feature was independently discovered by Doroshenko et al. (2015) in the older BeppoSAX data. Thus GRO J174428 has a magnetic field of intermediate strength when compared to other accreting magnetized NSs (see a review by Staubert et al., 2019). This, together with the observed super-Eddington outbursts, implies that the magnetospheric radius and thus the inner radius of the accretion disk should be rather small, around cm, which makes the Bursting Pulsar a unique object to study, particularly, in the context of super-Eddington accretion onto a NS as a mechanism to power ultraluminous X-ray sources.
Analysis of flux variability has proven to be a valuable tool for the study of accretion physics. The observed variability in the X-ray flux and therefore in the mass accretion rate is linked to the viscous processes in the accretion disk, which may be described by the perturbation propagation model (Lyubarskii, 1997; Kotov et al., 2001; Churazov et al., 2001; Arévalo & Uttley, 2006; Ingram & van der Klis, 2013; Mushtukov et al., 2018, 2019b). In the case of an extremely high mass accretion rate, the flux variability can be modified by an optically thick envelope formed by the accretion flow covering the magnetosphere of a neutron star (Mushtukov et al., 2017, 2019a). The resulting power spectra of X-ray flux variability have a power-law shape, or a broken power-law shape if the accretion disk is truncated at some point. For instance, XRPs have a well-defined inner edge of the accretion disk coinciding with the magnetospheric radius. Due to the magnetospheric truncation of the disk, the power spectrum continuum breaks to a steeper slope, which has an index around . The break frequency is related to the maximal frequency generated in the disk. It was noted already by Hoshino & Takeshima (1993) that in accreting XRPs the high-frequency break typically coincides with the frequency of regular pulsations. Revnivtsev et al. (2009) examined PDS of several XRPs which are accreting in equilibrium and found that all of the sources have a break in power law close to the source spin frequency. In these sources, which are believed to be close to corotation, the disk is expected to be truncated at the corotation radius, where the orbital frequency of the disk matter coincides with the pulsar spin frequency (for a more detailed discussion about the torque equilibrium and the inner radius see Aly & Kuijpers, 1990; Lovelace et al., 1995; Li & Wang, 1999). Therefore, the break frequency can be taken to be closely related to the Keplerian frequency of the matter at the innermost radius.
Moreover, Revnivtsev et al. (2009) demonstrated that in transient XRPs characterized by large variations in the mass accretion rate, the break frequency as a function of the X-ray flux follows the classical dependence of the Alfvén radius on the accretion rate. Based on this connection between the break frequency and the Keplerian frequency of the magnetospheric radius, a novel method for determination of the magnetic field in such sources was proposed and successfully applied to accreting NSs and white dwarfs (see, e.g., Revnivtsev et al., 2010; Tsygankov et al., 2012; Doroshenko et al., 2014; Suleimanov et al., 2019).
In this paper, we analyze the data obtained during the two major outbursts of GRO J174428 in 1996 and 1997 in order to explore the PDS of accreting magnetized NS with a comparatively weak magnetic field, and, in the light of the obtained results, attempt to generalize the result of Revnivtsev et al. (2009) to the case of a radiation-pressure dominated accretion disk expected in this unique source. The description of the data, their reduction and the analysis are given in Sect. 2. The results of the extensive timing analysis are described in Sect. 3. In Sect. 4 we discuss the implications of our results, and we conclude in Sect. 5.
2 Observations, data reduction and analysis
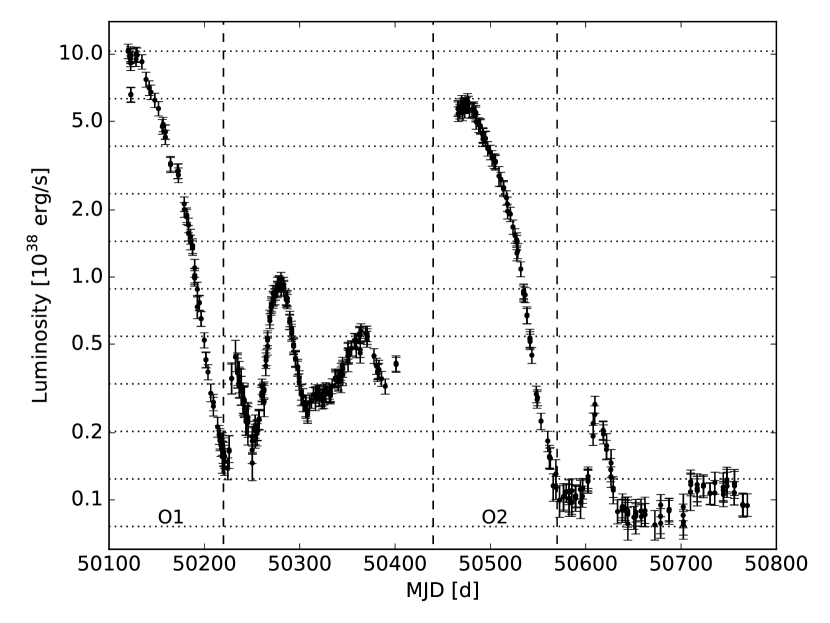
From January 1996 to November 1997, during the first two bright outbursts, GRO J174428 was observed by the Rossi X-Ray Timing Explorer (RXTE) more or less regularly, covering the source in a wide range of luminosities as seen in Figure 1. Proportional Counter Array (PCA) data were chosen for our research because of the large effective area of the instrument and its high time resolution, which allow the construction of power spectra over a wide frequency range with good statistics. The instrument has a large field of view with a radius of , which comes with the downside that other X-ray sources can contaminate the observations, especially when the source flux is low. This may happen with GRO J174428 because of its location in the direction of the highly populated center of our Galaxy. However, extremely high luminosity of GRO J174428 during the outbursts still enables us to study its properties with certainty.
In the analysis, we focus on the PDS of the two major outbursts. We exclude the “mini-outbursts” occurring after the major outbursts from our analysis because changes in several observational properties indicate that the conditions in the disk-magnetosphere interaction are different: the luminosities are lower and the type II bursting behavior becomes different (Stark et al., 1998). Recently, a thorough classification of the type II bursts and an analysis of the bursting behavior was presented by Court et al. (2018). In addition to those changes, the pulse profile changes from the highly sinusoidal seen in outbursts (Giles et al., 1996) to a much more irregular in the mini-outbursts, which indicates a change in the accretion geometry. Because of a wide field of view, separating the effect of other X-ray sources is also challenging at low luminosities.
2.1 Timing analysis
Extraction of the light curves and spectra from PCA data files was done with tools from heasoft software package111https://heasarc.nasa.gov/lheasoft/ v. 6.19 and following the standard procedures of RXTE Cook Book guide.222https://heasarc.gsfc.nasa.gov/docs/xte/recipes/cook_book.html For our analysis, the data configuration with the best time resolution was chosen from each observation. During the outburst decay periods the configuration was almost entirely in the single-bit mode in science array format, separately observed in two energy bands (approximately 110 keV and 10100 keV) and with a time resolution of . The single-bit mode combines data from all the Proportional Counter Units (PCUs). The other chosen files were mostly in the science event format with a resolution of , collected over the entire RXTE/PCA energy range, and with some of the PCUs, except PCU2, turned off from time to time. Thus, for the science event configuration only PCU2 data was used for consistency.
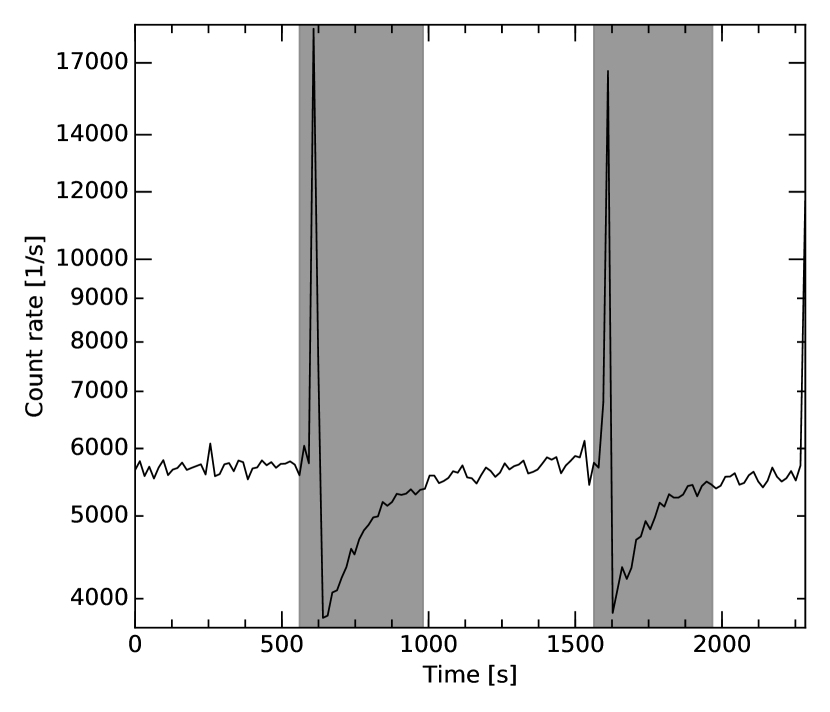
The type II bursts can be seen in the example light curve from the peak of the first outburst shown in Figure 2. The light curve can be divided into three phases corresponding to a nearly constant flux, a short-duration burst and a dip or depression with a recovery back to the constant level. The differences between the phases have been analyzed in the literature (see, e.g., Giles et al., 1996). In our analysis, we exclude different burst phases from the light curves and concentrate only on the flat part, because we can assume that during that phase the conditions in the disk remain constant.
The program powspec was used to calculate the PDS from the X-ray light curves. Discrete PDSs were calculated from 16 s long segments of the light curves and averaged together for each observation to get a PDS in a range of 0.06254096 Hz. The PDSs were further averaged within different luminosity levels as shown in Figure 1. Again, we only considered the data taken during main outbursts marked by O1 and O2. The data files in each list given to powspec must have the same time resolution, therefore some light curves were rebinned to match the lowest time resolution for the selected set of light curves. The aforementioned single-bit configurations which were separated into two different energy bands (channel ranges 0–23 and 24–249) were combined to get the counts in the entire PCA energy range.
The broadband PDSs were normalized to the mean count rate squared, so that integration of the PDS gives the fractional rms variability (Miyamoto et al., 1991). The level of the Poisson noise was estimated by averaging the nearly flat high-frequency part from 1000 to 3000 Hz in each PDS and then subtracted. We do not see deadtime or instrumental effects affecting the Poisson noise in this frequency range. The PDS from the lowest luminosity bins were excluded from the analysis due to poor statistics and possible background contamination.
2.2 Spectral analysis
To calculate the luminosities, we extracted also the energy spectra for all observations following standard procedures of RXTE Cook Book guide. In a similar way to the timing analysis, spectra were extracted only from the flat periods in the light curves. Python interface to xspec, PyXspec, was used for fitting the spectra between 2.5 and 45 keV, where the most of the flux is observed. As spectral model we consider a power law with an exponential high-energy cut-off and a Gaussian line, all absorbed by interstellar matter phabs*(powerlaw*highecut+gauss). The Gaussian component is added to account for the wide fluorescent iron K line with central energy fixed to 6.7 keV and width to 0.3 keV (see, e.g., Doroshenko et al., 2015). The hydrogen column density was fixed to cm-2, the average value for all the observations. This spectral model was used to estimate the absorption corrected flux with the errors corresponding to statistical uncertainties from the spectral fit. The source luminosity was obtained assuming isotropic emission and the distance of 8 kpc (see Figure 1).
3 Results
3.1 Shape of power density spectra
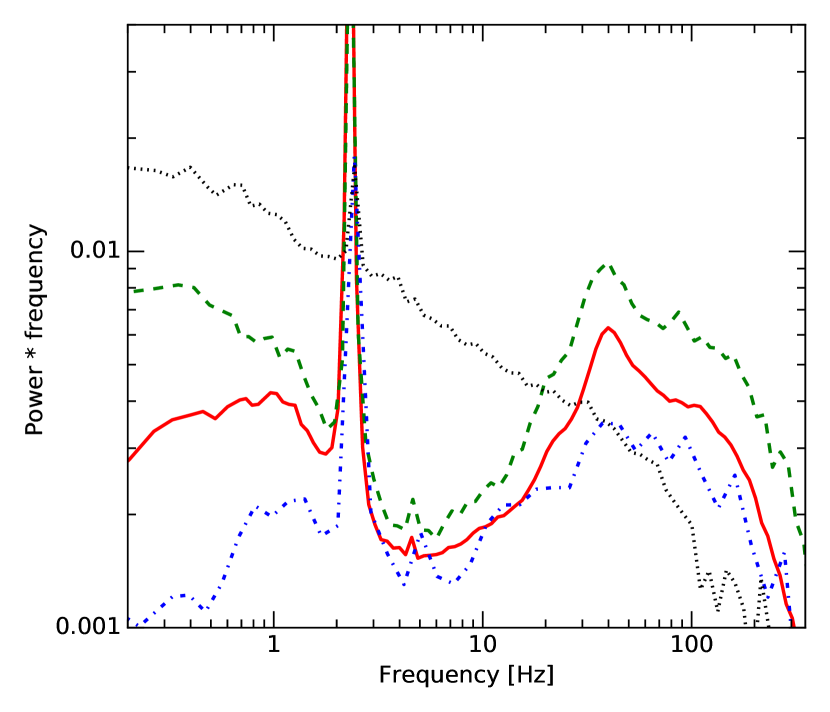
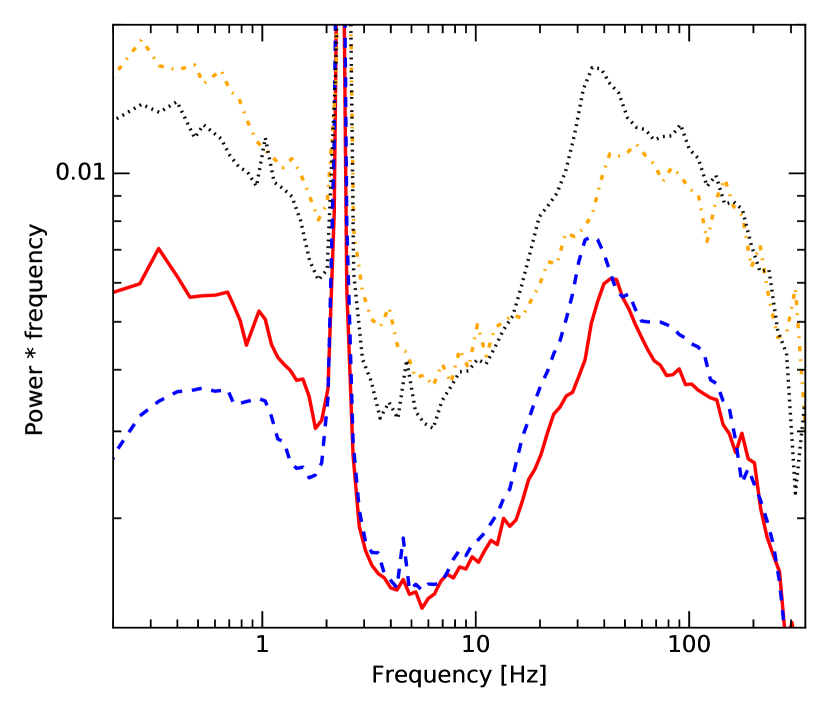
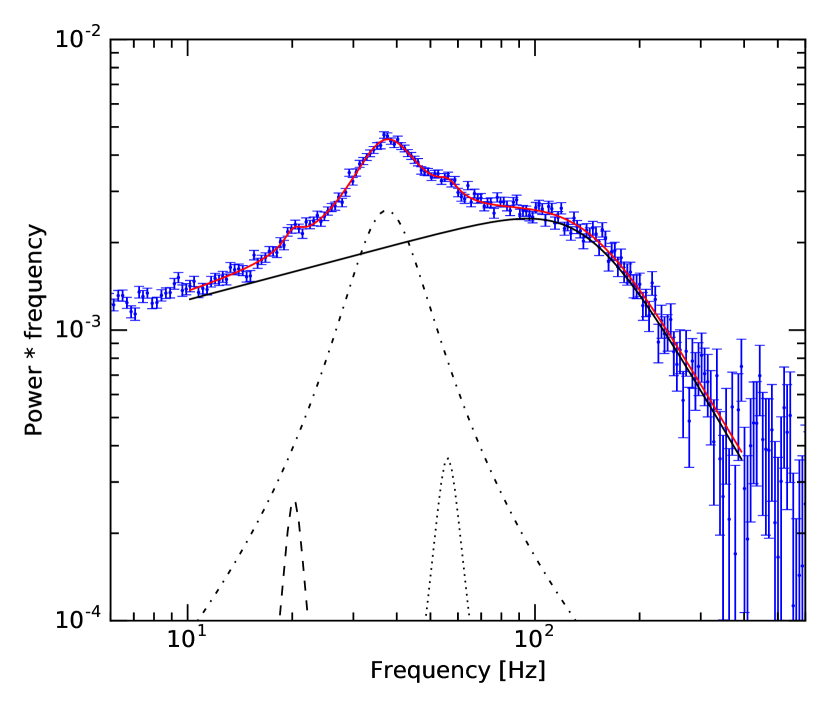
Examples of the PDS at different luminosities are shown in Figure 3. In the major outbursts of GRO J174428, the shape of the PDS differs from the standard broken power-law expected for XRPs with gas-pressure dominated (GPD) accretion disks. Instead, two bumps in ranges 0.15 Hz and 5200 Hz are observed. The high-frequency bump is shaped approximately as a broken power-law with indices and and a break around 100 Hz. The narrow peaks corresponding to the nearly sinusoidal, regular pulsations at 2.14 Hz and their weaker second harmonic are seen right in the valley between the bumps. Quasi-periodic oscillations (QPOs) are present around 20, 40 and 60 Hz (see Zhang et al., 1996; Kommers et al., 1997). The shape of the PDS evolves with the luminosity during the outburst decay phase. In excluded mini-outbursts occurring after the major outbursts, the shape of the PDS (dotted black line in Figure 3) has changed dramatically, and can be characterized by a broken power law similar to that observed in other XRPs. The break in mini-outbursts appears at frequencies nearly as high as in the major outbursts, which suggests that in all of the outbursts, the break in PDS has a common origin. There are also slight differences between the major outbursts. We show a comparison of the corresponding PDSs in Figure 4 at two luminosity levels, and erg s-1, where the measured break frequency shows large discrepancy between the outbursts (see the next section).
| ( erg s-1) | (Hz) | (Hz) | (Hz) | (Hz) |
| Outburst 1 | ||||
| Outburst 2 | ||||
3.2 Break frequency
The PDSs of GRO J174428 have varying shapes but the high-frequency bump can be fit with a smoothly broken power law
| (1) |
where is the frequency variable, is the break frequency, is the exponent of the first slope, is the exponent of the second slope, is a constant. The smoothness of the transition is defined by parameter (see Revnivtsev et al., 2009, 2010) and was fixed at 2 in order to standardize how the break frequency corresponds to the transition from one slope to another; a higher value of decreases the measured value of the break frequency and vice versa. In the outbursts, three Lorentzians were included in the model to account for the QPOs:
| (2) |
where is a constant, is the QPO centroid frequency and is its width.
The fits to the observed PDSs were conducted with the curve_fit function (non-linear least squares) of scipy.optimize package for Python over a frequency range from 10 to 400 Hz (see an example in Figure 5). Because many PDSs were averaged together, variation in the break frequency with luminosity may have smoothened the transition. The power-law index of the second slope also increases with luminosity, but our modeling showed that this does not affect the break frequency measurement.
Break frequencies and QPO centroid frequencies for the outbursts are shown in Table 1. The break frequencies vary approximately between 90 and 140 Hz in the six highest luminosity bins during the outbursts. The QPO centroid frequency, on the other hand, remains stable with luminosity although in the second outburst the values seem to be somewhat lower. One should note that the power spectra are calculated from several observations which might increase the QPO width and affect the determination of the centroid frequencies.
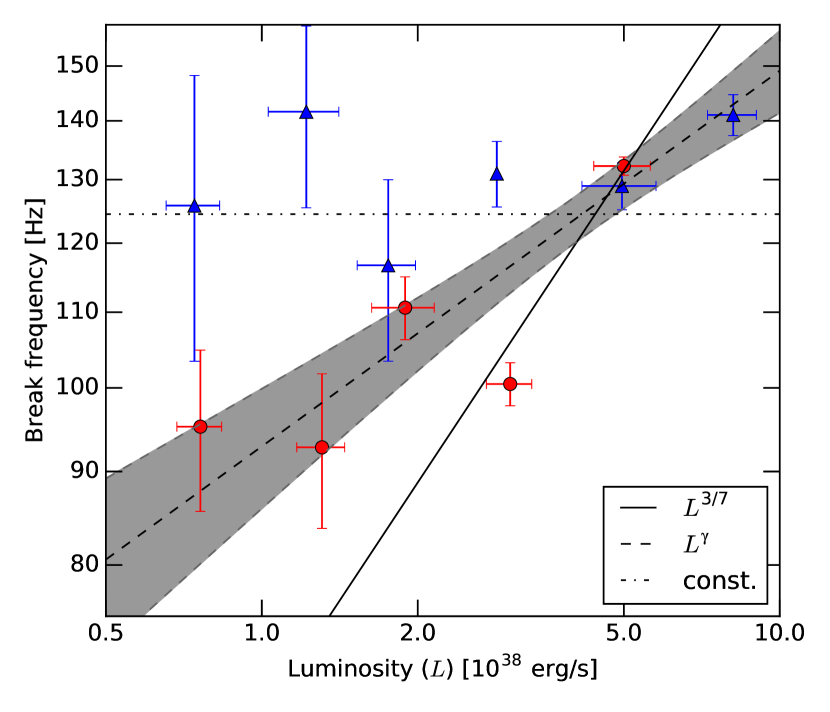
The measured break frequencies as a function of luminosity are presented in Figure 6. The luminosity values are the averages of all the individual observations in each luminosity range and the errors are their standard deviation (better describing the distribution of luminosities of individual observations within the luminosity range than just the range limits). Some data points at lowest luminosities were left out due to poor statistics. We examined the luminosity-dependence of the break frequency by fitting the break frequency data from both of the major outbursts when the behavior is expected to be similar. We used a power-law relation with three different indices: (i) fixed to (resulting from Eq. (3) by substituting given by Eq. (5)), (ii) fixed to (Chashkina et al., 2017) and (iii) being free to vary. Fitting was done using the Monte Carlo method: the data points were let to vary within the given errors in both frequency and luminosity. The slopes which were calculated without taking into account the errors in luminosity give almost the same results, and therefore, the could be calculated by using only the errors in the break frequency. The reduced for the fits with fixed exponents and were and , respectively.
Letting the slope to vary, we got with still a rather high reduced due to the scatter of the data points. Therefore, we also fit the break frequencies of both outbursts separately. For the first outburst, we got with , and for the second outburst, with (due to a low number of scattered data points). Possible physical explanations for the luminosity-dependence are discussed in Sect. 4.4
4 Discussion
4.1 Inner disk radius in GRO J174428
The main result of the timing analysis presented above, is a rather unusual PDS which deviates strongly from that observed in normal XRPs. It is important to emphasize that the presence of high-frequency variability in the Bursting Pulsar suggests that the accretion disk extends close to the NS because no additional noise is expected to be generated at frequencies higher than the Keplerian frequency at the innermost disk radius. Our discovery of the break in the high-frequency range in both the mini-outbursts and the major outbursts can thus be connected to the inner radius of the disk. In the perturbation propagation model, the observed variability can be linked to the orbital velocities of the disk matter. Down to the magnetospheric boundary, the orbital velocities as a function of disk radius are Keplerian:
| (3) |
where is the gravitational constant and is the NS mass. Following Revnivtsev et al. (2009), we associate the break frequency with the maximal frequency of disk variability, that is, the Keplerian frequency at the innermost disk radius. Solving Eq. (3) we get for the radius
| (4) |
For GRO J174428, substituting the highest measured break frequency of Hz to Eq. (4) gives a value for the inner radius of only cm at luminosity of erg s-1. During the peak of the outburst, the inner radius would then be only 4–6 NS radii for the assumed .
On the other hand, it is possible to estimate the magnetospheric size using the magnetic field strength estimated from the cyclotron line, assuming a pure dipole field. Equalizing the magnetic pressure with the ram pressure of matter in a free fall we get (Lamb et al., 1973; Frank et al., 2002),
| (5) |
where is the NS mass in units of solar masses, is the radius of the NS in cm, is the magnetic field strength in G and is the luminosity in erg s-1. Here it was assumed that the observed luminosity is proportional to the mass accretion rate. An additional parameter accounts for the deviation of the accretion flow geometry from spherical. As mass accretion rate increases, the disk is able to push itself further into the magnetosphere and for a GPD inner disk the inner radius decreases as with . The factor, , is typically assumed to be 0.51 (however, see also Kulkarni & Romanova, 2013; Chashkina et al., 2017, 2019). In Bursting Pulsar, we can compare the inner radius calculated from the break frequency using Eq. (4) to the magnetospheric radius with Eq. (5). We fix the magnetic field G and solve for . For the cm calculated above at , we get , assuming and (Suleimanov et al., 2017). The required value of is much smaller than obtained by simulations and analytic models.
We note that the equation for the magnetospheric radius given in Eq. (5) is a simplification. An additional parameter which affects the inner radius, is the inclination of the NS magnetic axis with respect to the disk. Bozzo et al. (2018) examined this effect and found that the inner radius for an inclined dipole is smaller. All in all, the radius can vary approximately by a factor of two between the extreme cases. Therefore, inclination by itself is not enough to explain the discrepancy in the measured radius values, especially considering the limitations for the inclination because the observed flux comes entirely from one magnetic pole (Strickman et al., 1996).
The inner radius of the accretion disk of GRO J174428 has been estimated previously by several authors based on different consideration, and, in fact, the radius was often found to be smaller than expected from the magnetic field producing the cyclotron line. Nishiuchi et al. (1999) based on the modeling of a broad iron line observed by ASCA satellite, obtained an estimate of cm for the inner radius. More recently, D’Aì et al. (2015) modeled XMM-Newton and INTEGRAL broadband continuum spectra, assuming that soft excess at keV corresponds to the maximal temperature of a multicolored disk, and got cm near the peak of the outburst (at a luminosity of erg s-1 for a distance of 8 kpc). The disk model normalization, on the other hand, yielded a somewhat smaller radius of cm which matches our estimates rather well. D’Aì et al. (2015) acknowledged that these estimates imply rather small inner disk radii and concluded that . Younes et al. (2015) used data from Chandra and NuSTAR right after the peak of the 2014 outburst to study the reprocessing region of the disk, and estimated inner radius of cm from the blackbody component with keV. This result was consistent with their analysis of the keV broadened iron line. Finally, Degenaar et al. (2014) also studied Chandra data and used the same keV iron feature to derive a similar inner radius of cm. Therefore, although there is a significant dispersion in measured values of inner disk radius in GRO J174428, all estimates tend to yield a relatively small radius and the lower range of estimates is consistent with our results and at odds with the magnetospheric radius estimates using the observed cyclotron line energy.
One possible explanation for this discrepancy is that the magnetic field does not have a pure dipole configuration. Instead, it could be deformed due to interaction with the disk, or there could be multipole components in the NS magnetic field, affecting the field configuration and the cyclotron line energy. The multipole moments will decay faster with respect to distance than the pure dipole field: for example a quadrupolar field has (e.g. Barnard & Arons, 1982). In this case, we could have a situation where the cyclotron line is produced close to the NS in a stronger magnetic field affected by the multipoles, while the disk only feels the weaker dipole field away from the NS, allowing the matter to come closer to the NS. We note that Tsygankov et al. (2017) invoked the same argument to explain the small magnetosphere size in ultra-luminous X-ray pulsar SMC X-3.
We can estimate the magnetospheric radius in case of a purely quadrupolar magnetic field. We do not take into account the 3-dimensional shape of the quadrupolar field but simplistically take following Frank et al. (2002) (p. 158) and arrive at
| (6) |
In the equation, the parameter again measures the deviation from spherical accretion and we also note that it may be different from the dipole case because the quadrupolar magnetosphere probably resists deformation more than the dipole. For the Bursting Pulsar at erg s-1, taking , we get cm which corresponds to a Keplerian frequency of 30 Hz that is still a factor of a few lower than the observed one. Hence, as small as is still required to be consistent with the data.
Alternatively, one can assume that the effective magnetospheric radius is indeed small compared to Alfvénic radius. Indeed, there is a large uncertainty in value of the coupling constant resulting from uncertainty in the accretion disk structure. The fact that the observed PDS shape deviates from the broken power law commonly observed in other XRPs, strongly suggests that the structure of accretion disk inner regions might indeed be different in GRO J174428. This scenario is discussed in detail below.
4.2 Disk-magnetosphere interface
In this section, we will discuss the structure of the accretion disk and some of the consequences of high luminosity in GRO J174428. First of all, it is important to emphasize that the observed high frequency variability implies that the disk extends very close to NS surface, which is to be expected given the moderate field of the source. This, together with the observed high luminosity of the source, implies that the inner edge of the disk must be in the zone A of the standard Shakura-Sunyaev accretion disk (Shakura & Sunyaev, 1973). Thus the inner regions would be radiation-pressure dominated (RPD) instead of GPD, which can be expected also to have some impact on the observed break frequency and PDS shape in general. The difference in the PDS shape between the mini-outburst and the major outburst is perhaps an indication of such a change in the physical properties of the system.
Transition from zone C (opacity dominated by absorption) to B (electron scattering dominating region) happens at a radius
| (7) |
where is the mass accretion rate in units of g s-1. Here solar chemical composition is assumed and the opacities are taken to be independent of the height with their characteristic values in the disk (Suleimanov et al., 2007). The boundary between GPD and RPD zones can be estimated from the balance between gas and radiation pressures in the disk:
| (8) |
where is the viscosity parameter of a Shakura-Sunyaev disk, and as in Eq. (7). Some uncertainty is related to this estimate because of the uncertainty in the chemical abundance. Rappaport & Joss (1997) showed in their evolutionary modeling that it is also possible for the companion to be a small helium-rich star, which would mean a helium-rich composition of the disk (cf. Gosling et al., 2007). However, this composition only reduces the boundary radius of zone A by 15%, and such as change is not large enough to affect our analysis.
The threshold luminosity for the appearance of zone A, , can be estimated from the condition that the inner radius given by Eq. (5) equals (see also Andersson et al., 2005):
| (9) |
In the case of GRO J174428, we get an estimate for the threshold to be erg s-1 for G, and . One should note that the threshold depends strongly on the value of , so for a smaller , we get erg s-1. We have also assumed the NS mass of and radius of 12 km (Steiner et al., 2016; Lattimer & Prakash, 2016; Nättilä et al., 2017). In both of the outbursts we examined, the source luminosity reaches values which are several times above the threshold luminosity. Consequently, we expect the accretion disk in GRO J174428 to have a RPD inner region.
The estimates for the boundary radii between zones A, B and C, which are independent of the magnetic field strength, are illustrated in Figure 7 for different luminosities. We also show the magnetospheric truncation radius which is estimated for the Bursting Pulsar by assuming that the observed break frequencies are the Keplerian frequencies of the inner radius. With this assumption, we see that the estimated inner radius is in the zone A. The luminosity-dependence of the inner radius is not based on theoretical models, but rather, a free power-law fit to the data points, resulting in a slope of . When we extrapolate the estimated inner radius of the RPD region to lower luminosities with the observed luminosity-dependence, we see that the zone A would exist in the disk above a threshold of erg s-1 for . The observed threshold luminosity is low and suggests that either the parameter must be much lower than 0.5 or that the magnetic field does not behave as expected. The shape of the PDS in major outbursts supports the presence of a RPD region at least down to these luminosities. Interestingly, in the decay phases of the major outbursts of GRO J174428, the bursting halts when the luminosity approaches this observed threshold.
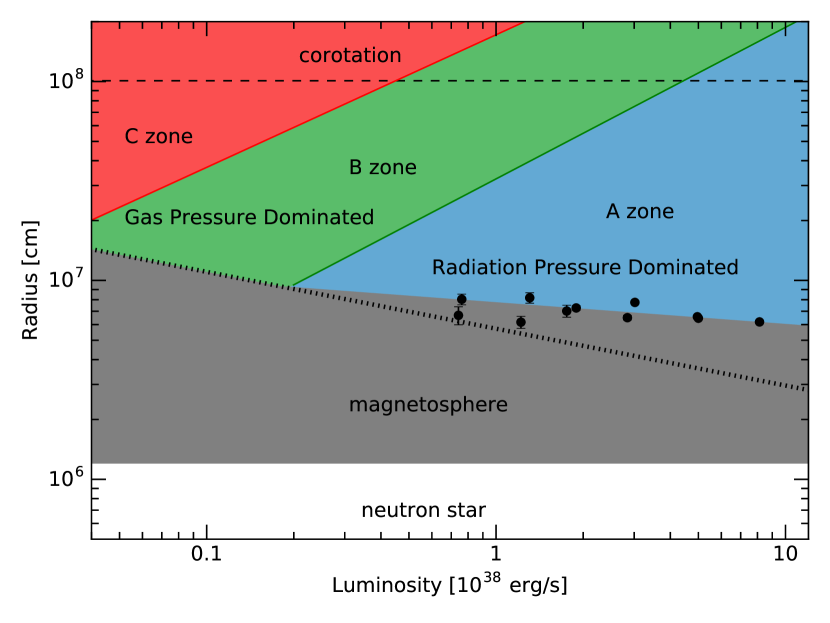
Indeed, Court et al. (2018) examine the bursting behavior and find that the typical type II bursts (similar to those seen in Rapid Burster) only appear above a threshold of corresponding to erg s-1 for a distance of 8 kpc, while below this threshold, the bursting behavior is different. This luminosity is in good agreement with our observational estimate of the threshold for the occurrence of the RPD inner disk region. Ji et al. (2019) analyzed the spectral hardness-flux diagram and the hard X-ray lags and found that there is a transition in their properties at luminosity of erg s-1, which they associate with a change of the accretion geometry. We note that below that luminosity, the post-burst dips become shallower compared to the dips at the peak of outbursts, probably indicating that the size of the burst reservoir has decreased.
4.3 Modeling PDS of a disk with a RPD inner region
According to the model of propagating fluctuations of the mass accretion rate (Lyubarskii, 1997; Kotov et al., 2001; Churazov et al., 2001; Arévalo & Uttley, 2006; Ingram & van der Klis, 2013; Mushtukov et al., 2018, 2019b), the disk produces the initial fluctuations, while the viscous properties of the disk determine the propagation process and the final properties of aperiodic variability over the entire accretion flow. The diffusion process effectively suppresses high frequency variability and, as a result, each radial coordinate in the disk contributes effectively only to variability below local viscous frequency. The viscous properties of the disk are described by the kinematic viscosity , which is assumed to be a function of radial coordinate only. This assumption is justified because specially for disks of constant -parameter (Blaes, 2014), where gas pressure and Kramer opacity dominate (C-zone), the scale-height is and therefore the kinematic viscosity is a function of radius only (Shakura & Sunyaev, 1973; Mushtukov et al., 2018).
At high mass accretion rates, however, the inner part of accretion disk becomes RPD. The dependence of the thickness of the accretion disk on the radial coordinate is different from that in the GPD part, with the thickness being almost independent of radius (Shakura & Sunyaev, 1973). Thus, the dependences of the kinematic viscosity and viscous time scale on radius become different. In particular, the viscous time scale becomes shorter and viscous diffusion is expected to suppress less effectively the initial variability at high frequencies. Therefore, one would expect an appearance of an excess of aperiodic variability power at high frequencies in accretion disks with RPD inner parts.333We have to notice that the question about stability of RPD part of accretion disk is still open. The standard RPD disks have been shown to be unstable (Shakura & Sunyaev, 1976), but the instability predicted in theory has never been detected (Done et al., 2007). At the same time, it has been shown that the aperiodic variability by itself can principally stabilize RPD accretion flow (Suková & Janiuk, 2016). See also Cannizzo (1996, 1997) discussing the bursts of GRO J174428.
In order to illustrate the effect arising from the appearance of a region with higher viscosity in accretion disk, we have to investigate the process behind the formation of PDS. The process of matter diffusion along the radial coordinate in accretion disk is described by the viscous diffusion equation
| (10) |
where is the local surface density in accretion disk (Pringle, 1981). If the kinematic viscosity is a function of radius only, Eq. (10) is linear and its solutions can be expressed through the Green’s function . They depend on the viscosity and the boundary conditions at the inner and the outer disk radii, and .
PDS of the mass accretion rate is determined by aperiodic variability arriving to a given radius from all other radial coordinates (Mushtukov et al., 2018)
| (11) |
where is the Fourier frequency, and are the PDSs of the mass accretion rate variability and the initial perturbations at radius , is the radial scale where the initial perturbations can be considered as coherent (close to the local disk scale height , see Hogg & Reynolds, 2016), is the Fourier transform of the mass accretion rate Green’s function of the viscous diffusion equation (see e.g. Kotov et al., 2001; Mushtukov et al., 2018, 2019b). The absolute value of the Fourier transform of the Green’s function contains information about suppression of variability at different frequencies.
For illustration, it is interesting to consider two accretion disk models with similar boundary conditions at the inner and outer radii, but different dependence of the kinematic viscosity on the radial coordinate: (a) , which is typical for the C-zone in -disks, and (b) accretion disk with the inner part of higher kinematic viscosity: at and at .
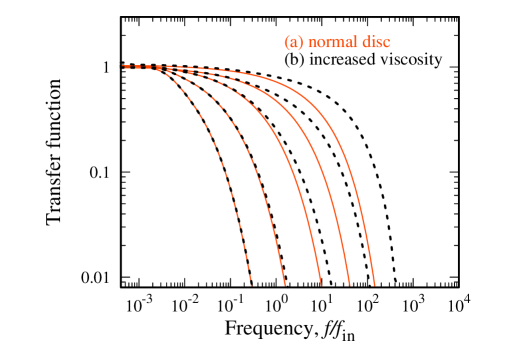
Solving numerically the equation of viscous diffusion (10), where the initial distribution of the surface density is given by the -function, we get the Green’s functions for the mass accretion rate and their Fourier transform (see Figure 8). We see that the suppression of variability at high frequencies is indeed less effective in the case of accretion disk with the inner part of higher kinematic viscosity. The difference in suppression is more evident if the initial variability originates from the region of increased viscosity. As a result, we already can conclude that increase of kinematic viscosity in the inner parts of accretion disk can lead to less effective suppression of the high-frequency variability and, therefore, increased aperiodic variability at high frequencies.
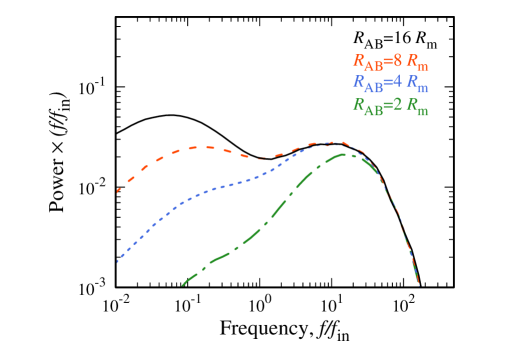
Examples of the modeled PDS for a disk with a RPD inner region are shown in Figure 9. They were done for different sizes of RPD zone while the inner radius was kept constant. The modeling results reveal that the variability is dominated by the RPD inner disk. There are two components of power: a bump at low frequencies that depends strongly on the size of the RPD region and a bump at high frequencies with a roughly constant power. We see that the model PDSs provide good qualitative match to the observation ones (see Figure 3).
Interestingly, the variability at low Fourier frequencies (below Hz) in GRO J174428 is suppressed at high mass accretion rates and the suppression starts as soon as type-II bursts start to appear in the light curve of the source. Note that numerical simulations of accretion instability of RPD part of a disk (Cannizzo, 1997) show an appearance of QPOs, which finally end up in a type-II burst. Typical time scale of the oscillations is s. We suggest that these oscillations suppress the fluctuations of the mass accretion rate at frequencies below originating from the outer parts of the accretion disk. As a result, the fluctuations observed at high mass accretion rates in GRO J174428 are produced predominantly in the inner RPD disk.
At the highest luminosities, the changes in the shape of the low-frequency bump suggest that some additional processes at the outer edge of the RPD region shape the variability. The stability of the turn-over around Hz and the high-frequency QPOs remain without an explanation within the framework of the simplified model.
As noted above, the location and the shape of the high-frequency bump in the model PDS remain almost the same when the inner radius is fixed. The constant high-frequency edge confirms the assumption that there is no added noise above the maximal (Keplerian) frequency generated at the inner radius. Thus it is justified to relate the break frequency to the Keplerian frequency of the inner radius even in the RPD part of the disk.
One complication to the observed variability may come from the hypothesized phenomenon of photon bubbles. They are thought to occur in both the accretion mound/column (see, e.g., Pringle & Rees, 1972; Klein et al., 1996) and in the RPD region of the disk (e.g. Gammie, 1998; Begelman, 2006). However, there has not been clear evidence of their presence in PDS (Revnivtsev & Mereghetti, 2015). Moreover, at least for the accretion column, the timescales are most likely outside the frequency range we examine, so we consider the scenario outlined above more plausible.
4.4 Evolution of the inner disk edge
As the luminosity increases, the inner radius derived from the Alfvén radius decreases as (see Eq. (5)). If the break frequency is associated to the Keplerian frequency at the magnetospheric radius, we get the break frequency luminosity-dependence with . In GRO J174428, however, the measured dependence of , deviates from this classical relation. To the best of our knowledge, such a weak luminosity-dependence has not been observed before. In addition to that, the behavior between the outbursts may also be different; in the first outburst, the break frequency actually appears to be almost independent of the luminosity.
The magnetospheric radius and its luminosity-dependence have been long discussed in the literature. A series of papers by Ghosh et al. (1977) and Ghosh & Lamb (1979a, b, 1992) has become rather influential in the field of XRPs. In the context of an accretion disk truncated in the RPD zone, White & Stella (1988) gave based on a model by Ghosh & Lamb. This theoretical dependence appears to be rather close to our measurement, but the choice of high magnetic diffusivity by Ghosh & Lamb has been questioned by Wang (1995). Moreover, Bozzo et al. (2009) compared the models by Ghosh & Lamb and Wang and discussed that the observations are not in good agreement with the magnetospheric radius behavior predicted in either of the theories. They concluded that although the Wang model is an improvement to the Ghosh & Lamb model, it still has its own caveats due to which it cannot be straightforwardly applied.
More recently, Chashkina et al. (2017, 2019) examined super-Eddington accretion onto magnetized NSs and found that in the RPD regime, the magnetospheric radius becomes almost independent of the mass accretion rate and larger than an inner radius expected for a GPD regime. In particular, Chashkina et al. (2019, see their Fig. 14) model gives a power-law dependence of on luminosity with index in the range between and for a dipole field and RPD inner disk, which would translate to consistent with the measured values. We note, however, that all aforementioned studies give an order of magnitude larger than that inferred from the PDS break frequencies assuming that they are Keplerian.
As discussed in Sect. 4.1, the magnetic field configuration affects the inner radius as well. If the NS magnetic field is purely quadrupolar, the Keplerian frequency at the disk inner GPD radius scales with luminosity with , slightly deviating from what we observe. A small value of , on the other hand, may result from the specific field configuration having small values close to the orbital plane and allowing the disk to penetrate closer to the NS surface.
A weak dependence has also been found in the accretion disk simulations of Kulkarni & Romanova (2013) with . As a possible cause for such a dependence they mention the deformation of the magnetosphere by the accretion disk.
5 Conclusions
We examined the RXTE observations of the Bursting Pulsar GRO J174428 and investigated how the power density spectrum (PDS) can be used as an independent method to examine the accretion disk properties of this source which has high luminosity and an intermediate magnetic field. We note that the observed PDS has a peculiar shape consisting of two bumps, thus deviating from a continuous power law from low to high frequencies predicted by perturbation propagation model for a gas-pressure dominated (GPD) accretion disk. The presence of strong variability at high frequencies indicates that the disk extends close to the NS surface. In this case, the disk should have a radiation-pressure dominated (RPD) inner region, which would affect the generation of variability in the disk. We modeled PDS using the perturbation propagation model for a disk with a RPD inner region and showed that during the major outbursts of GRO J174428, the model PDSs are indeed in qualitative agreement with the observed ones. This suggests that the RPD region is present throughout the main outburst decay phase, but not in the mini-outbursts that follow. We note that a similar phenomenology is expected to be observed in ultraluminous X-ray sources hosting NSs as compact object and the hypothesis outlined above can be tested with high quality observations of these objects.
We measured the PDS break frequency as a function of luminosity during both outbursts and found a flatter dependence of the magnetospheric size on the luminosity than expected for a GPD disks. Associating the observed PDS high-frequency break with the Keplerian frequency of the inner radius of the disk truncated by the NS magnetic field, allowed us to estimate the inner disk radius which turned out to be much smaller than that expected for the dipole magnetic field of the strength determined from the cyclotron line. Both small inner radius and its weak dependence on the luminosity can be explained by the magnetic field dominated by the quadrupole component and truncating the disk in the RPD region of the disk. Further research on both observational and theoretical sides is required to form a coherent picture of the system and how it relates to other X-ray pulsars.
Acknowledgements.
This work was supported by the grant 14.W03.31.0021 of the Ministry of Science and Higher Education of the Russian Federation. VD thanks the Deutsches Zentrum for Luft- und Raumfahrt (DLR) and Deutsche Forschungsgemeinschaft (DFG) for financial support. VFS acknowledges the support from the DFG grant WE 1312/51-1 and from the travel grant of the German Academic Exchange Service (DAAD, project 57405000). This research was also supported by the Academy of Finland travel grants 317552 (JM, SST) and 322779 (JP), by the Netherlands Organization for Scientific Research Veni Fellowship (AAM) and by the Väisälä Foundation (SST). The authors would like to acknowledge networking support by the COST Actions CA16104 and CA16214. The authors are also grateful to Anna Chashkina, Pavel Abolmasov, Sergey Molkov and Phil Uttley for the valuable discussions.References
- Aly & Kuijpers (1990) Aly, J. J. & Kuijpers, J. 1990, A&A, 227, 473
- Andersson et al. (2005) Andersson, N., Glampedakis, K., Haskell, B., & Watts, A. L. 2005, MNRAS, 361, 1153
- Arévalo & Uttley (2006) Arévalo, P. & Uttley, P. 2006, MNRAS, 367, 801
- Barnard & Arons (1982) Barnard, J. J. & Arons, J. 1982, ApJ, 254, 713
- Begelman (2006) Begelman, M. C. 2006, ApJ, 643, 1065
- Blaes (2014) Blaes, O. 2014, Space Sci. Rev., 183, 21
- Bozzo et al. (2018) Bozzo, E., Ascenzi, S., Ducci, L., et al. 2018, A&A, 617, A126
- Bozzo et al. (2009) Bozzo, E., Stella, L., Vietri, M., & Ghosh, P. 2009, A&A, 493, 809
- Cannizzo (1996) Cannizzo, J. K. 1996, ApJ, 466, L31
- Cannizzo (1997) Cannizzo, J. K. 1997, ApJ, 482, 178
- Chashkina et al. (2017) Chashkina, A., Abolmasov, P., & Poutanen, J. 2017, MNRAS, 470, 2799
- Chashkina et al. (2019) Chashkina, A., Lipunova, G., Abolmasov, P., & Poutanen, J. 2019, arXiv e-prints [arXiv:1902.04609]
- Churazov et al. (2001) Churazov, E., Gilfanov, M., & Revnivtsev, M. 2001, MNRAS, 321, 759
- Cole et al. (1997) Cole, D. M., Vanden Berk, D. E., Severson, S. A., et al. 1997, ApJ, 480, 377
- Court et al. (2018) Court, J. M. C., Altamirano, D., Albayati, A. C., et al. 2018, MNRAS, 481, 2273
- D’Aì et al. (2015) D’Aì, A., Di Salvo, T., Iaria, R., et al. 2015, MNRAS, 449, 4288
- Degenaar et al. (2014) Degenaar, N., Miller, J. M., Harrison, F. A., et al. 2014, ApJ, 796, L9
- Done et al. (2007) Done, C., Gierliński, M., & Kubota, A. 2007, A&A Rev., 15, 1
- Doroshenko et al. (2015) Doroshenko, R., Santangelo, A., Doroshenko, V., Suleimanov, V., & Piraino, S. 2015, MNRAS, 452, 2490
- Doroshenko et al. (2014) Doroshenko, V., Santangelo, A., Doroshenko, R., et al. 2014, A&A, 561, A96
- Dotani et al. (1996) Dotani, T., Ueda, Y., Ishida, M., et al. 1996, IAU Circ., 6337
- Finger et al. (1996) Finger, M. H., Koh, D. T., Nelson, R. W., et al. 1996, Nature, 381, 291
- Fishman et al. (1995) Fishman, G. J., Kouveliotou, C., van Paradijs, J., et al. 1995, IAU Circ., 6272
- Frank et al. (2002) Frank, J., King, A., & Raine, D. J. 2002, Accretion Power in Astrophysics (Cambridge, UK: Cambridge University Press)
- Gammie (1998) Gammie, C. F. 1998, MNRAS, 297, 929
- Ghosh & Lamb (1979a) Ghosh, P. & Lamb, F. K. 1979a, ApJ, 232, 259
- Ghosh & Lamb (1979b) Ghosh, P. & Lamb, F. K. 1979b, ApJ, 234, 296
- Ghosh & Lamb (1992) Ghosh, P. & Lamb, F. K. 1992, NASA STI/Recon Technical Report A, 93, 487
- Ghosh et al. (1977) Ghosh, P., Lamb, F. K., & Pethick, C. J. 1977, ApJ, 217, 578
- Giles et al. (1996) Giles, A. B., Swank, J. H., Jahoda, K., et al. 1996, ApJ, 469, L25
- Gosling et al. (2007) Gosling, A. J., Bandyopadhyay, R. M., Miller-Jones, J. C. A., & Farrell, S. A. 2007, MNRAS, 380, 1511
- Hogg & Reynolds (2016) Hogg, J. D. & Reynolds, C. S. 2016, ApJ, 826, 40
- Hoshino & Takeshima (1993) Hoshino, M. & Takeshima, T. 1993, ApJ, 411, L79
- Ingram & van der Klis (2013) Ingram, A. & van der Klis, M. 2013, MNRAS, 434, 1476
- Ji et al. (2019) Ji, L., Santangelo, A., Zhang, S., et al. 2019, MNRAS, 482, 1110
- Klein et al. (1996) Klein, R. I., Arons, J., Jernigan, G., & Hsu, J. J.-L. 1996, ApJ, 457, L85
- Kommers et al. (1997) Kommers, J. M., Fox, D. W., Lewin, W. H. G., et al. 1997, ApJ, 482, L53
- Kotov et al. (2001) Kotov, O., Churazov, E., & Gilfanov, M. 2001, MNRAS, 327, 799
- Kouveliotou et al. (1996) Kouveliotou, C., van Paradijs, J., Fishman, G. J., et al. 1996, Nature, 379, 799
- Kulkarni & Romanova (2013) Kulkarni, A. K. & Romanova, M. M. 2013, MNRAS, 433, 3048
- Lamb et al. (1973) Lamb, F. K., Pethick, C. J., & Pines, D. 1973, ApJ, 184, 271
- Lattimer & Prakash (2016) Lattimer, J. M. & Prakash, M. 2016, Phys. Rep, 621, 127
- Li & Wang (1999) Li, X.-D. & Wang, Z.-R. 1999, ApJ, 513, 845
- Lovelace et al. (1995) Lovelace, R. V. E., Romanova, M. M., & Bisnovatyi-Kogan, G. S. 1995, MNRAS, 275, 244
- Lyubarskii (1997) Lyubarskii, Y. E. 1997, MNRAS, 292, 679
- Miyamoto et al. (1991) Miyamoto, S., Kimura, K., Kitamoto, S., Dotani, T., & Ebisawa, K. 1991, ApJ, 383, 784
- Mushtukov et al. (2019a) Mushtukov, A. A., Ingram, A., Middleton, M., Nagirner, D. I., & van der Klis, M. 2019a, MNRAS, 484, 687
- Mushtukov et al. (2018) Mushtukov, A. A., Ingram, A., & van der Klis, M. 2018, MNRAS, 474, 2259
- Mushtukov et al. (2019b) Mushtukov, A. A., Lipunova, G. V., Ingram, A., et al. 2019b, MNRAS[arXiv:1904.01132]
- Mushtukov et al. (2017) Mushtukov, A. A., Suleimanov, V. F., Tsygankov, S. S., & Ingram, A. 2017, MNRAS, 467, 1202
- Nättilä et al. (2017) Nättilä, J., Miller, M. C., Steiner, A. W., et al. 2017, A&A, 608, A31
- Nishiuchi et al. (1999) Nishiuchi, M., Koyama, K., Maeda, Y., et al. 1999, ApJ, 517, 436
- Pringle (1981) Pringle, J. E. 1981, ARA&A, 19, 137
- Pringle & Rees (1972) Pringle, J. E. & Rees, M. J. 1972, A&A, 21, 1
- Rappaport & Joss (1997) Rappaport, S. & Joss, P. C. 1997, ApJ, 486, 435
- Revnivtsev et al. (2010) Revnivtsev, M., Burenin, R., Bikmaev, I., et al. 2010, A&A, 513, A63
- Revnivtsev et al. (2009) Revnivtsev, M., Churazov, E., Postnov, K., & Tsygankov, S. 2009, A&A, 507, 1211
- Revnivtsev & Mereghetti (2015) Revnivtsev, M. & Mereghetti, S. 2015, Space Sci. Rev., 191, 293
- Shakura & Sunyaev (1973) Shakura, N. I. & Sunyaev, R. A. 1973, A&A, 24, 337
- Shakura & Sunyaev (1976) Shakura, N. I. & Sunyaev, R. A. 1976, MNRAS, 175, 613
- Stark et al. (1998) Stark, M. J., Ahearn, A. M., Duva, L. J., & Jahoda, K. 1998, in American Institute of Physics Conference Series, Vol. 431, American Institute of Physics Conference Series, ed. S. S. Holt & T. R. Kallman, 401–404
- Staubert et al. (2019) Staubert, R., Trümper, J., Kendziorra, E., et al. 2019, A&A, 622, A61
- Steiner et al. (2016) Steiner, A. W., Lattimer, J. M., & Brown, E. F. 2016, European Physical Journal A, 52, 18
- Strickman et al. (1996) Strickman, M. S., Dermer, C. D., Grove, J. E., et al. 1996, ApJ, 464, L131
- Suková & Janiuk (2016) Suková, P. & Janiuk, A. 2016, A&A, 591, A77
- Suleimanov et al. (2019) Suleimanov, V. F., Doroshenko, V., & Werner, K. 2019, MNRAS, 482, 3622
- Suleimanov et al. (2007) Suleimanov, V. F., Lipunova, G. V., & Shakura, N. I. 2007, Astronomy Reports, 51, 549
- Suleimanov et al. (2017) Suleimanov, V. F., Poutanen, J., Nättilä, J., et al. 2017, MNRAS, 466, 906
- Tsygankov et al. (2017) Tsygankov, S. S., Doroshenko, V., Lutovinov, A. A., Mushtukov, A. A., & Poutanen, J. 2017, A&A, 605, A39
- Tsygankov et al. (2012) Tsygankov, S. S., Krivonos, R. A., & Lutovinov, A. A. 2012, MNRAS, 421, 2407
- Wang (1995) Wang, Y.-M. 1995, ApJ, 449, L153
- White & Stella (1988) White, N. E. & Stella, L. 1988, MNRAS, 231, 325
- Younes et al. (2015) Younes, G., Kouveliotou, C., Grefenstette, B. W., et al. 2015, ApJ, 804, 43
- Zhang et al. (1996) Zhang, W., Morgan, E. H., Jahoda, K., et al. 1996, ApJ, 469, L29