Pressure induced evolution of band structure in black phosphorus studied by 31P-NMR
Abstract
Two-dimensional layered semiconductor black phosphorus (BP), a promising pressure induced Dirac system as predicted by band structure calculations, has been studied by 31P-nuclear magnetic resonance. Band calculations have been also carried out to estimate the density of states . The temperature and pressure dependences of nuclear spin lattice relaxation rate in the semiconducting phase are well reproduced using the derived , and the resultant pressure dependence of semiconducting gap is in good accordance with previous reports, giving a good confirmation that the band calculation on BP is fairly reliable. The present analysis of data with the complemental theoretical calculations allows us to extract essential information, such as the pressure dependences of and chemical potential, as well as to decompose observed into intrinsic and extrinsic contributions. An abrupt increase in at 1.63 GPa indicates that the semiconducting gap closes, resulting in an enhancement of conductivity.
pacs:
71.27.+a, 75.20.Hr, 75.30.Mb, 78.70.DmNovel electronic properties originating from conical band dispersion near the Fermi level, which is realized in Dirac and Wyle semimetals, have been recently intensively studied. Among a growing number of candidate materials, the two-dimensional layered semiconductor black phosphorus (BP) presents ideal conditions to investigate systematically Dirac corn’s formation from finite- to zero-gap states. Transport and optical measurements indicate that the narrow band gap of approximately 0.3 eV is easily reduced to zero by applying pressure of GPa Okajima ; Akahama2 ; Xiang ; Akiba . The appearance of small Fermi surfaces above is also evidenced by the observation of Shubnikov de Haas oscillation Xiang ; Akiba . On the theoretical side, band calculations predict that four twofold-degenerate Dirac cores appear at the Z point at and BP becomes a 3D Dirac semimetal under hydrostatic pressure Gong .
In this letter, we report the results of 31P-nuclear magnetic resonance (NMR) measurements on BP under pressure for the first time. To investigate the band structure experimentally, the angle-resolved photoemission spectroscopy (ARPES) may be known as a powerful tool. Indeed, ARPES measurements on BP consisting of a few stacking layers doped with potassium indicate the realization of Dirac semimetal with anisotropic dispersion Kim . However, in the case of undoped BP, making BP in the shape of a few-layer sample enhances the gap: it moves away from the zero-gap state. Thus the pressure is currently the most realistic external parameter to tune the band structure of BP toward the formation of Dirac cores without introducing additional impurities, and therefore one needs an experimental way to gain insight into the band structure even at high pressures.
Nuclear spin lattice relaxation rate measured by NMR reflects the square of the density of states, , for nonmagnetic materials. In the previous studies of Dirac and Weyl semimetals such as -(BEDT-TTF)2I3 Hirata and TaP Yasuoka , respectively, the measurement was actually adopted to examine the existence of Dirac or Weyl nodes. For the elemental semiconductor BP, due to its simple constituent, one can obtain the reliable estimation of by conventional band calculations. The analysis of data with the derived model allows us to extract detailed information on the band structure that is not accessible without it. We also note that, from the technical point of view, of BP is easily achievable for the NMR measurements.

A polycrystalline sample of BP was prepared by a high-pressure synthesis technique Endo . The high-pressure measurements of NMR were carried out using a self-clamped BeCu/NiCrAl piston-cylinder cell. Daphne 7373 and silicon-based organic liquid were used as pressure media for the measurements below and above 1GPa, respectively. The applied pressure was monitored by measuring the resistance of a manganin wire gauge and the superconducting temperature of a tin manometer. The 31P-NMR spectra and were acquired by measuring the intensity of free induction decay signal with a phase-coherent pulsed spectrometer. Band structure calculations were performed using WIEN2k package with the LDA + mBJ potential. A -mesh of was adopted to sample the first Brillouin zone.
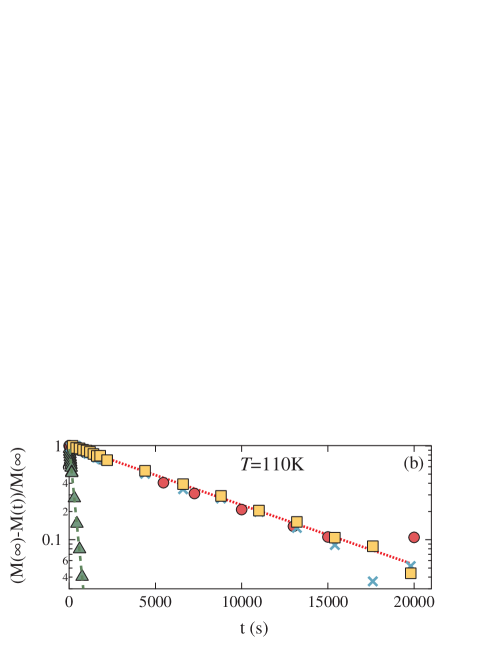
Obtained 31P-NMR spectral shape of BP is consistent with a previous report Bence . Figure 1 shows representative relaxation curves, where is the nuclear magnetization at a delay time after saturation pulses. The long decay time, for which reaches even sec below 100 K at ambient pressure (0.1 MPa) as shown later, leads to a difficulty in evaluating the accurate value of . For the reliable estimation of , was measured up to sufficiently long ’s, and all the relaxation curves in the present experiment are found to follow a single exponential function as expected for nuclear spin . As indicated in Fig. 1(a), at 273 K is monotonically shortened with increasing pressure. In contrast, Fig. 1(b) reveals that the relaxation curve at 110 K hardly depends on pressure up to 0.83 GPa.
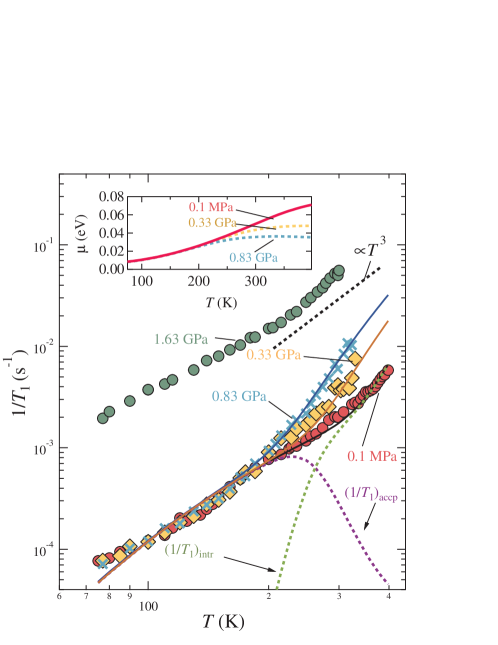
The obtained temperature dependence of at different pressures is shown in Fig. 2. In the pressure range up to 0.83 GPa, where BP is in the semiconducting phase, above 200 K increases with pressure, while below 200 K is almost independent of pressure. These characteristics are exactly expected from the results of Figs. 1(a) and (b). By considering previous reports that (i) the resistivity and the Hall mobility show intrinsic behavior of usual semiconductors above 350 K Akahama1 , (ii) the semiconducting gap is reduced with pressure Akahama2 ; Xiang ; Akiba ; Chun-Hong , and (iii) the undoped BP sample is a -type semiconductor Akahama1 , the present pressure dependence indicates that above 200 K reflects the intrinsic gap, whereas below 200 K is dominated by relaxation processes associated with the impurity band.
For nonmagnetic materials, is expressed as follows;
| (1) |
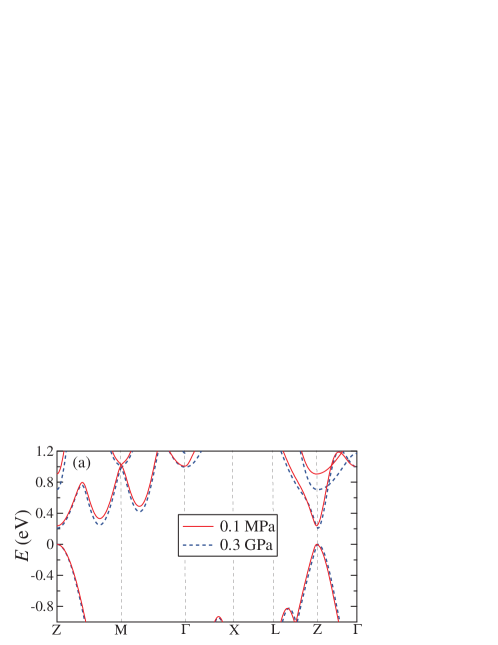
where , is the chemical potential, is the hyperfine coupling constant, is the density of states, is the Fermi-Dirac distribution function, and is the nuclear gyromagnetic ratio. One can reproduce the temperature dependence of using this equation. In order to estimate proper , we have performed the band structure calculation with the crystal structure parameters given in Table I. The obtained band structure near the Fermi energy is shown by the solid line for ambient pressure in Fig. 3(a), which indicates the existence of energy gap of 0.27 eV at the Z point. The results are in good agreement with previous experimental Han_ARPES and theoretical reports Gong .
![[Uncaptioned image]](/html/1905.05511/assets/x6.png)
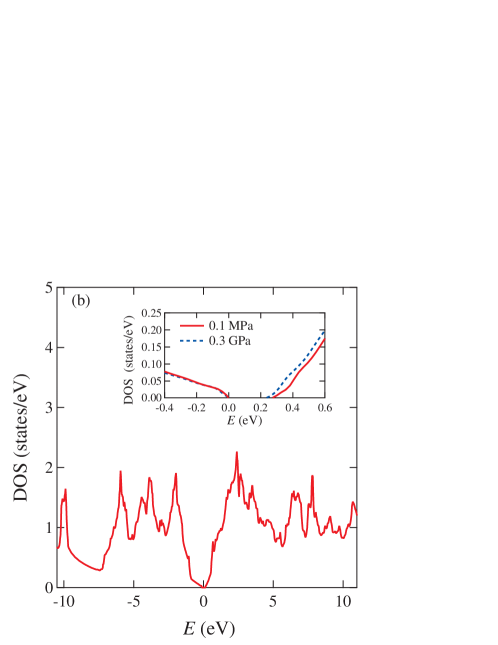
Figure 3(b) shows the calculated energy dependence of total . For the actual calculation of up to 400 K following Eq. (1), we may reduce the energy range for the integration to between eV with respect to the middle of semiconducting gap, i.e. eV. An expanded view of for this energy region is presented in the inset of Fig. 3(b). Moreover we use a simplified model where in the valence and conduction band region is approximated by linear relations as illustrated in Fig. 4. In this model, a Lorentzian-type acceptor band at the position denoted by is added to the intrinsic bands in order to reproduce the contribution of impurities to the temperature dependence of below 200 K as mentioned above. is determined from the constraint that the total number of electrons is invariant. Here, is defined as follows;
| (2) |
The data at ambient pressure were fitted simultaneously using Eqs. (1) and (2) with , , and the energy level, amplitude, and width of impurity band as fitting parameters. The fitting result is shown by a solid line in Fig. 2. Also Fig. 4 is depicted based on the resulting fitting parameters. Here, eV is close to the value obtained from the band structure calculation (0.27 eV). Moreover estimated excitation energy between the valence and acceptor bands, meV, and effective impurity concentration, cm-3, seem reasonable compared to previous estimation (18 meV and cm-3, respectively) by the Hall concentration measurement Akahama1 . Thus the results confirm the validity of the present model. The temperature dependence of is shown in the inset of Fig. 2.
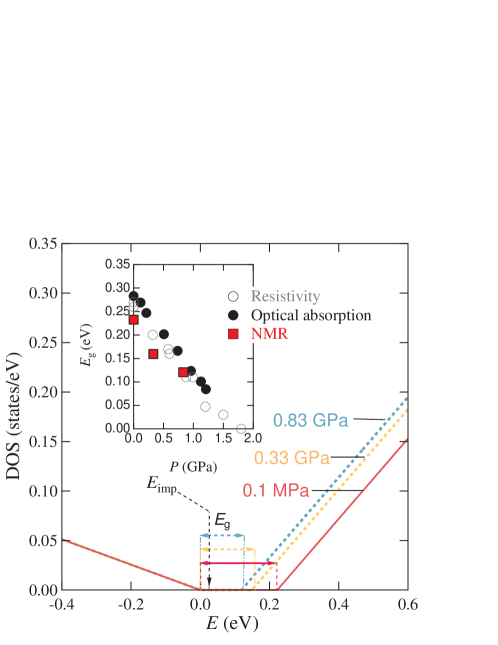
Next, in order to find how is modified with pressure, we first simulate the effect of applying small pressure on BP by utilizing the band structure calculation. The previous reports of x-ray diffraction measurements indicate that, as pressure increases, the and axes in the orthorhombic structure monotonically shrink, whereas the axis hardly changes Cartz ; Kikegawa . In Table I, the set of lattice parameters, in which the and axes are reduced by , corresponds to the application of a pressure of 0.3 GPa Kikegawa . The calculated effect of pressure on using these parameters is shown in the inset of Fig. 3(b) (broken lines). There is no significant pressure induced change in the overall shape of in the valence and conduction bands, but only is reduced with pressure. Therefore, in the following analyses of at high pressures, we assume that only dependes on pressure.
As shown in Fig. 2, the unique pressure dependences of , namely the temperature dependence above 200 K becomes steeper with increasing pressure, whereas it is pressure independent below 200 K, are successfully reproduced solely by reducing to 0.16 eV for 0.33 GPa and to 0.12 eV for 0.83 GPa in our model. As our model is constructed on the basis of the result of the band structure calculation, the consistency between the present experimental and theoretical works implies that the band calculations on BP are still reliable in the high pressure region. This is also supported by the facts that the obtained and its pressure dependence are compatible with those estimated by other experiments as shown in the inset of Fig. 4.
One can gain more detailed information from the analyses using the present model as described below. The obtained value of is decomposed into components originating from the intrinsic semiconducting band structure and from the impurity band. We divide Eq. (1) into the following two equations;
| (3) |
| (4) |
where and are the numbers of electrons which are thermally excited from the valence band to the conduction band and to the acceptor band, respectively. Equation (3) describes the relaxation associated with the intrinsic semiconducting band structure, and Eq. (4) describes the relaxation caused by the holes created in the valence band through the valence-acceptor band transition. Here we take only major relaxation processes into account, and minor contributions, such as components caused by electrons in the acceptor band as well as electrons in the valence band through the acceptor-conduction band transition, are neglected due to the tiny in the acceptor band. The decomposed ’s are represented by the broken lines in Fig. 2. below 200 K is dominated by , which is obviously the main reason for the behavior insensitive to pressure in this temperature region. In contrast, , having steeper temperature dependence than , becomes dominant above 300 K. The results reveals that the suppression of with pressure induces the shift of the vs curve toward lower temperatures, so that is pushed up in the high temperature region.
The temperature and pressure dependences of have been also evaluated using the model. As shown in the inset of Fig. 2, at ambient pressure monotonically increases with temperature, but at the high temperature limit it does not reach 0.1 eV, lower than eV, reflecting the asymmetric with respect to the middle of intrinsic gap. As pressure increases, above 250 K is suppressed, which is induced by the shrinkage of . Although the present estimation was carried out only within the semiconducting state, the information on will be crucial for examining whether or not Dirac fermions are formed at higher pressures in BP.
In addition to the semiconducting phase, we have also performed the measurement at 1.63 GPa, seemingly just above compared with the value of reported previously. The obtained is one order of magnitude larger than the data at ambient pressure in the whole temperature range (see Fig. 2). Since is independent of pressure as explained above, the enhancement of is unambiguously ascribed to a change in the intrinsic band structure, namely the density of conduction electrons is considerably increased due to the collapse of semiconducting gap. This is consistent with the evolution of semimetallic properties evidenced by the decrease in the resistivity Akahama2 ; Xiang ; Akiba and the observation of Shubmikov-de Haas oscillation Xiang ; Akiba above about 1 GPa. The result suggests that the temperature dependence of at 1.63 GPa is approximately proportional to , which is expected when the Dirac corns are formed. Indeed similar behavior is observed in the Dirac compound -(BEDT-TTF)2I3 Hirata and in the Weyl semimetal TaP Yasuoka . However the present model does not successfully reproduce the whole temperature dependence of at 1.63 GPa, suggesting the importance of more careful estimation of and . We expect that further systematic NMR measurements as a function of pressure near will be useful to improve the simulation to extract detailed information about the formation of Dirac fermion in BP.
In summary, we have for the first time carried out 31P-NMR measurements of BP at ambient pressure and high pressures up to 1.63 GPa seemingly exceeding . The obtained temperature and pressure dependences of are well reproduced by the calculation based on the model derived from the band structure calculations, giving a good confirmation that the band calculations on BP are fairly reliable. The results enable us to know how near the Fermi level changes with increasing pressure, and the obtained pressure dependence of is in good agreement with previous reports. Moreover the successful analyses in this study provide more detailed information in the semiconducting state, including the decomposed intrinsic and extrinsic contribution to the relaxation and the pressure and temperature dependences of , which will be useful to examine the realization of Dirac fermions under pressure in BP.
Acknowledgements.
We are grateful to Profs. T. Mutou and Y. Hasegawa for valuable discussions and Prof. T. Nomura for help with the band calculation. This work was supported by JSPS KAKENHI (Grant No. 18H04331).References
- (1) M. Okajima, S. Endo, Y. Akahama, and S. Narita, Jpn. J. Appl. Phys. 23, 15-19 (1984).
- (2) Y. Akahama and H. Kawamura, Phys. Stat. Sol. B 223, 349 (2001).
- (3) Z. J. Xiang, G. J. Ye, C. Shang, B. Lei, N. Z. Wang, K. S. Yang, D. Y. Liu, F. B. Meng, X. G. Luo, L. J. Zou, Z. Sun, Y. Zhang, and X. H. Chen, Phys. Rev. Lett. 115, 186403 (2015).
- (4) K. Akiba, A. Miyake, Y. Akahama, K. Matsubayashi, Y. Uwatoko, H. Arai, Y. Fuseya, and M. Tokunaga, J. Phys. Soc. Jpn. 84, 073708 (2015).
- (5) P. L. Gong, D. Y. Liu, K. S. Yang, Z. J. Xiang, X. H. Chen, Z. Zeng, S. Q. Shen, and L. J. Zou, Phys. Rev. B 93, 195434 (2016).
- (6) J. Kim, S. S. Baik, S. H. Ryu, Y. Sohn, S. Park, B. G. Park, J. Denlinger, Y. Yi, H. J. Choi, and K. S. Kim, Science 349, 723 (2015).
- (7) M. Hirata, K. Ishikawa, K. Miyagawa, M. Tamura, C. Berthier, D. Basko, A. Kobayashi, G. Matsuno, and K. Kanoda, Nat. Comm. 7, 12666 (2016).
- (8) H. Yasuoka, T. Kubo, Y. Kishimoto, D. Kasinathan, M. Schmidt, B. Yan,Y. Zhang, H. Tou, C. Felser, A. P. Mackenzie, and M. Baenitz, Phys. Rev. Lett. 118, 236403 (2017).
- (9) S. Endo, Y. Akahama, S. Terada, and S. Narita, J. App. Phys. Jpn. 21, L482 (1982).
- (10) B. G. Markus, F. Simon, K. Nagy, T. Feher, S. Wild, G. Abellan, C. C. Torres, A. Hirsch, and F. Hauke: Phys. Stat. Sol. B 254, 1700232 (2017).
- (11) Y. Akahama, S. Endo, and S. Narita, J. Phys. Soc. Jpn. 52, 2148 (1983).
- (12) Chun-Hong Li, Yu-Jia Long, Ling-Xiao Zhao, Lei Shan, Zhi-An Ren, Jian-Zhou Zhao, Hong-Ming Weng, Xi Dai, Zhong Fang, Cong Ren, and Gen-Fu Chen, Phys. Rev. B 95, 125417 (2017).
- (13) C. Q. Han, M. Y. Yao, X. X. Bai, Lin Miao, Fengfeng Zhu, D. D. Guan, Shun Wang, C. L. Gao, Canhua Liu, Dong Qian, Y. Liu, and Jin-feng Jia, Phys. Rev. B 90, 085101 (2014).
- (14) L. Cartz, S. R. Srinivasa, R. J. Riedner, J. D. Jorgensen, and T. G. Worlton, J. Chem. Phys. 71, 1718 (1979).
- (15) T. Kikegawa and H. Iwasaki, Acta Crystallogr., Sect. B 39, 158 (1983).