Newly Discovered Bright -10 Galaxies and Improved Constraints on Their Prevalence Using the Full CANDELS Area
Abstract
We report the results of an expanded search for -10 candidates over the 883 arcmin2 CANDELS+ERS fields. This study adds 147 arcmin2 to the search area we consider over the CANDELS COSMOS, UDS, and EGS fields, while expanding our selection to include sources with bluer colors than our previous mag selection. In searching for new -10 candidates, we make full use of all available HST, Spitzer/IRAC, and ground-based imaging data. As a result of our expanded search and use of broader color criteria, 3 new candidate -10 galaxies are identified. We also find again the source previously confirmed by Zitrin et al. (2015). This brings our sample of probable -11 galaxy candidates over the CANDELS+ERS fields to 19 sources in total, equivalent to 1 candidate per 47 arcmin2 (1 per 10 WFC3/IR fields). To be comprehensive, we also discuss 28 mostly lower likelihood -10 candidates, including some sources that seem to be reliably at using the HST+IRAC data alone, but which the ground-based data show are much more likely at . One case example is a bright candidate COS910-8 which seems instead to be at . Based on this expanded sample, we obtain a more robust LF at and improved constraints on the volume density of bright and galaxies. Our improved -10 results again reinforce previous findings for strong evolution in the LF at , with a factor of 10 evolution seen in the luminosity density from to .
Subject headings:
galaxies: evolution — galaxies: high-redshift1. Introduction
Over the last few years, the search for galaxies in the early universe has revealed sources out to redshifts as high as (Coe et al. 2013; Oesch et al. 2016), corresponding to 400 million years after the Big Bang. Simultaneous with these activities, tens of galaxies have been identified some 50-150 Myr later than this, at -10 (Bouwens et al. 2011; Zheng et al. 2012; Coe et al. 2013; Ellis et al. 2013; McLure et al. 2014; Oesch et al. 2013, 2014; Zitrin et al. 2014; Bouwens et al. 2015, 2016; McLeod et al. 2015, 2016; Ishigaki et al. 2018; Oesch et al. 2018).
In the search for distant galaxies, one surprise was the discovery of very bright () galaxies at -11 (Oesch et al. 2014). Subsequent work within the HST Cosmic Assembly Near-Infrared Deep Extragalactic Legacy Survey (CANDELS) and Early Release Science (ERS) programs (Grogin et al. 2011; Koekemoer et al. 2011; Windhorst et al. 2011) and also pure parallel HST programs like BoRG/HIPPIES (Yan et al. 2011; Trenti et al. 2011) have added to the number of bright () -10 candidates known (Bouwens et al. 2016; Calvi et al. 2016; Bernard et al. 2016; Livermore et al. 2018; Morishita et al. 2018). Of the known bright galaxies, the most extreme example has been the galaxy GN-z11 (Oesch et al. 2016), which owing to its exceptional brightness () and high redshift must have required an especially rare, overdense region of the universe to form (Mutch et al. 2016; Waters et al. 2016).
Identifications of such bright galaxies have been useful not only because of the amenability of the sources for spectroscopic follow-up work and redshift determinations (Zitrin et al. 2015; Oesch et al. 2016; Hashimoto et al. 2018), but also because of the utility of such sources to further characterization, i.e., allowing for properties like their dust content (Watson et al. 2015), dynamical properies (Smit et al. 2018), -continuum slopes (Wilkins et al. 2016), stellar masses (Lam et al. 2019), and physical sizes (Holwerda et al. 2015) to be examined in detail.
Despite significant work done to the present in searching for -10 galaxies, we can still make progress in expanding current -10 samples using existing data sets. For example, in the Bouwens et al. (2016) search for -10 candidate galaxies over the CANDELS fields, consideration was only given to those WFC3/IR regions with deep optical observations from the CANDELS program, i.e., roughly 85% of the CANDELS area. In addition, Bouwens et al. (2016) focused on galaxies with the reddest colors in obtaining follow-up observations with HST (Bouwens 2014: GO 13752) both to search for the highest redshift sources () and to maximize the efficiency of the follow-up observations. By adopting this conservative approach, however, Bouwens et al. (2016) potentially missed some galaxies with somewhat bluer colors.
Here, we expand the search for -10 galaxies to include the full 883 arcmin2 area within CANDELS+ERS. Our new search includes a 147 arcmin2 area with deep WFC3/IR observations not utilized in previous work. We have expanded the area we consider within CANDELS, mostly by leveraging ground-based observations where deep ACS/optical data are not available. Our new search results also benefit from our considering sources with a broader set of colors than we had previously considered and inclusion of some additional HST follow-up observations taken in cycle 23 (GO 14459: Bouwens 2015). As part of our expanded search, we also pursue the selection of -10 sources using the HST and Spitzer/IRAC 3.6m+4.5m data alone, in case confusion in the ground-based data resulted in our missing some sources in our earlier study (Bouwens et al. 2016).
The plan for this paper is as follows. In §2, we provide a brief description of the observational data we utilize and our procedures for performing photometry. In §3, we describe our selection procedure and results, while taking advantage of some cycle 23 observations to refine our constraints on the redshift of two candidates we had identified. In §4, we take advantage of the new results to obtain improved estimates of the bright ends of the and LFs. We also attempt to quantify variations in the volume densities of bright galaxies across the CANDELS fields. Finally, §5 summarizes the results of this paper. With Appendices A and B, we consider results from our HST follow-up program in cycle 23, while relaxing further our selection criteria for identifying -10 galaxies in the interests of constructing a more complete sample of such sources.
For convenience, we frequently write the HST F606W, F814W, F098M, F125W, F140W, and F160W filters as , , , , , and , respectively, throughout this work. Motivated by recent Planck results and for consistency with previous observational work (Planck Collaboration 2018), all results here are presented in terms of the standard concordance cosmology, with , , and km/s/Mpc. We adopt the AB magnitude system (Oke & Gunn 1983) throughout.
2. Observational Data and Photometry
Here we make use of a 883 arcmin2 area with the five CANDELS+ERS fields to search for bright candidate -10 galaxies. Our total search area includes both previously searched regions of CANDELS (736 arcmin2: §2.2) and new search area (147 arcmin2: §2.1).
2.1. New Search Area Within CANDELS
Here we make use of an additional 147 arcmin2 search area within CANDELS not considered in our earlier studies (Bouwens et al. 2015, 2016). Like the previously searched regions, the new region also features deep (26.5 mag, ) + observations. Observations of this depth are of significant utility for finding -10 galaxy candidates, given the increasing prevalence of such candidates at 25 mag and especially 26 mag.
The primary reason we did not consider this area in Bouwens et al. (2016) was because of the lack of especially deep ACS/optical observations over much of the area. The extreme outermost regions of the EGS mosaic were also not considered in our earlier search due to our lacking reductions of the HST data in those areas when devising our HST program to follow up specific -10 candidates (GO 13792: Bouwens 2014).
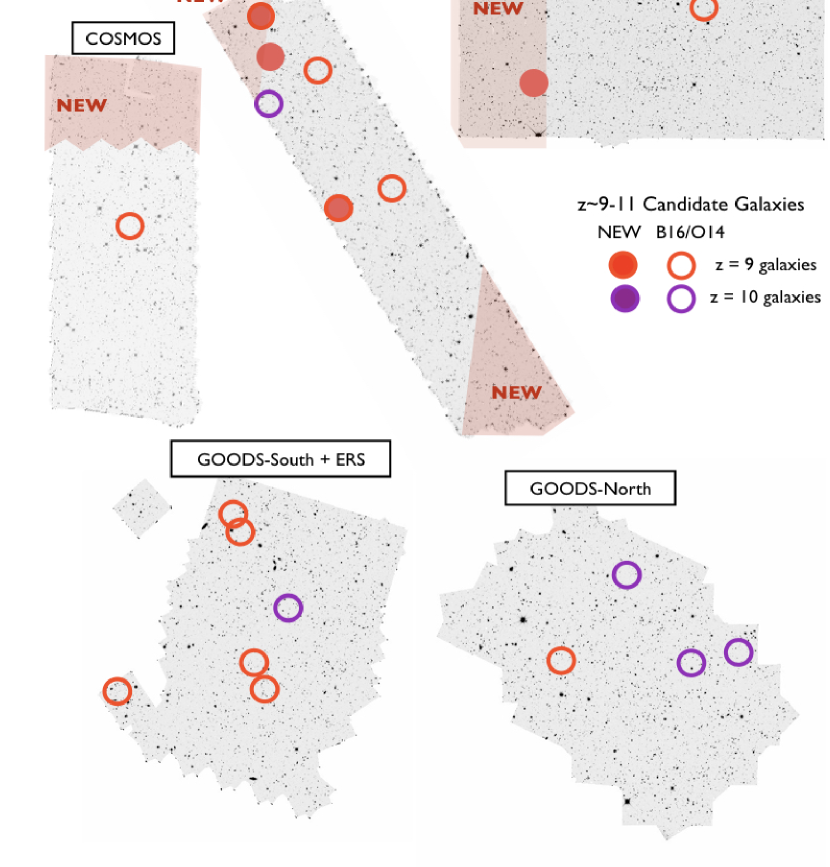
As with the case of the new EGS area, the regions considered here are located towards the edges of the CANDELS UDS and COSMOS fields (due to the roll angle constraints in scheduling HST observations and arranging for the ACS/optical parallels to land on the WFC3/IR observations). The new regions of the CANDELS UDS, COSMOS, and EGS mosaics are indicated using the light red shaded regions in Figure 1. The new areas probed in each field subtend 45.3, 48.7, 53.4 arcmin2, respectively, or 147.4 arcmin2 in total.
In constructing catalogs over these new WFC3/IR areas, we make use of the reductions from the 3D-HST team (Skelton et al. 2014) which are drizzled onto a 0.06′′ grid. Despite the lack of ACS coverage over the northern CANDELS COSMOS region from CANDELS, such coverage is available in the band thanks to the original COSMOS program (Scoville et al. 2007). Deep ACS optical and -band coverage is available from the original CANDELS program over most of the new CANDELS EGS regions we search. The v1.2 reductions of the COSMOS ACS data (Koekemoer et al. 2007) and CANDELS EGS ACS data (Koekemoer et al. 2011) were retrieved from MAST and registered against the WFC3/IR observations.
In addition, we use ground-based observations over the new CANDELS regions to improve our constraints on the photometric redshifts of sources. Over the UDS, COSMOS, and EGS fields, use was made of the Cirasuolo et al. (2010) reductions of deep optical Subaru Suprime-Cam UDS/SXDS observations (Furusawa et al. 2008), the version 7 reductions of the CFHTLS survey observations111http://www.cfht.hawaii.edu/Science/CFHTLS, and the very deep reductions (Capak et al. 2007) of the Subaru observations in the , , , , , and bands. At near-IR wavelengths, use of the especially sensitive DR3 observations over COSMOS with UltraVISTA in the bands (McCracken et al. 2012), the sensitive version 7 UKIRT/WFCAM observations over UDS, and CFHT/WIRCam observations over EGS field (McCracken et al. 2010; Bielby et al. 2012). The depths of the optical data reach to 27-28 mag () and in the near-IR, these data reach to 25-26 mag ().
Finally, for Spitzer/IRAC, use is made of the Spitzer/IRAC S-CANDELS and SEDS observations (Ashby et al. 2013, 2015), as well as any other Spitzer/IRAC observations available over the CANDELS regions. Reductions of these data were performed as detailed in Labbé et al. (2015).
2.2. Previously Searched CANDELS Areas
During the process of considering a larger search area within CANDELS, we also took the opportunity to conduct a second search for -10 candidates in regions already considered in Bouwens et al. (2016). We utilize the same reductions of the WFC3/IR and ACS observations as were presented in Bouwens et al. (2016). Those data sets reach to 26.5 mag in the WFC3/IR bands () and 27.0 mag in the optical bands. As in our previous work, use of the available ground-based + Spitzer/IRAC observations is made to obtain the best constraints on any candidate -10 galaxies that are identified. The properties of these data sets are as described in the previous subsection (see also Bouwens et al. 2016).
2.3. Targeted Follow-up Observations
Also included in the present analysis are targeted follow-up observations of two candidate galaxies. The coordinates of those candidates, COS910-5 and COS910-6, are 10:00:31.39, 02:26:39.8 and 10:00:20.12, 02:14:13.0, respectively. 1 orbit of observations were obtained on each (GO 14459: Bouwens 2015) as part of a cycle 23 program.
| ID | R.A. | Dec | aaBest-fit redshift and integrated likelihood for source derived from our HST+Spitzer/IRAC+ground-based photometry (§2.1). | P()aaBest-fit redshift and integrated likelihood for source derived from our HST+Spitzer/IRAC+ground-based photometry (§2.1). | |
|---|---|---|---|---|---|
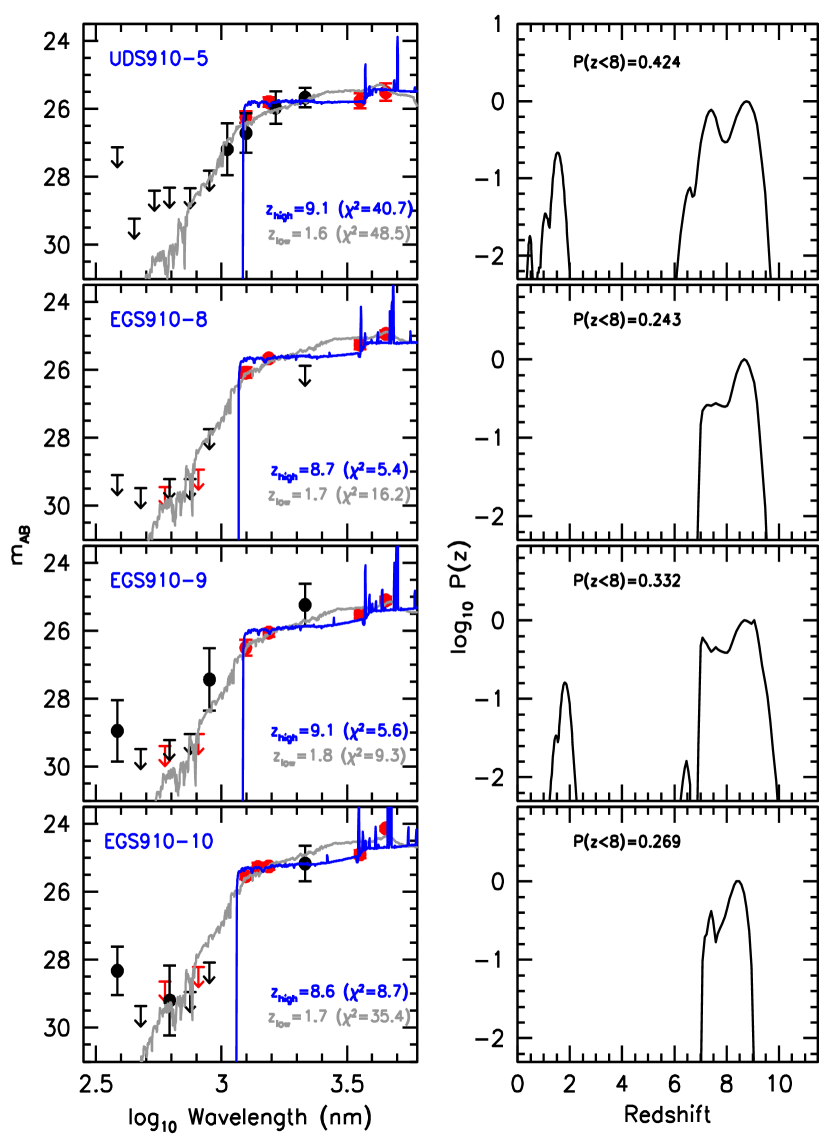
| UDS910-5 | 02:18:03.23 | 05:13:21.7 | 25.80.1 | 9.1 | 0.58 |
| EGS910-8 | 14:20:52.51 | 53:04:11.7 | 25.70.1 | 8.7 | 0.76 |
| EGS910-9 | 14:20:45.23 | 53:02:01.3 | 26.10.1 | 9.1 | 0.67 |
| EGS910-10bbAlso known as EGSY8p7. This source was previously identified by Roberts-Borsani et al. (2016) as a candidate and spectroscopically confirmed by Zitrin et al. (2015). | 14:20:08.50 | 52:53:26.6 | 25.30.1 | 8.6ccThis source has a measured spectroscopic redshift (Zitrin et al. 2015). | 0.73 |
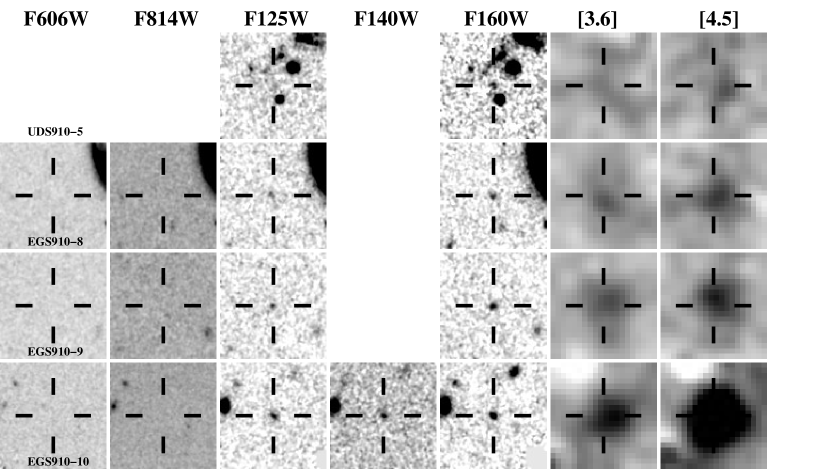
In executing the follow-up program, we adhered to a similar strategy as Bouwens et al. (2016) utilized in obtaining -band follow-up imaging observations of their candidate -10 galaxies. The goal of the follow-up observations was to test if the sources showed essentially no flux at 1m and bluer wavelengths. This is what one would expect if they were genuine galaxies.
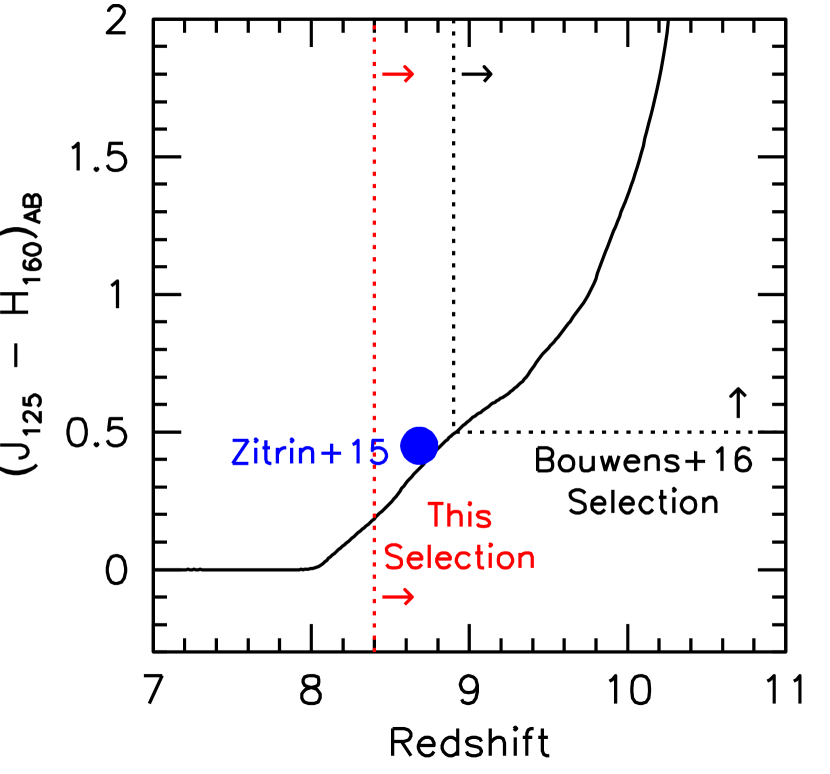
Given that the sources were identified after our cycle-22 program z9-CANDELS was complete, follow-up was requested in a subsequent HST program (GO 14459). Relative to the sources followed up as part of our cycle-22 program, these sources had slightly bluer colors, i.e., 0.5 mag, and did not satisfy the selection criteria of Bouwens et al. (2016) whose mag selection criteria preferentially identified sources with redshifts (see Figure 2). Both candidates also had -band magnitudes brighter than 25.5 mag and therefore could have an impact on the bright-end shape of the LF at . Given that this had been the subject of debate (e.g., Bowler et al. 2014 vs. Bouwens et al. 2015), follow-up of these candidates was considered to be important.
HST follow-up observations of COS910-5 and COS910-6 were obtained on February 27, 2016 and March 1, 2016, respectively. These observations were reduced using our WFC3RED pipeline (Magee et al. 2011) and drizzled onto the same astrometric frame as the ACS + WFC3/IR CANDELS data described in the previous subsection.
2.4. Photometry
Source catalogs were constructed for the new fields using the SExtractor software (Bertin & Arnouts 1996) and essentially an identical procedure to that utilized in previous papers by our team (e.g., Bouwens et al. 2015, 2017). Given that our search is for -10 galaxies, source detection is performed using the -band image alone. Our HST color measurements are made in smaller-scalable apertures based on a Kron (1980) factor of 1.2 and make use of the images after PSF correction to the -band PSF. These smaller-scalable aperture flux measurements were then scaled up to total magnitudes by first accounting for the additional flux measured in larger scalable apertures (Kron factor of 2.5) relative to smaller scalable apertures and second accounting for the flux outside the larger scalable apertures and on the wings of the PSF. The former correction is made using the detection image, while the latter correction is made using the tabulated encircled energies in the WFC3/IR handbook (Dressel et al. 2012).
Photometry of candidate -10 galaxies using the ground-based data and Spitzer/IRAC observations can also help us constrain their nature. To obtain these flux measurements, we need to cope with the very broad PSF in the ground-based and especially Spitzer/IRAC data which results in substantial overlap between sources. We use the mophongo software (Labbé et al. 2010a, 2010b, 2013, 2015) to obtain flux measurements in the presence of source confusion. Mophongo uses the higher resolution HST data to create spatial templates for each source which is then used for modeling the ground-based or Spitzer/IRAC imaging data. The amplitudes of the templates are varied until a good fit to the imaging data is obtained, and then flux from the neighboring sources is subtracted. Photometry is performed on sources in 1.2′′-diameter apertures for the ground-based data and 1.8′′-diameter apertures for the Spitzer/IRAC data. Finally, the results are corrected to total based on the PSFs derived from the imaging data.
| ID | R.A. | Dec | bbThe likelihood of the new candidate galaxies being secure sources is lower than in earlier compilations by Oesch et al. (2014) and Bouwens et al. (2016). This is because the new candidates do not yet have deep HST coverage at m from -band observations as the Oesch et al. (2014) and Bouwens et al. (2016) candidates possess. | P() | RefaaReferences: [1] Oesch et al. 2014, [2] Bouwens et al. 2015, [3] McLure et al. 2013, [4] Oesch et al. 2016, [5] Bouwens et al. 2010, [6] Zitrin et al. 2015, [7] Roberts-Borsani et al. 2016, [8] Bouwens et al. 2016 | |
|---|---|---|---|---|---|---|
| Sample | ||||||
| New Candidates from This Work: | ||||||
| UDS910-5 | 02:18:03.23 | 05:13:21.7 | 25.80.1 | 9.1 | 0.58 | |
| EGS910-8 | 14:20:52.51 | 53:04:11.7 | 25.70.1 | 8.7 | 0.76 | |
| EGS910-9 | 14:20:45.23 | 53:02:01.3 | 26.10.1 | 9.1 | 0.67 | |
| EGS910-10 | 14:20:08.50 | 52:53:26.6 | 25.30.1 | 8.683 | 1.0ccThis source has a measured spectroscopic redshift (Zitrin et al. 2015). | [6,7] |
| From Oesch et al. (2014) and Bouwens et al. (2016): | ||||||
| COS910-1 | 10:00:30.34 | 02:23:01.6 | 26.40.2 | 9.0 | 0.99 | [8] |
| EGS910-0 | 14:20:23.47 | 53:01:30.5 | 26.20.1 | 9.1 | 0.92 | [8] |
| EGS910-3 | 14:19:45.28 | 52:54:42.5 | 26.40.2 | 9.0 | 0.97 | [8] |
| UDS910-1bbThe likelihood of the new candidate galaxies being secure sources is lower than in earlier compilations by Oesch et al. (2014) and Bouwens et al. (2016). This is because the new candidates do not yet have deep HST coverage at m from -band observations as the Oesch et al. (2014) and Bouwens et al. (2016) candidates possess. | 02:17:21.96 | 05:08:14.7 | 26.60.2 | 8.6 | 0.74 | [8] |
| GS-z9-1 | 03:32:32.05 | 27:50:41.7 | 26.60.2 | 9.30.5 | 0.9992 | [1], [8] |
| GS-z9-2 | 03:32:37.79 | 27:42:34.4 | 26.90.2 | 8.9 | 0.83 | [8] |
| GS-z9-3 | 03:32:34.99 | 27:49:21.6 | 26.90.2 | 8.8 | 0.95 | [3],[8] |
| GS-z9-4 | 03:33:07.58 | 27:50:55.0 | 26.80.1 | 8.4 | 0.97 | [3],[8] |
| GS-z9-5 | 03:32:39.96 | 27:42:01.9 | 26.40.1 | 8.7 | 0.55 | [8] |
| GN-z9-1 | 12:36:52.25 | 62:18:42.4 | 26.60.1 | 9.20.3 | 0.9999 | [1], [8] |
| Sample | ||||||
| From Oesch et al. (2014) and Bouwens et al. (2016): | ||||||
| EGS910-2ddThe follow-up data obtained by the z9-CANDELS program did not significantly clarify the nature of this source (GO 13792: Bouwens 2014). Nevertheless, the available observations still support this source’s being a credible candidate. | 14:20:44.31 | 52:58:54.4 | 26.70.2 | 9.6 | 0.71 | [8] |
| GN-z10-2 | 12:37:22.74 | 62:14:22.4 | 26.80.1 | 9.90.3 | 0.9994 | [1], [2] |
| GN-z10-3 | 12:36:04.09 | 62:14:29.6 | 26.80.2 | 9.50.4 | 0.9981 | [1], [2] |
| GS-z10-1 | 03:32:26.97 | 27:46:28.3 | 26.90.2 | 9.90.5 | 0.9988 | [1], [2] |
| Sample | ||||||
| From Oesch et al. (2016): | ||||||
| GN-z11 | 12:36:25.46 | 62:14:31.4 | 26.00.1 | 11.10.1 | 1.0eeThis source has a measured spectroscopic redshift (Oesch et al. 2016). | [1], [2], [4], [5] |
3. -10 Samples
3.1. Selection Criteria
In this section, we describe the selection criteria we apply to the CANDELS UDS, COSMOS, and EGS data sets described in §2.1 and §2.2. Collectively, those data sets cover an area of 601 arcmin2. As we have emphasized earlier, 147 arcmin2 of this area was left unexplored in Bouwens et al. (2016). Meanwhile, the balance of the area, i.e., a 454 arcmin2 region with the UDS, COSMOS, and EGS regions, was re-examined using a more inclusive selection criterion than we previously utilized. This will allow for the identification of more star-forming sources between and (see Figure 2).
In identifying probable candidate -10 galaxies, we are guided by Lyman-break-like selection criteria. Significant spectroscopic work has shown that the Lyman-break selection technique is very effective in identifying galaxies at high redshifts (Steidel et al. 1996; Steidel et al. 2003; Vanzella et al. 2009; Stark et al. 2010; Smit et al. 2018).
To create a sample of potential -10 candidates, we required that sources in our selection be detected at least at 6 in the band in a 0.35′′-diameter aperture to ensure that sources in our selection are real.
Sources in our selection were also required to show a parameter less than 4. Following Bouwens et al. (2011), we defined the parameter as where is the flux in band in a consistent aperture, is the uncertainty in this flux, and SGN() is equal to 1 if and if .
For each source that satisfied our -band detection criteria and optical non-detection criteria, we computed redshift likelihood distributions based on our HST, Spitzer, and ground-based photometry using the EAZY photometric redshift code (Brammer et al. 2008). In deriving the redshift likelihood distribution for each source, we make use of EAZY_v1.0 template set supplemented by SED templates from the Galaxy Evolutionary Synthesis Models (GALEV: Kotulla et al. 2009). Nebular continuum and emission lines were added to the later templates using the Anders & Fritze-v. Alvensleben (2003) prescription, a metallicity, and a rest-frame EW for H of 1300Å.
Selected sources were required to have a maximum likelihood redshift following the treatment in Bouwens et al. (2016). In Bouwens et al. (2016), we adopted this redshift limit to provide a midway point between our and -dropout selections where the median redshift was 6.8 and 7.9. Use of as the lower redshift limit for samples also allows us to slightly increase the number of sources in our samples, providing us with more leverage on the shape of the LF at early times.
In addition to requiring that sources being at , we also require that 50% of their total integrated redshift likelihood be at . For two of the -10 candidates over these fields, we could include the constraints obtained by targeted -band observations on the sources from a cycle-23 program (§2.3).
Finally, the [3.6] colors of selected sources were required to be bluer than 1.4 mag to avoid selecting intrinsically red sources at lower redshifts. With such a [3.6] limit, we would identify every extreme -11 source in the Bowler et al. (2017), Stefanon et al. (2019), and Oesch et al. (2014) selections over 1.5 deg2, as we clearly show in Figure 12 from Appendix B. Conversely, sources with colors redder than 1.4 mag almost always appear to be at (for the cases we have examined in Appendix B).
The above criteria differ from those utilized in Bouwens et al. (2015, 2016) in that they allow for the selection of sources with colors bluer than 0.5 mag. Note that a color of 0.5 mag corresponds to a redshift of 8.9 for sources with -continuum slopes of (see Figure 2). Bouwens et al. (2016) explicitly did not consider such sources to focus on the highest redshift sources over CANDELS with their follow-up observations.
3.2. -10 Sample
Application of the above selection criteria to our photometric catalogs allowed us to identify three new candidates over the previously unexplored area that we searched from CANDELS UDS, COSMOS, and EGS (a 147 arcmin2 area). One of these candidates was identified over the CANDELS UDS area, while the other two candidates were from the new CANDELS EGS area we examined. No new candidates were identified over the area we considered from CANDELS COSMOS.
A fourth galaxy was identified over the original 454 arcmin2 area previously considered by us in Bouwens et al. (2016) over CANDELS UDS, COSMOS, and EGS. This source is the now well-known galaxy initially identified by Roberts-Borsani et al. (2016) and spectroscopically confirmed by Zitrin et al. (2015).
Only one of the two candidates targeted with HST -band observations from our cycle 23 program was determined to have a probable redshift in excess of 8. However, even in the case of that source, our best estimate for its redshift is 8.3, which would put it below our selection limit of 8.4.
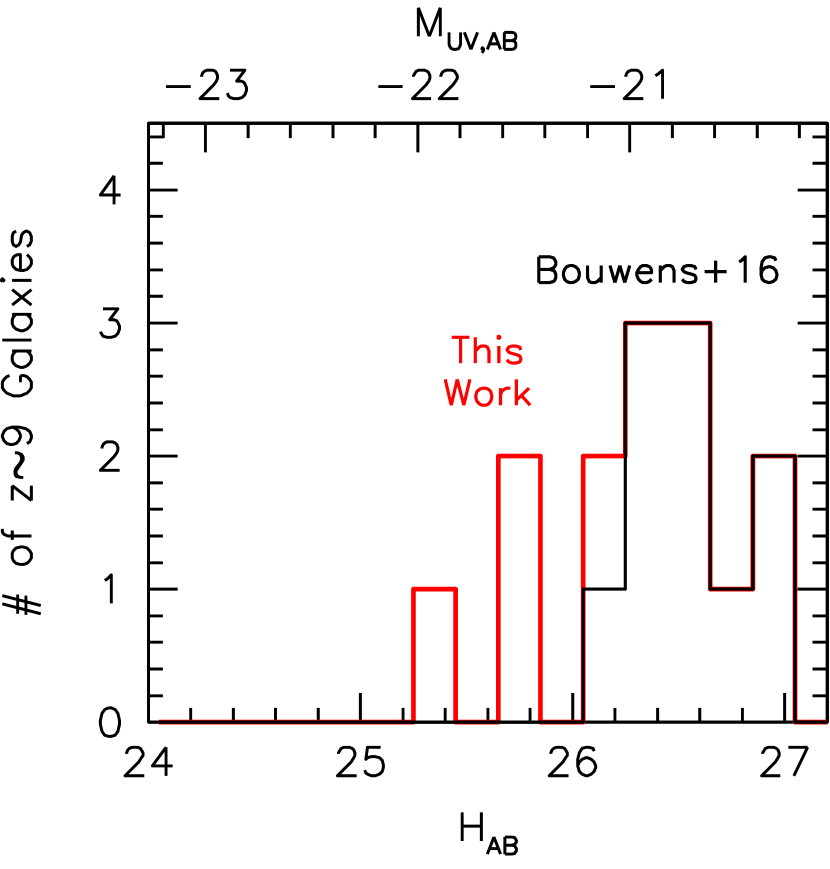
Sources in the selected sample had band magnitudes between 25.3 and 26.1 mag, similar to those identified by Bouwens et al. (2016) but roughly 0.5 mag brighter in terms of their overall magnitude. See Figure 5. The brightest source in our selection was previously identified by Roberts-Borsani et al. (2016) by focusing on the brightest () sources and requiring them to be undetected in the optical data while showing very red [3.6][4.5] colors, as is expected at due to the contribution of [OIII]+H line emission to the 4.5m fluxes.
In addition to the three new candidate galaxies identified here, there are also 28 other candidate galaxies identified over the CANDELS UDS, COSMOS, and EGS fields which, while mostly being lower quality candidates in general, could nevertheless be at -10 in a few cases. These sources are presented in Appendix A, B, and in Tables 4 and 5. Three of these candidates were identified as part of our earlier -10 search (Bouwens et al. 2016: their Table 7), but which we have been unable to thus far confirm through the acquisition of deeper HST data. 6 of the candidates have redshifts 8.4. 16 of the candidates were identified using the HST + Spitzer/IRAC 3.6m+4.5m data alone, in case confusion in the ground-based observations affected our selection (e.g., if there are spurious detections in the ground-based optical data).
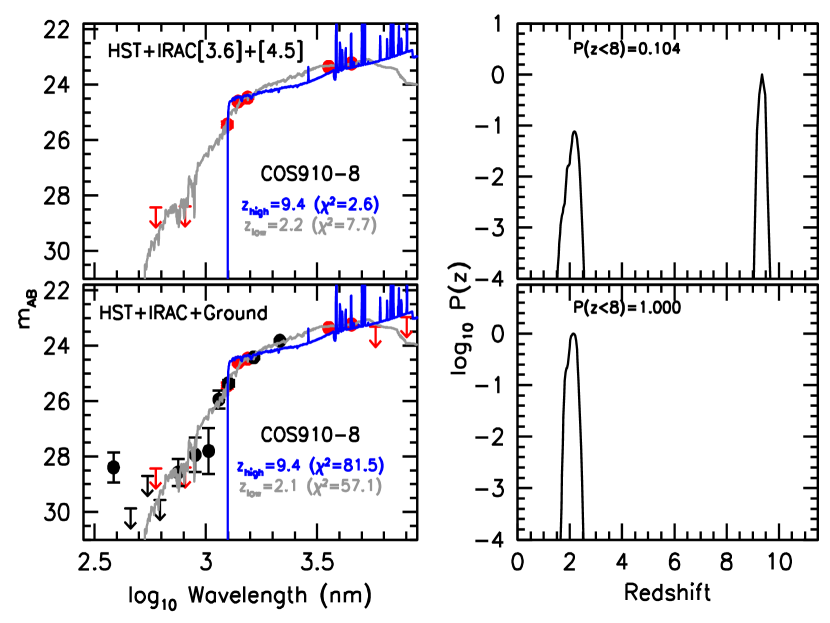
Of all the candidate -10 sources included in Appendix B, a particularly interesting case is COS910-8, given its exceptional brightness mag. Using the HST+Spitzer/IRAC 3.6m+4.5m photometry, we estimate a redshift of for the source, with 90% of the probability lying at . While it would appear to be quite a compelling candidate based on our HST+Spitzer/IRAC 3.6m+4.5m photometry, our assessment of this candidate depends sensitively on whether we incorporate constraints from our ground-based photometry or not. While we initially considered the possibility that this source might have been erroneously excluded from our earlier -10 selections (Bouwens et al. 2016) due to inclusion of optical flux from a bright neighbor, photometry on the source, after careful subtraction of the neighbor, indicates that this source is much more likely at , particularly owing to the apparent detection of this source in the 1.15m J2 band at (see Figure 11 in Appendix B), the SED shape of the source defined by the , , and Spitzer/IRAC flux measurements, and tentative 1-2 detections of the source in the , , and bands. On the basis of the computed , the probability that COS910-8 is at is 210-6. Given the high value of relative to the number of constraints minus fit degrees of freedom, it is possible that our estimated flux uncertainties are too small. If we renormalize these uncertainties so that the reduced is 1 for the best-fit solution, the probability that this candidate is at is 210-4.
We now return our discussion to the new candidates identified as part of this study (Table 1). Each of these candidates show a 50% probability of having a redshift 8. Nevertheless, each of them could have a redshift . Previously, Bouwens et al. (2016) had identified 9 -10 candidates that showed a 58% probability of lying at and followed them up with -band observations to test their robustess. Based on the follow-up observations, four sources were confirmed as robust candidates, four sources were found to prefer a redshift , and for one source, the follow-up observations were not helpful in clarifying the nature of the source.
We will assume that follow-up of the new candidates with -band observations would yield a similar 50% contamination fraction to that obtained in our earlier follow-up efforts. Given that one of the four sources in our expanded selection was already spectroscopically confirmed, i.e., the Zitrin et al. (2015) source, we assume that 2.5 of the candidates are bona-fide galaxies and 1.5 of our candidate have redshifts .
We will combine the new identifications of candidate galaxies with the Oesch et al. (2014) and Bouwens et al. (2016) identifications of -10 candidate galaxies. Table 2 provides a comprehensive list of all the -10 candidates we have identified.
In total, our selection includes 9 high-confidence () candidate galaxies, 3 high-confidence candidate galaxies, and 1 spectroscopically confirmed galaxy. Our and selections include 5 sources and 1 source, respectively, with 55% of the probability lying at . If all of these sources lie at , we find a total of 19 -11 sources in the 883 arcmin2 area that make up the 5 CANDELS fields. This translates to a surface density of 1 bright -11 candidate per 47 arcmin2 (i.e., 10 WFC3/IR pointings).
4. Luminosity Function Results
In the present study, we have expanded our search for -10 galaxies to cover a 883 arcmin2 area within CANDELS, which is an improvement on the 736 arcmin2 area we previously considered in Bouwens et al. (2016). Thanks to our expanded search area, we were able to expand our -10 selection from 15 candidate -10 galaxies over the CANDELS fields to 19 such candidates.
In this section, we make use of our expanded -10 sample and search area to improve our constraints on the prevalence of bright galaxies at -10.
| aaDerived at a rest-frame wavelength of 1600Å. | (10-3 Mpc-3 mag-1) |
|---|---|
| galaxies | |
| 22.72 | 0.0014bb upper limit. |
| 21.92 | 0.0008 |
| 21.12 | 0.0074 |
| 20.32 | 0.0246 |
| galaxies | |
| 22.84 | 0.0014bb upper limit. |
| 22.05 | 0.0010bb upper limit. |
| 21.25 | 0.0011 |
| 20.45 | 0.0115 |
4.1. Luminosity Function Results
As in other studies of the LF (e.g., Steidel et al. 1999; Bouwens et al. 2007, 2008), we achieve constraints on our model LFs by comparing in detail with the surface density of -10 candidates found in the data sets.
Given the small number of -10 candidates in our bright samples and especially per search field, we use luminosity bins of width 0.8 mag in constructing a LF and model the counts in each observational bin in the data sets as Poissonian. This results in the following estimated likelihood for a model LF given a set of observations:
| (1) |
where is the product symbol and which runs over all search fields each denoted by index and over all magnitude intervals denoted by index , where is the observed number of sources in search field and magnitude interval , and where is the expected number of sources in search field and magnitude interval .
We compute the expected number of sources per bin, i.e., , from a model LF as follows:
| (2) |
where is the surface density of galaxies in some search field with magnitude , is the volume density of galaxies with absolute magnitude , and is the effective selection volume for which galaxies with absolute magnitude will both satisfy our dropout selection criteria and be observed to have an apparent magnitude . The binning we adopt for and is the same 0.8-mag binning as we adopt for the stepwise LF .
Our procedure for estimating the selection volume is almost identical to what we do in many other of our recent papers on the high-redshift luminosity function (e.g., Bouwens et al. 2010, 2011, 2015). We begin by first constructing a mock catalog of sources with redshifts lying between to , luminosities lying between 23 and 19.5 mag, and with random spatial positions within the CANDELS UDS, COSMOS, and EGS fields. Realistic images for sources from our mock catalogs are first simulated by artificially redshifting similar luminosity sources from the Bouwens et al. (2015) HUDF samples to -11 using the Bouwens et al. (1998, 2003) cloning procedure. Source sizes are scaled as to match the galaxy size vs. redshift trend observed to -10 (e.g., Ono et al. 2013; Holwerda et al. 2015; Shibuya et al. 2015). The -continuum slopes are set equal to , consistent with that measured at high luminosities at -8 (Bouwens et al. 2012, 2014; Finkelstein et al. 2012; Willott et al. 2013; Rogers et al. 2014), with the dispersion set to 0.3 (Bouwens et al. 2012; Castellano et al. 2012).
In addition to producing HST images for sources in our mock catalogs, ground-based and Spitzer/IRAC images are also generated for all sources in our catalogs. These images are created by convolving the HST images by the appropriate PSF-matching kernel, i.e., HST-to-Spitzer/IRAC or HST-to-ground-based-image. The simulated HST, ground-based, and Spitzer/IRAC images of our mock sources are added to the real data and sources are detected, selected, and characterized in the same way as sources in the real observations. In this way, we compute the selection volume , where sources in the absolute magnitude interval are selected and found to have an apparent magnitude in the interval .
We combine our new candidate galaxies with those previously identified over the CANDELS fields. Motivated by the results of Bouwens et al. (2016: see §3.2) who only are able to confirm 50% of the candidates with the -band follow-up observations, we assume the same for our new candidates lacking follow-up -band observations. For two and candidates for which our cycle-22 follow-up observations were indeterminant, i.e., UDS910-1 and EGS910-2, we treat these sources as 0.5 and candidates, consistent with the 50% confirmation rate achieved with follow-up observations and consistent with the procedure applied in Bouwens et al. (2016). We treat all of the other previously presented candidates from Bouwens et al. (2016) as full candidates, with the exception of GS-z9-5 which we treat as half a candidate.
As discussed in Roberts-Borsani et al. (2016), there is reason to believe that the bright source EGS910-10 (or EGSY8p7 as Zitrin et al. 2015) may benefit from lensing magnification from two massive intermediate redshift galaxies that lie within of it. While the degree of magnification is uncertain, we assume it is the same factor of 2 that Roberts-Borsani et al. (2016) estimate, and therefore shift the source in magnitude by 0.75 mag. Since galaxies also satisfy our selection criteria (but likely constitute a very small fraction of that sample), we include the Oesch et al. (2016) GN-z11 source in our sample.
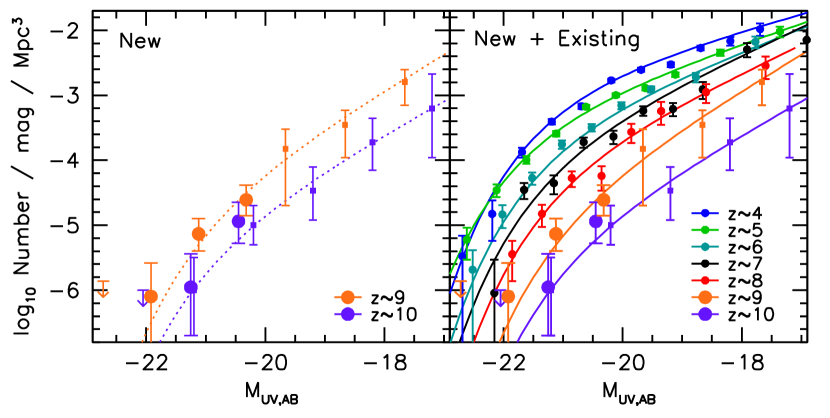
Using our expanded and samples and computed volumes, we recomputed the stepwise rest- LFs at and . Our results are presented in Table 3 and the left panel of Figure 7. Our results are shown in the context of our previous results at , , , , and in the right panel to Figure 7, and there is reasonably smooth evolution with redshift.
We can quantify the redshift evolution better by using our new stepwise LF determination to compute the total luminosity density brightward of mag. The integrated luminosity density brightward of is ergs/s/Hz/Mpc3 at and ergs/s/Hz/Mpc3 at . We can compare these luminosity densities with that seen at to the same limiting magnitude, we find , using the LF from Bouwens et al. (2015) LF.
As in previous work (e.g., Oesch et al. 2014, 2018), the luminosity density we find at , and especially at , is much smaller than found at , just 100-200 Myr later in cosmic time. The evolution from to is a factor of 10, consistent with estimates from much previous work (e.g., Oesch et al. 2012; Ellis et al. 2013; Bouwens et al. 2015; Oesch et al. 2018; Ishigaki et al. 2018). The present results are therefore broadly consistent with a rapid evolution in the LF results at , as earlier suggested by the “accelerated” evolution scenario of Oesch et al. (2012). Given the small amount of dust extinction that appear to be present in most galaxies at (e.g., Bouwens et al. 2014, 2016), a factor of ten evolution in the luminosity density is equivalent to the star formation rate density evolving by a factor of 10.
4.2. Comparison to Previous -10 Search Results
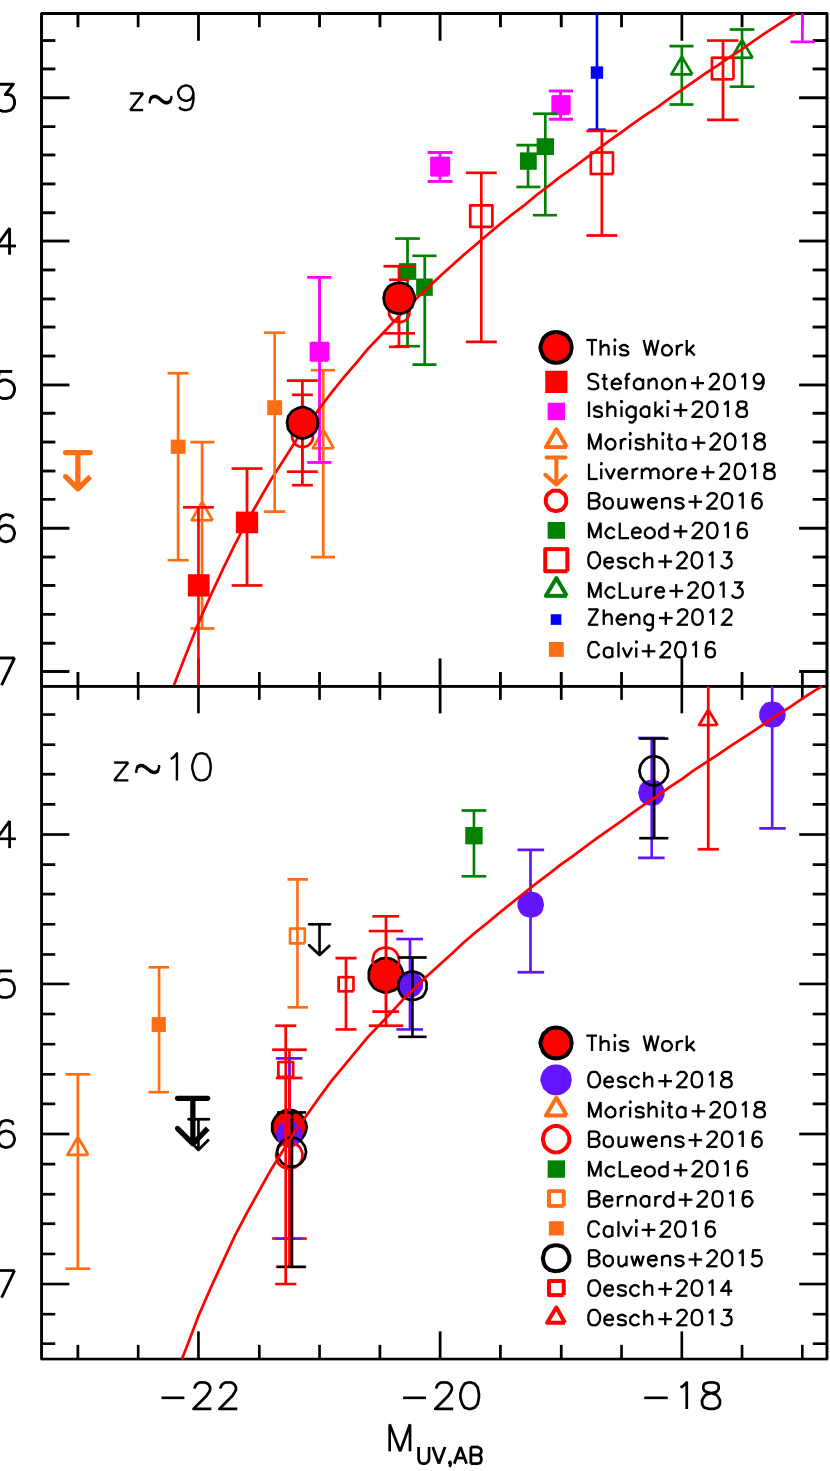
It is useful for us to compare our new and LF constraints from CANDELS with the substantial number of previous determinations of these LFs (Zheng et al. 2012; McLure et al. 2013; Oesch et al. 2013, 2014; Bouwens et al. 2014b, 2015, 2016; Calvi et al. 2016; McLeod et al. 2016; Bernard et al. 2016; Morishita al. 2018; Livermore et al. 2018; Stefanon et al. 2019). A comparison of our new results with earlier results is presented in Figure 8. Both the blank-field and the lensing field LF determinations from McLeod et al. (2016) are shown with the green squares.222For simplicity, only the NFW lensing results from McLeod et al. (2016) are presented from the CLASH (Postman et al. 2012) and HFF programs. The red lines in these figures show the and LF determinations from Bouwens et al. (2019, in prep) and Oesch et al. (2018), respectively. The Bouwens et al. (2019, in prep) LF determination leverages both the present search results and those from the Hubble Frontier Field parallels, the HUDF, HUDF09-1, and HUDF09-2.
As the figure illustrates, our results are in reasonable agreement with most previous studies at . More scatter is seen in results at . Relative to the Bouwens et al. (2016) LF determinations, we infer a higher volume density of bright galaxies. This is directly a consequence of the larger number of bright galaxies identified here (Figure 5). At , only the Ishigaki et al. (2018) -mag and 19 mag points lie significantly in excess of the median volume density trend defined by the many different determinations of the LF, i.e., by factors of 6 and 3.
At , there are significant differences between the volume density probes from pure parallel BoRG/HIPPIES observations, e.g., Calvi et al. (2015), Bernard et al. (2016), and Morishita et al. (2018), and those obtained from legacy fields like CANDELS, i.e., Bouwens et al. (2015, 2016) and Oesch et al. (2018). One concern with the candidates identified from the pure-parallel programs is contamination from lower redshift candidates. Not surprisingly, pure-parallel studies like Morishita et al. (2018) – who make use of Spitzer/IRAC data to eliminate lower-redshift contaminants from high-redshift samples – are more in line with results from fields like CANDELS where such multi-wavelength data are available to discriminate against such contaminants.
4.3. Field-to-Field Variations
Finally, with our new expanded sample of bright candidates over the CANDELS fields, we investigate possible field-to-field variations in the volume density of bright sources. We do so, by treating each CANDELS field as independent and using the observed sample from each field to derive the normalization of the LF.
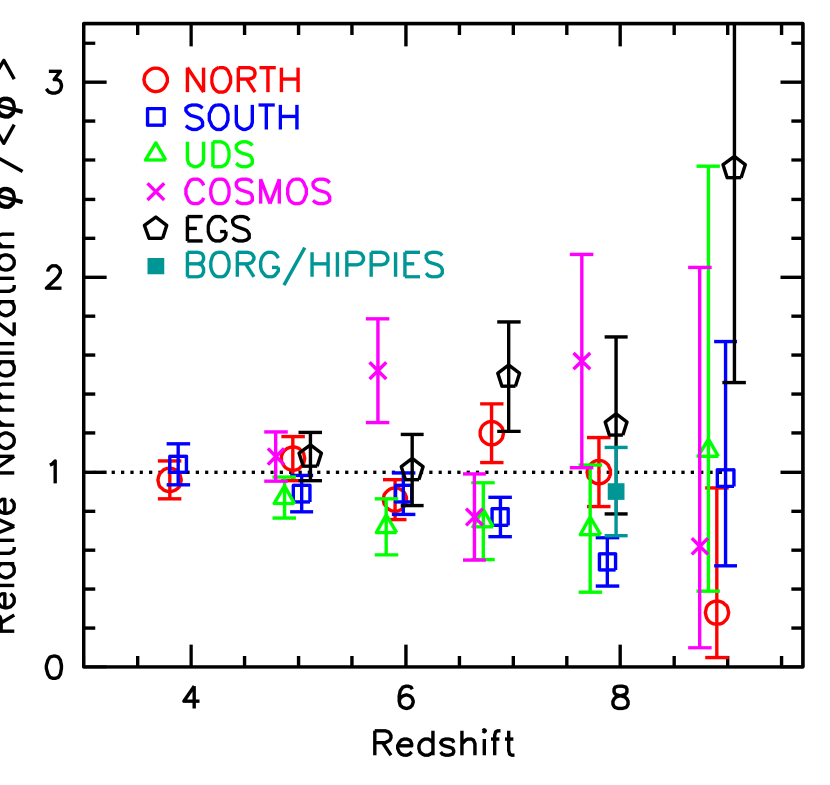
For our LF fits, we use the same formalism as described in §4.1, but instead using a Schechter function to create an equivalent binned LF in 0.1 mag intervals. For simplicity, we fix and to and , respectively, the values we derive in Bouwens et al. (2019, in prep) from a comprehensive analysis of the LF from to , including the HUDF, HUDF parallel fields, HFF parallel fields, the ERS fields, all five CANDELS fields, and 50 pure-parallel fields.
We determine the best-fit for each CANDELS field and then compute a relative normalization by comparing the normalization derived for a single CANDELS field with that derived in Bouwens et al. (2019, in prep) considering all CANDELS fields together. Each of the new candidates identified here are treated as 0.5 sources to account for the possibility that each may lie at (which is identical to our treatment of these candidates for our primary LF determinations [§4.1]). We also note that our calculation of the normalization factors for each field requires that we account for both the differing depths and areas of each CANDELS field (as increases in either quantify would increase the total expected number of sources).
The results are presented in Figure 9. Uncertainties are computed based on the Poissonian uncertainties given the small number of galaxies per CANDELS field. The relative normalizations found by Bouwens et al. (2015) for star-forming galaxies at -8 in each of the five CANDELS fields are also shown as a function of redshift.
It is interesting to compute the scatter in the relative normalization and compare it to what is expected from simple Poissonian variations. The RMS scatter in the relative normalizations is 0.67. If we create 105 realizations of the CANDELS fields according to the expected number of galaxies per CANDELS field (given their differing depths and areas), the median RMS scatter we compute is 0.56.
While the RMS scatter in the observations is larger than that seen for our median Monte-Carlo simulation, 30% of these simulations give an RMS scatter of similar size or larger than the observed value 0.67. As such, even models with no field-to-field variations are consistent with our observational results.
In summary, we have tried to quantify how the normalization of the LF varies from one CANDELS field to another. Unfortunately, the number of candidates per CANDELS field is not sufficiently large to determine this accurately with present data sets.
5. Summary
In this paper, we present new constraints on the bright end of the and LFs based on a search -10 candidate galaxies within a 883 arcmin2 area over the five CANDELS fields. The present search includes a 601 arcmin2 area over the CANDELS-WIDE UDS, COSMOS, and EGS fields.
The present selection expands on our previous selection of -10 galaxies over these same CANDELS fields (Bouwens et al. 2016) to include an additional 147 arcmin2 in search area. We were able to add to our overall selection area within CANDELS by considering those regions which, while having deep WFC3/IR data, did not have deep ACS optical data available from the CANDELS program.
The present selection also considered sources with a broader range of colors in our identification of -10 candidate galaxies than in our previous study. Full utilization of the Spitzer/IRAC observations from S-CANDELS (Ashby et al. 2016) and the ground-based optical and near-IR observations is made to refine our selection.
In total, we used the present larger search area to identify three new -10 candidate galaxies. None of these sources were present in our earlier Bouwens et al. (2015, 2016) catalogs or any other published catalogs in the literature. We also identified a fourth candidate with our inclusive selection criteria, which while not identified specifically in our -10 searches, was identified by Roberts-Borsani et al. (2016) using an IRAC [3.6][4.5]0.5 selection designed to pick out bright galaxies at , and which has already been spectroscopically confirmed to lie at (Zitrin et al. 2015).
In creating our expanded samples, we also make use of additional follow-up observations obtained with HST in the -band (GO 14459: Bouwens 2015) of two bright (), candidate galaxies identified over the CANDELS fields (Appendix A). These candidates had bluer colors than the 0.5 mag limit we had previously considered. While one candidate is not confirmed to have a redshift of , being well detected in the HST -band data, the other candidate is confirmed to lie at , but with a redshift of 8.3 – too low for inclusion in our selection.
Adding our newly identified candidates to our previous samples (from Bouwens et al. 2016), we identify a total sample of 14 bright galaxy candidates over a 883 arcmin2 area in CANDELS. 5 candidate -11 galaxies are found in the same area in CANDELS. This is equivalent to identifying 1 -11 candidate per 47 arcmin2 (10 WFC3/IR fields). Interestingly, our expanded selection of galaxies has luminosities which are generally brighter (by 0.1 to 0.4 mag) than in our previous selection of galaxies (compiled in Bouwens et al. 2016).
In addition to the 19 candidate -10 galaxies we identify over CANDELS that make up our main selection, we also identify 28 mostly lower likelihood candidates (Appendix B). During this process, we consider sources selected from the HST + Spitzer/IRAC 3.6m+4.5m data alone in case confusion in the ground-based results in some incompleteness. While a few of those candidates appear to be reliable based on those data, addition of the ground-based constraints show that many are much more likely to be at (see Figure 6 and 11 from Appendix B). In Appendix C, Keck observations are used to improve our constraints on the nature of a candidate examined in Appendix B. The entire discussion provided in the Appendices is useful in illustrating the challenges present in selecting a high-quality sample of galaxies based on current data sets.
We use this expanded selection of -10 candidate galaxies to refine our determinstion of the high-luminosity end of the LF at and . Our revised determinations show a higher volume density of bright () galaxies than found by Bouwens et al. (2016). This owes to the increased fraction of bright () galaxies identified in the new area we probe (Figure 5).
By comparing the number of bright galaxies identified with the number expected, we attempted to estimate the relative volume density of galaxies per CANDELS field. The RMS variation we found was in excess of that expected from Poissonian statistics. Nevertheless, we found that the observed scatter was not especially significant and we could reproduce it, adopting simple Poissonian statistics, in as many as 30% of our Monte-Carlo trials. To quantify this better, clearly deeper observations are required over all 5 CANDELS fields to identify a larger number of galaxies.
With our new results, we confirm the strong evolution seen in the LF at in previous work (Oesch et al. 2012, 2014; Bouwens et al. 2015, 2016; Oesch et al. 2018), with a factor of 10 evolution from to . The present results are broadly consistent with the “accelerated” evolution scenario suggested by Oesch et al. (2012).
Better constraints on the volume density of bright galaxies could be obtained by continuing our exploitation of wide-area VISTA surveys as have been conducted by Bowler et al. (2014), Stefanon et al. (2017), and Stefanon et al. (2019), by surveying much wider area fields to faint magnitudes with HST, by improving our exploitation of the archival and pure parallel HST + Spitzer/IRAC data (e.g., Morishita et al. 2018), and in the future with JWST, Euclid, and WFIRST.
References
- Aihara et al. (2018) Aihara, H., Arimoto, N., Armstrong, R., et al. 2018a, PASJ, 70, S4
- Aihara et al. (2018) Aihara, H., Armstrong, R., Bickerton, S., et al. 2018b, PASJ, 70, S8
- Anders & Fritze-v. Alvensleben (2003) Anders, P., & Fritze-v. Alvensleben, U. 2003, A&A, 401, 1063
- Ashby et al. (2013) Ashby, M. L. N., Willner, S. P., Fazio, G. G., et al. 2013, ApJ, 769, 80
- Ashby et al. (2015) Ashby, M. L. N., Willner, S. P., Fazio, G. G., et al. 2015, ApJS, 218, 33
- Bernard et al. (2016) Bernard, S. R., Carrasco, D., Trenti, M., et al. 2016, ApJ, 827, 76
- Bertin and Arnouts (1996) Bertin, E. and Arnouts, S. 1996, A&AS, 117, 39
- Bielby et al. (2012) Bielby, R., Hudelot, P., McCracken, H. J., et al. 2012, A&A, 545, AA23
- Bouwens, Broadhurst and Silk (1998) Bouwens, R., Broadhurst, T. and Silk, J. 1998, ApJ, 506, 557
- Bouwens et al. (2003) Bouwens, R., Broadhurst, T., & Illingworth, G. 2003a, ApJ, 593, 640
- Bouwens et al. (2007) Bouwens, R. J., Illingworth, G. D., Franx, M., & Ford, H. 2007, ApJ, 670, 928
- Bouwens et al. (2008) Bouwens, R. J., Illingworth, G. D., Franx, M., & Ford, H. 2008, ApJ, 686, 230
- Bouwens et al. (2010) Bouwens, R. J., Illingworth, G. D., Oesch, P. A., et al. 2010, ApJ, 709, L133
- Bouwens et al. (2011) Bouwens, R. J., Illingworth, G. D., Labbe, I., et al. 2011, Nature, 469, 504
- Bouwens et al. (2012) Bouwens, R. J., Illingworth, G. D., Oesch, P. A., et al. 2012, ApJ, 754, 83
- Bouwens (2014) Bouwens, R. 2014, HST Proposal, 13792
- Bouwens et al. (2014) Bouwens, R. J., Illingworth, G. D., Oesch, P. A., et al. 2014a, ApJ, 793, 115
- Bouwens et al. (2014) Bouwens, R. J., Bradley, L., Zitrin, A., et al. 2014b, ApJ, 795, 126
- Bouwens et al. (2015) Bouwens, R. J., Illingworth, G. D., Oesch, P. A., et al. 2015, ApJ, 803, 34
- Bouwens (2015) Bouwens, R. 2015, HST Proposal, 14459
- Bouwens et al. (2016) Bouwens, R. J., Oesch, P. A., Labbé, I., et al. 2016, ApJ, 830, 67
- Bouwens et al. (2017) Bouwens, R. J., Oesch, P. A., Illingworth, G. D., Ellis, R. S., & Stefanon, M. 2017, ApJ, 843, 129
- Bowler et al. (2014) Bowler, R. A. A., Dunlop, J. S., McLure, R. J., et al. 2014, MNRAS, 440, 2810
- Bowler et al. (2017) Bowler, R. A. A., Dunlop, J. S., McLure, R. J., & McLeod, D. J. 2017, MNRAS, 466, 3612
- Brammer et al. (2008) Brammer, G. B., van Dokkum, P. G., & Coppi, P. 2008, ApJ, 686, 1503
- Calvi et al. (2016) Calvi, V., Trenti, M., Stiavelli, M., et al. 2016, ApJ, 817, 120
- Capak et al. (2007) Capak, P., Aussel, H., Ajiki, M., et al. 2007, ApJS, 172, 99
- Castellano et al. (2012) Castellano, M., Fontana, A., Grazian, A., et al. 2012, A&A, 540, A39
- Coe et al. (2013) Coe, D., Zitrin, A., Carrasco, M., et al. 2013, ApJ, 762, 32
- Dressel et al. (2012) Dressel, L., et al. 2012. Wide Field Camera 3 Instrument Handbook, Version 5.0 (Baltimore: STScI)
- Ellis et al. (2013) Ellis, R. S., McLure, R. J., Dunlop, J. S., et al. 2013, ApJ, 763, L7
- Finkelstein et al. (2012) Finkelstein, S. L., Papovich, C., Salmon, B., et al. 2012, ApJ, 756, 164
- Furusawa et al. (2008) Furusawa, H., Kosugi, G., Akiyama, M., et al. 2008, ApJS, 176, 1
- Grogin et al. (2011) Grogin, N. A., Kocevski, D. D., Faber, S. M., et al. 2011, ApJS, 197, 35
- Hashimoto et al. (2018) Hashimoto, T., Laporte, N., Mawatari, K., et al. 2018, Nature, 557, 392
- Holwerda et al. (2015) Holwerda, B. W., Bouwens, R., Oesch, P., et al. 2015, ApJ, 808, 6
- Ishigaki et al. (2018) Ishigaki, M., Kawamata, R., Ouchi, M., et al. 2018, ApJ, 854, 73
- Koekemoer et al. (2007) Koekemoer, A. M., Aussel, H., Calzetti, D., et al. 2007, ApJS, 172, 196
- Koekemoer et al. (2011) Koekemoer, A. M., Faber, S. M., Ferguson, H. C., et al. 2011, ApJS, 197, 36
- Kotulla et al. (2009) Kotulla, R., Fritze, U., Weilbacher, P., & Anders, P. 2009, MNRAS, 396, 462
- Kron (1980) Kron, R. G. 1980, ApJS, 43, 305
- Labbé et al. (2010) Labbé, I., González, V., Bouwens, R. J., et al. 2010a, ApJ, 708, L26
- Labbé et al. (2010) Labbé, I., González, V., Bouwens, R. J., et al. 2010b, ApJ, 716, L103
- Labbé et al. (2013) Labbé, I., Oesch, P. A., Bouwens, R. J., et al. 2013, ApJ, 777, L19
- Labbé et al. (2015) Labbé, I., Oesch, P. A., Illingworth, G.D., et al. 2015, ApJS, 221, 23
- Lam et al. (2019) Lam, D., Bouwens, R. J., Coe, D., et al. 2019, ApJ, submitted, arXiv:1903.08177
- Laporte et al. (2017) Laporte, N., Nakajima, K., Ellis, R. S., et al. 2017, ApJ, 851, 40
- Livermore et al. (2018) Livermore, R. C., Trenti, M., Bradley, L. D., et al. 2018, ApJ, 861, L17
- Magee et al. (2011) Magee, D. K., Bouwens, R. J., & Illingworth, G. D. 2011, Astronomical Data Analysis Software and Systems XX, 442, 395
- Mainali et al. (2017) Mainali, R., Kollmeier, J. A., Stark, D. P., et al. 2017, ApJ, 836, L14
- Mainali et al. (2018) Mainali, R., Zitrin, A., Stark, D. P., et al. 2018, MNRAS, 479, 1180
- McCracken et al. (2010) McCracken, H. J., Capak, P., Salvato, M., et al. 2010, ApJ, 708, 202
- McCracken et al. (2012) McCracken, H. J., Milvang-Jensen, B., Dunlop, J., et al. 2012, A&A, 544, A156
- McLean et al. (2012) McLean, I. S., Steidel, C. C., Epps, H. W., et al. 2012, Proc. SPIE, 8446, 84460J
- McLeod et al. (2015) McLeod, D. J., McLure, R. J., Dunlop, J. S., et al. 2015, MNRAS, 450, 3032
- McLeod et al. (2016) McLeod, D. J., McLure, R. J., & Dunlop, J. S. 2016, MNRAS, 459, 3812
- McLure et al. (2013) McLure, R. J., Dunlop, J. S., Bowler, R. A. A., et al. 2013, MNRAS, 432, 2696
- Morishita et al. (2018) Morishita, T., Trenti, M., Stiavelli, M., et al. 2018, ApJ, 867, 150
- Mutch et al. (2016) Mutch, S. J., Liu, C., Poole, G. B., et al. 2016, MNRAS, 463, 3556
- Nanayakkara et al. (2016) Nanayakkara, T., Glazebrook, K., Kacprzak, G. G., et al. 2016, ApJ, 828, 21
- Oesch et al. (2012) Oesch, P. A., Bouwens, R. J., Illingworth, G. D., et al. 2012a, ApJ, 745, 110
- Oesch et al. (2013) Oesch, P. A., Bouwens, R. J., Illingworth, G. D., et al. 2013, ApJ, 773, 75
- Oesch et al. (2014) Oesch, P. A., Bouwens, R. J., Illingworth, G. D., et al. 2014, ApJ, 786, 108
- Oesch et al. (2016) Oesch, P. A., Brammer, G., van Dokkum, P. G., et al. 2016, ApJ, 819, 129
- Oesch et al. (2018) Oesch, P. A., Bouwens, R. J., Illingworth, G. D., Labbé, I., & Stefanon, M. 2018, ApJ, 855, 105
- Oke & Gunn (1983) Oke, J. B., & Gunn, J. E. 1983, ApJ, 266, 713
- Ono et al. (2013) Ono, Y., Ouchi, M., Curtis-Lake, E., et al. 2013, ApJ, 777, 155
- Postman et al. (2012) Postman, M., Coe, D., Benítez, N., et al. 2012, ApJS, 199, 25
- Roberts-Borsani et al. (2016) Roberts-Borsani, G. W., Bouwens, R. J., Oesch, P. A., et al. 2016, ApJ, 823, 143
- Rogers et al. (2014) Rogers, A. B., McLure, R. J., Dunlop, J. S., et al. 2014, MNRAS, 440, 3714
- Schmidt et al. (2017) Schmidt, K. B., Huang, K.-H., Treu, T., et al. 2017, ApJ, 839, 17
- Scoville et al. (2007) Scoville, N., Abraham, R. G., Aussel, H., et al. 2007, ApJS, 172, 38
- Shibuya et al. (2015) Shibuya, T., Ouchi, M., & Harikane, Y. 2015, ApJS, 219, 15
- Smit et al. (2018) Smit, R., Bouwens, R. J., Carniani, S., et al. 2018, Nature, 553, 178
- Stark et al. (2010) Stark, D. P., Ellis, R. S., Chiu, K., Ouchi, M., & Bunker, A. 2010, MNRAS, 408, 1628
- Stark et al. (2015) Stark, D. P., Walth, G., Charlot, S., et al. 2015, MNRAS, 454, 1393
- Stefanon et al. (2017) Stefanon, M., Labbé, I., Bouwens, R. J., et al. 2017, ApJ, 851, 43
- Stefanon et al. (2019) Stefanon, M., Labbé, I., Bouwens, R. J., et al. 2019, ApJ, submitted, arXiv:1902.10713
- Steidel et al. (1996) Steidel, C. C., Giavalisco, M., Pettini, M., Dickinson, M., & Adelberger, K. L. 1996, ApJ, 462, L17
- Steidel et al. (2003) Steidel, C. C., Adelberger, K. L., Shapley, A. E., et al. 2003, ApJ, 592, 728
- Straatman et al. (2016) Straatman, C. M. S., Spitler, L. R., Quadri, R. F., et al. 2016, ApJ, 830, 51
- Trenti et al. (2011) Trenti, M., Bradley, L. D., Stiavelli, M., et al. 2011, ApJ, 727, L39
- Vanzella et al. (2009) Vanzella, E., Giavalisco, M., Dickinson, M., et al. 2009, ApJ, 695, 1163
- Waters et al. (2016) Waters, D., Di Matteo, T., Feng, Y., Wilkins, S. M., & Croft, R. A. C. 2016, MNRAS, 463, 3520
- Watson et al. (2015) Watson, D., Christensen, L., Knudsen, K. K., et al. 2015, Nature, 519, 327
- Willott et al. (2013) Willott, C. J., McLure, R. J., Hibon, P., et al. 2013, AJ, 145, 4
- Wilkins et al. (2016) Wilkins, S. M., Bouwens, R. J., Oesch, P. A., et al. 2016, MNRAS, 455, 659
- Windhorst et al. (2011) Windhorst, R. A., Cohen, S. H., Hathi, N. P., et al. 2011, ApJS, 193, 27
- Yan et al. (2011) Yan, H., Yan, L., Zamojski, M. A., et al. 2011, ApJ, 728, L22
- Zheng et al. (2012) Zheng, W., Postman, M., Zitrin, A., et al. 2012, Nature, 489, 406
- Zitrin et al. (2014) Zitrin, A., Zheng, W., Broadhurst, T., et al. 2014, ApJ, 793, L12
- Zitrin et al. (2015) Zitrin, A., Labbé, I., Belli, S., et al. 2015, ApJ, 810, L12
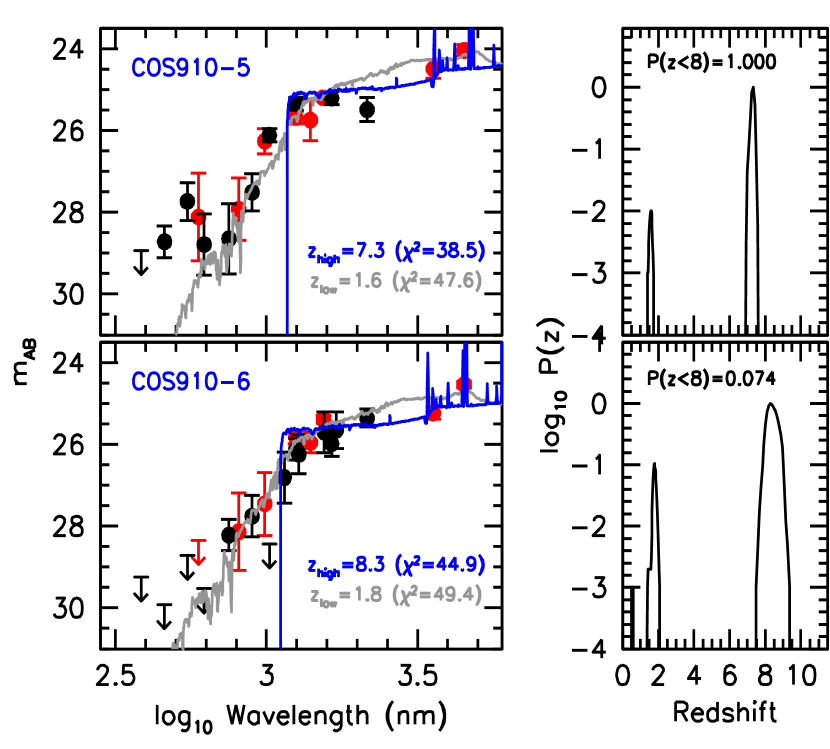
Appendix A A. Nature of Two Candidate Galaxies Targeted by HST Follow-up Program 14459
Here we present constraints on the spectral energy distributions and redshift likelihood distribution we derived for the two candidate galaxies we targeted with an HST follow-up program in cycle 23 (GO 14459: Bouwens 2015). The sources were selected for follow-up based on their exceptional brightness () and 50% probability of lying at (relying on our earlier photometry). Constraints on the redshifts of the targeted candidates were derived based on the same HST+Spitzer/IRAC+ground-based observations as utilized by Bouwens et al. (2016). We designate them COS910-5 and COS910-6, and they have coordinates of 10:00:31.39, 02:26:39.8 and 10:00:20.12, 02:14:13.0, respectively. These candidates had magnitudes of 25.1 mag and 25.3 mag, respectively. The colors of both sources were bluer than the 0.5 mag limit we had earlier used in selecting sources for follow-up (Bouwens et al. 2016).
| ID | R.A. | Dec | P() | P() | ||
|---|---|---|---|---|---|---|
| COS910-6 | 10:00:20.12 | 2:14:13.0 | 25.3 0.1 | 8.3 | 0.87ccSee Figure 10 and Appendix A. | 0.98 |
| EGS910-11 | 14:19:59.71 | 52:51:19.5 | 26.4 0.2 | 8.4 | 0.55 | 0.93 |
| EGS910-12 | 14:20:19.08 | 53:03:14.3 | 25.9 0.1 | 8.1 | 0.50 | 0.90 |
| HST+IRAC+GroundccIn computing the photometric solution for the 12 lowest sources in the table, we downweighted the optical photometric constraints somewhat, by multiplying their uncertainties by a factor of 2. This was done to allow for imperfect subtraction of the optical flux from sources neighboring the indicated sources and also not to overly select against sources that show occasional 2 detections in the optical. | HST+IRAC [3.6]/[4.5] | ||||||||
|---|---|---|---|---|---|---|---|---|---|
| ID | R.A. | Dec | P() | P() | P() | P() | |||
| From Appendix C and Table 7 of Bouwens et al. (2016) | |||||||||
| UDS910-2 | 02:17:13.08 | 05:15:55.4 | 26.60.2 | 10.2 | 0.68 | 0.91 | — | — | — |
| UDS910-3 | 02:17:52.38 | 05:15:06.3 | 26.90.2 | 9.4 | 0.28 | 0.60 | — | — | — |
| UDS910-4 | 02:17:14.61 | 05:15:15.7 | 26.60.2 | 9.1 | 0.50 | 0.70 | — | — | — |
| Candidates where P() 0.5 | |||||||||
| COS910-7 | 10:00:26.15 | 02:32:49.8 | 25.60.1 | 7.4 | 0.31 | 1.00 | — | — | — |
| UDS910-5 | 02:18:20.45 | 05:14:07.9 | 25.90.2 | 8.8 | 0.46 | 0.70 | — | — | — |
| EGS910-13 | 14:20:45.23 | 53:02:01.4 | 25.90.1 | 8.5 | 0.40 | 0.95 | — | — | — |
| EGS910-14 | 14:20:05.09 | 52:58:02.6 | 25.70.1 | 8.3 | 0.38 | 0.77 | — | — | — |
| EGS910-15 | 14:19:52.22 | 52:55:58.8 | 26.10.1 | 8.3 | 0.38 | 0.83 | — | — | — |
| EGS910-16ddSource has a very red color of 1.9 mag. Given what has been found for other sources (Figure 12), it seems very likely that this source is at . | 14:20:47.81 | 53:02:11.8 | 25.60.1 | 8.6 | 0.15 | 0.23 | — | — | — |
| Candidates Found Downweighting Constraints from the Ground-Based Photometry$\dagger$$\dagger$Source selected if formal uncertainties on the ground-based flux measurements is increased by a factor of 10. Because of the proximity of some HST-detected sources to nearby neighbors, obtaining accurate flux measurements for some sources is challenging. This can result in some bona-fide -10 galaxies being missed, when utilizing the ground-based photometry to determine the likely redshift of a source. – Some Foreground ConfusioneeSources where subtraction of neighboring sources impacts the ground-based optical flux measurements by more than in some bands. | |||||||||
| COS910-8**This source is detected at in our ground-based FourStar photometry of ZFOURGE (Straatman et al. 2016: see Figure 11). As a result of this and the overall shape of the SED as defined by the existing observations in the , , [3.6], [4.5], [5.8], and [8.0] bands, this source seems very unlikely to be at . | 10:00:34.99 | 02:14:01.1 | 24.50.1 | 2.1 | 0.00**This source is detected at in our ground-based FourStar photometry of ZFOURGE (Straatman et al. 2016: see Figure 11). As a result of this and the overall shape of the SED as defined by the existing observations in the , , [3.6], [4.5], [5.8], and [8.0] bands, this source seems very unlikely to be at . | 0.00**This source is detected at in our ground-based FourStar photometry of ZFOURGE (Straatman et al. 2016: see Figure 11). As a result of this and the overall shape of the SED as defined by the existing observations in the , , [3.6], [4.5], [5.8], and [8.0] bands, this source seems very unlikely to be at . | 9.4 | 0.90 | 0.90 |
| COS910-9****This source is detected at in our -band ground-based photometry | 10:00:43.84 | 02:13:50.4 | 25.60.1 | 1.8 | 0.03 | 0.03 | 9.2 | 0.63 | 0.66 |
| COS910-10ffGround-based photometry is substantially impacted by a bright nearby neighbor, with subtracted flux from our photometric apertures (1.2′′-diameter) 15-20 greater than the noise in many bands. As such, deriving accurate photometry for this source is very challenging. In any case, this source seems consistent with being a dusty source given that its color is 1.95 mag (see Figure 12). | 10:00:24.22 | 02:17:56.5 | 24.40.1 | —ffGround-based photometry is substantially impacted by a bright nearby neighbor, with subtracted flux from our photometric apertures (1.2′′-diameter) 15-20 greater than the noise in many bands. As such, deriving accurate photometry for this source is very challenging. In any case, this source seems consistent with being a dusty source given that its color is 1.95 mag (see Figure 12). | — | — | 9.2 | 0.55 | 0.55 |
| UDS910-6******This source is detected at in our -band ground-based photometry | 02:18:00.63 | 05:14:43.2 | 25.70.1 | 3.7 | 0.00 | 0.00 | 8.9 | 0.76 | 0.93 |
| UDS910-7$\ddagger$$\ddagger$This source is detected at 1.9 and in the and bands in our photometry. | 02:17:13.13 | 05:13:01.6 | 24.80.1 | 0.6 | 0.00 | 0.00 | 9.2 | 0.61 | 0.62 |
| UDS910-8 | 02:17:25.62 | 05:09:38.8 | 26.10.3 | 9.5 | 0.31 | 0.47 | 9.1 | 0.56 | 0.77 |
| UDS910-9 | 02:17:39.67 | 05:14:10.8 | 25.60.1 | 2.4 | 0.38 | 0.38 | 9.3 | 0.43 | 0.46 |
| EGS910-17 | 14:20:24.88 | 53:02:35.0 | 26.50.1 | 9.2 | 0.55 | 0.73 | 9.2 | 0.60 | 0.78 |
| EGS910-18 | 14:20:38.81 | 53:03:58.1 | 26.30.2 | 1.6 | 0.21 | 0.27 | 8.6 | 0.39 | 0.63 |
| Candidates Found Downweighting Constraints from the Ground-Based Photometry$\dagger$$\dagger$Source selected if formal uncertainties on the ground-based flux measurements is increased by a factor of 10. Because of the proximity of some HST-detected sources to nearby neighbors, obtaining accurate flux measurements for some sources is challenging. This can result in some bona-fide -10 galaxies being missed, when utilizing the ground-based photometry to determine the likely redshift of a source. – Minimal Foreground ConfusionggSources where subtraction of neighboring sources impacts the ground-based optical flux measurements by less than in all bands. | |||||||||
| COS910-11********This source shows a detection at m combining the , and band imaging data. | 10:00:14.78 | 02:18:09.6 | 26.20.1 | 1.6 | 0.02 | 0.15 | 9.0 | 0.40 | 0.45 |
| COS910-12 | 10:00:24.18 | 02:26:57.2 | 25.60.2 | 8.6 | 0.52 | 0.63 | 8.6 | 0.43 | 0.65 |
| UDS910-10****This source is detected at in our -band ground-based photometry | 02:17:38.84 | 05:15:29.6 | 26.10.1 | 1.4 | 0.00 | 0.26 | 9.4 | 0.57 | 0.60 |
| UDS910-11 | 02:17:07.36 | 05:11:49.0 | 26.30.1 | 9.0 | 0.50 | 0.54 | 8.8 | 0.34 | 0.45 |
| UDS910-12******This source is detected at in our -band ground-based photometry | 02:17:01.03 | 05:11:00.4 | 24.20.1 | 2.3 | 0.01 | 0.01 | 9.2 | 0.61 | 0.61 |
| UDS910-13**********This source is detected at in the ground-based FourStar -band data from ZFOURGE. Clearly, this source is not likely to be at . | 02:17:01.36 | 05:09:59.6 | 25.30.1 | 2.3 | 0.00**********This source is detected at in the ground-based FourStar -band data from ZFOURGE. Clearly, this source is not likely to be at . | 0.00**********This source is detected at in the ground-based FourStar -band data from ZFOURGE. Clearly, this source is not likely to be at . | 9.7 | 0.68 | 0.68 |
| UDS910-14 | 02:17:49.19 | 05:15:16.7 | 26.90.2 | 9.5 | 0.68 | 0.73 | 9.5 | 0.27 | 0.29 |
| Band | Measured Flux (nJy) |
|---|---|
| CFHTLS | |
| SSC | |
| HSC | |
| CFHTLS | |
| SSC | |
| HST | |
| HSC | |
| CFHTLS | |
| SSC | |
| SSC | |
| CFHTLS | |
| CFHTLS | |
| HSC | |
| HST | |
| CFHTLS | |
| HSC | |
| SSC | |
| HSC | |
| UVISTA | |
| ZFOURGE | |
| ZFOURGE | $\dagger$$\dagger$No signal is expected in the FourStar band from ZFOURGE (which runs from 1.07m to 1.22m) if COS910-8 is a source. Nonetheless, COS910-8 shows a 3.3 detection in the band in our photometry (see second leftmost panel in Figure 11). |
| HST | |
| UVISTA | |
| ZFOURGE | |
| HST | $\ddagger$$\ddagger$The -band flux we estimate correcting flux measurements made in 0.4′′-diameter apertures to total is 46929 nJy. |
| HST | |
| ZFOURGE | |
| UVISTA | |
| ZFOURGE | |
| ZFOURGE | |
| UVISTA | |
| IRAC m | |
| IRAC m | |
| IRAC m | **A detection of COS910-8 would be expected at both 5.8m and 8.0m, if it was a galaxy. By contrast, if the source is instead at , no detection is expected in either band due to a turn-over in the SED at 1.6m rest-frame. COS910-8 is not detected in either channel. |
| IRAC m | **A detection of COS910-8 would be expected at both 5.8m and 8.0m, if it was a galaxy. By contrast, if the source is instead at , no detection is expected in either band due to a turn-over in the SED at 1.6m rest-frame. COS910-8 is not detected in either channel. |
As both of the targetted candidates were found over the CANDELS COSMOS field, we made use of the same imaging data sets and photometry as we used in selecting them. In addition to those photometric constraints, we also made use of the imaging observations associated with Hyper Suprime-Cam (HSC) Ultra-Deep survey (DR1: Aihara et al. 2018a,b). The photometric redshift software EAZY (Brammer et al. 2008) is applied to the full set of flux measurements we have for the candidates to quantify the redshift likelihood distribution. The best-fit high () and low-redshift () SEDs for the sources are shown in Figure 10 with the blue and gray lines, respectively. The best-fit redshifts we derive for COS910-5 and COS910-6 are 7.3 and 8.3, respectively, with and . Our first candidate COS910-5 is plausibly a lower redshift () galaxy based on its photometry, while the photometry of COS910-6 securely places it at .
Appendix B B. Other Potential -10 Candidates
In addition to the high-likelihood candidate -10 galaxies presented in the body of this manuscript, we also identified other sources which also plausibly correspond to -10 galaxies. However, because the integrated probability of these sources lying in excess of 8.0 was below 50% or because their maximum likelihood redshift was below 8.4, we excluded them from our primary sample.
In an effort to be comprehensive, we include in our compilation even bright sources which showed at least a 20% probability of lying at . We furthermore relaxed the mag criterion used for our main selection to include sources redder than 1.4 mag, but as we discuss in Appendix B.2 and illustrate in Figure 12, this does not appear to add any probable -10 candidates.
Table 4 provides a list of sources where the best estimate redshift is between 8.0 and 8.4, with a 50% probability of lying at . Table 5 features a list of sources where there is a 20% probability of lying at .
For completeness, we have also included in this table sources which were previously listed in Table 7 and Appendix C of Bouwens et al. (2016).
B.1. B.1 Possible -10 Candidates Identified By Down-Weighting the Ground-Based Data
A fraction of the sources (30%) found in the HST data are very close by other sources in the ground-based imaging observations. While our photometric software mophongo copes with source overlap (subtracting flux from nearby neighbors before doing photometry), subtractions are not perfect in all cases and this can cause some fraction of bona-fide high-redshift sources to be missed due e.g. to imperfectly subtracted optical flux from neighboring sources. Based on the selection volume simulations run in §4.1, we estimate this incompleteness to be 30%.
Given these incompleteness levels in HST+Spitzer+ground-based -10 selections, we repeated our -10 galaxy searches using the same procedure as in the main text but increasing the uncertainties on the ground-based data by a factor of 10 (and hence significantly downweighting those data). Those candidates are included in Table 5 along with their best-fit redshifts and integrated probabilities of lying at and . For comparison, we include in the same table the maximum likelihood redshifts and the integrated probabilities of sources lying at and when including all the data in the middle columns. This is to show the impact of incorporating the photometric constraints available from the ground-based , , , , , , , , and band observations. The optical photometric constraints are also included in the results presented in the middle column, but the photometric uncertainties there are multiplied by a factor of 2 to allow for the possibility of imperfectly subtracted neighbors. Sources with best-fit redshifts and where the integrated probability at is 20% are also included in Table 5.
B.2. B.2 Case of Candidate COS910-8
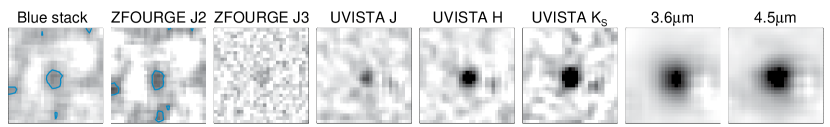
There are a few sources in Table 5 which seem like reliable -10 candidate galaxies when using only the HST+Spitzer/IRAC 3.6m+4.5m observations, but which clearly prefer a solution when including the constraints from the ground-based photometry. In Figure 6 from the main text, we showed one example of this type of source which prefer a solution using the HST+3.6m+4.5m observations alone. Because of the brightness of that source and to ensure that we were not deriving a low-redshift solution due to imperfect subtraction of a bright nearby source, we took unusual care in subtracting a bright neighboring source before performing our flux measurements (1.2′′-diameter apertures). Postage stamp images of this source, after subtraction of a neighboring source, are shown in Figure 11. The leftmost image in this panel show a weighted stack of all the data from the -band to the FourStar J2 band, weighted according to expected contribution in each band if the source were a galaxy.
Particularly concerning for COS910-8 being a source is the apparent detection of this source at in the FourStar J2 band at the position of the source, tentative detections of the source in the , , and bands (146 nJy, 2414 nJy, and 2721 nJy, respectively), and the overall SED shape as defined by the available , , [3.6], [4.5], [5.8], and [8.0]-band photometry. In particular, the measured -band flux from both UltraVISTA and FourStar/ZFOURGE lie in excess of expectations if the source is at , while our 5.8m and 8.0m flux constraints lie below expectations if the source is at . Including the photometric constraints from all HST, Spitzer, and ground-based data (Table 6), we estimate that the source has a 210-6 probability of lying at . If slightly larger photometric uncertainties are assumed in all bands (as needed to derive a reduced of 1), the integrated likelihood that the source is at is 210-4.
Consistent with our interpretation that COS910-8 is much more likely a galaxy than a galaxy, we find no significant line emission () in the Keck observations we obtained of COS910-8 in the band at 1.6m which probe Civ 1548,1550, Heii, and Oiii] 1663. Line emission should be detected at 5 in our observations if the EW of any of these lines was in excess of 10Å, as has already reported in a and galaxy by Schmidt et al. (2017) and Stark et al. (2015).
Besides COS910-8, there are 7 other candidates in Table 5, which strongly prefer a low-redshift solution after incorporating the constraints from ground-based observations, mostly as a result of a detection in a band just blueward of m, i.e., Y, J1, or J2. Given the impact of the optical data on the computed ’s, clearly it is essential to carefully examine the ground-based optical and near-IR observations when selecting the best galaxies for further follow-up observations.
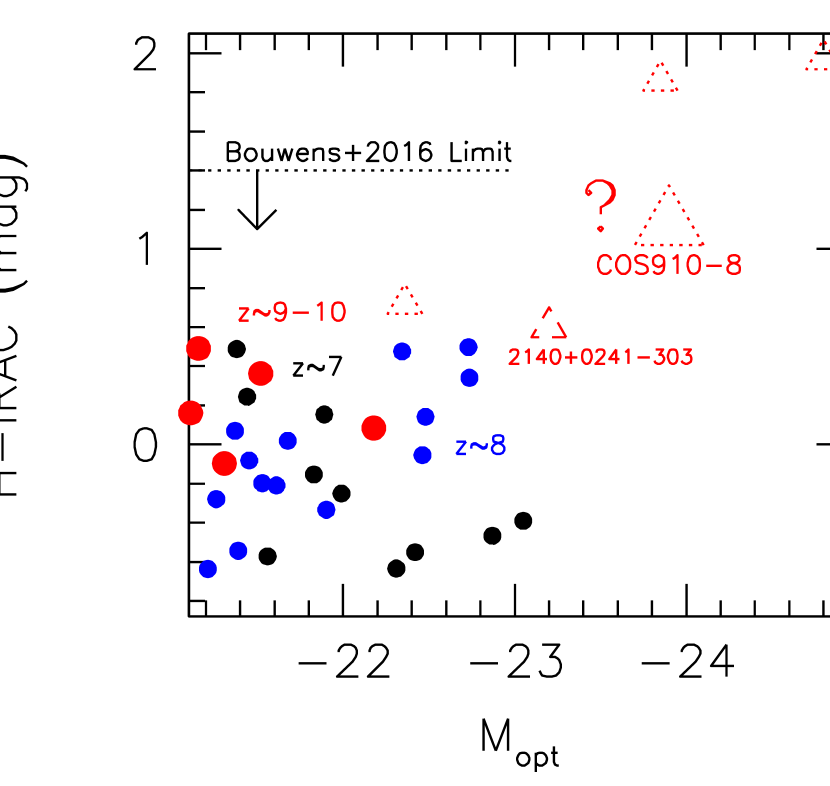
Even without a detailed consideration of a vast array of ground-based observations to determine the nature of COS910-8 and a number of similar sources within CANDELS, it is clear that we might have expected most of these sources to correspond to galaxies given the very high implied luminosities and red IRAC colors (treating them as candidates). To illustrate how extreme e.g. COS910-8 would be as a candidate, we present its optical luminosity and [3.6] color (assuming a redshift: red open dotted triangle) relative to the and -9 samples identified by Bowler et al. (2017) and Stefanon et al. (2019) over 1.5 deg2 in Figure 12. The optical luminosities and -IRAC colors from the Bowler et al. (2017) and Stefanon et al. (2019) selections only rely on IRAC bands not impacted by the [OIII] or H nebular emission lines and hence only rely on sources at . As such, the luminosities are computed from the IRAC 4.5m band for photometric candidates identified in the redshift range -6.95 and from the IRAC 3.6m band for sources at redshifts .
Given the larger area of the Bowler et al. (2017) and Stefanon et al. (2019) searches relative to the current CANDELS probes and given that bright, red sources are presumably more common at -8 than at -10, it would seem odd to find more extreme sources in a -10 search over CANDELS than in the aforementioned lower-redshift, wider-area probes, and it therefore seems probable that most of the extreme candidates over CANDELS are actually at .
Also shown in Figure 12 are the luminosities and colors of the -10 galaxies in the Oesch et al. (2014), Bouwens et al. (2016), and Morishita et al. (2018) selections and the implied luminosities and colors for the other candidates from Table 5 (red open dotted triangles) that our ground-based photometry largely rule out. The red IRAC color selection limit used by Bouwens et al. (2016) for preselecting their -10 samples is shown in Figure 12, and it is clear that such a selection would easily include all extreme -10 sources identified by Bowler et al. (2017), Stefanon et al. (2019), and Oesch et al. (2014).
The purpose of the entire discussion here is to illustrate the challenges present in selecting high-quality samples based on current data sets and how important accurate photometry is.
B.3. B.3 Possible Impact of these -10 Candidates on Our LF Estimates?
If we add up the fractional probability that the 28 sources presented in Table 5 and 4 are at , i.e., , at face value this suggests that 8.67 of the presented candidates are at . As this constitutes of a non-negligible fraction of the 19 candidates presented in Table 2, one might wonder whether the presented candidates in Appendix A and B would have an impact on the LF if they were indeed at -10.
As we argue below, the answer is that we would not expect the presented candidates to impact our derived LFs significantly, and the reason is that we expect to miss 30% of the bona-fide -10 candidates using the selection criteria utilized in this paper. Such a completeness fraction is built into the selection volume estimates we estimate for the CANDELS UDS, COSMOS, and EGS fields. The volumes we estimate for those fields are 30% lower than for fields like CANDELS GOODS-North where deeper ACS/optical and -band coverage is available. In most cases, this incompleteness occurs due to a blending of some -10 sources with neighboring sources and some limitations in the sensitivity and wavelength coverage available over the CANDELS WIDE fields.
Let now estimate how many bona-fide candidates we are likely to find if we follow up all the candidates from Tables 5 and 4 with deeper -band observations. Including only those candidates from Tables 5 and 4 which have a redshift , the total fractional probability drops from 8.67 to 5.68.
In addition, we should calibrate our estimated ’s based on the follow-up results from Bouwens et al. (2016) which confirmed only 50% of 9 candidates as bona-fide source (see our discussion in §3.2). As the ’s before follow-up sum to 6.5 in Bouwens et al. (2016) but were found to be 4.5 based on the follow-up data, we should renormalize the computed ’s down by 31%. Incorporating both effects, the total fractional probability is 3.91. In other words, we would expect to find 4 more bona-fide candidates by following up all the sources in Tables 5 and 4 with -band observations.
There are 9 candidate -10 galaxies from the CANDELS UDS, COSMOS, and EGS fields given in Table 2 that we use to derive our -10 LF results. After we account for the insecure nature of 5 of them (counting each as 0.5), the total is 6.5. If we compare the effective number of sources used for the present LF determinations, i.e., 6.5 with the total sample including these additional sources, i.e., 6.5+3.91 = 10.46, the fraction of sources in our main samples is 62%, which is not especially different from the 70% fraction expected from our selection volume simulations.
Appendix C C. Constraints on the Nature of COS910-8 from Keck Observations
While we were still evaluating COS910-8’s viability as a possible candidate on the basis of the HST+Spitzer/IRAC data (Figure 6) and the ground-based data (Figure 11), we obtained sensitive Keck MOSFIRE (McLean et al. 2012) spectroscopy on this source in parallel with a small sample of other candidate -9 and galaxies in CANDELS COSMOS. Given the brightness of COS910-8, it may not be especially difficult to detect line emission from the source if it were at . Of the various lines accessible to detection in COS910-8, the Civ 1548,1550 doublet may be the easiest to detect, if the recent results by Stark et al. (2015), Mainali et al. (2017), and Schmidt et al. (2017) be any guide. If the source was at , the Civ 1548,1550 doublet would fall in the MOSFIRE band. We carried out observations on the 23th and 24th of April 2019 as part of Keck program (U142), for a total of 4.8 hours on source integration time at seeing in the band. The data was reduced using the public MOSFIRE DRP333https://keck-datareductionpipelines.github.io/MosfireDRP/ and perform telluric corrections and flux calibrations using a custom built tool (T. Nanayakkara et al. in prep; Nanayakkara et al. 2016).
Given our redshift estimate of for COS910-8 (when reliance was made on the HST+Spitzer/IRAC information alone), we looked especially carefully in the wavelength interval 15810Å–16430Å for possible line emission as might be indicative of a Civ 1548,1550 doublet. Our observations reach a typical RMS of for an empty sky region in the slit in this redshift window. Within such limits, we find no emission line features for COS910-8. For a typical resolution element of 3 pixels (5Å) on MOSFIRE, this results in an approximate detection limit for Civ of for either line in the doublet. If we convert this line detection limit to the equivalent EW of Civ where we would expect a detection in our data, the EW limit is 5.4Å. Given the likely mass of the source if it were at (see Figure 12), the line width would seemingly be at least 200 km/s, reducing our line sensitivity by approximately a factor of 2 relative to the case that the line was unresolved. If the Civ doublet were as strong as it was measured in the galaxy RXCJ2248-ID3 (Schmidt et al. 2017; Mainali et al. 2017) where an EW of 244Å was measured or A1703-zD6 (Stark et al. 2015) with an equivalent width of 38Å, Civ should easily be detected (again if it were the case that COS910-8 was indeed at ).
Assuming Civ to be a single broad line, using the MOSFIRE sky spectrum444https://www2.keck.hawaii.edu/inst/mosfire/sky_lines.html, we find that of the spectral coverage falls within sky lines with . Thus, there is a probability for Civ to fall within a strong sky line region affecting its spectroscopic identification. However, owing to the fact that Civ is a doublet and given its expected breadth (e.g., Laporte et al. 2017; Mainali et al. 2018), sky lines are unlikely to strongly influence the identification of the Civ doublet, if COS910-8 was indeed at .
We also looked briefly at constraints that can be placed on line emission from Heii and Oiii] 1663 assuming the source is at and the constraints are similar.