TESS Spots a Compact System of Super-Earths around the Naked-Eye Star HR 858
Abstract
Transiting Exoplanet Survey Satellite (TESS) observations have revealed a compact multi-planet system around the sixth-magnitude star HR 858 (TIC 178155732, TOI 396), located 32 parsecs away. Three planets, each about twice the size of Earth, transit this slightly-evolved, late F-type star, which is also a member of a visual binary. Two of the planets may be in mean motion resonance. We analyze the TESS observations, using novel methods to model and remove instrumental systematic errors, and combine these data with follow-up observations taken from a suite of ground-based telescopes to characterize the planetary system. The HR 858 planets are enticing targets for precise radial velocity observations, secondary eclipse spectroscopy, and measurements of the Rossiter-McLaughlin effect.
Subject headings:
planetary systems, planets and satellites: detection, stars: individual (HR 858, TIC 178155732, TOI 396)1. Introduction
2222footnotetext: Department of Physics and Astronomy, Vanderbilt University, Nashville, TN 37235 USA2323footnotetext: Department of Physics, Fisk University, Nashville, TN 37208, USA2424footnotetext: Exoplanetary Science at UNSW, School of Physics, UNSW Sydney, NSW 2052, Australia2525footnotetext: School of Astronomy and Space Science, Key Laboratory of Modern Astronomy and Astrophysics in Ministry of Education, Nanjing University, Nanjing 210046, Jiangsu, China2626footnotetext: Dunlap Institute for Astronomy and Astrophysics, University of Toronto, Ontario M5S 3H4, Canada2727footnotetext: NASA Sagan Fellow2828footnotetext: Juan Carlos Torres Fellow2929footnotetext: Future Faculty Leaders Fellow3030footnotetext: NSF Graduate Research Fellow3131footnotetext: Leinweber Center for Theoretical Physics Graduate Fellow3232footnotetext: 51 Pegasi b Postdoctoral Fellow3333footnotetext: Harvard Junior Fellow3434footnotetext: NASA Hubble FellowThe Kepler space telescope was history’s most prolific exoplanet-detecting tool (Borucki et al., 2010). During its primary and extended K2 missions (Howell et al., 2014), Kepler searched over 500,000 stars across 5% of the sky for small, periodic dimming events caused by transiting planets. Kepler’s survey revealed a stunning diversity of planets in terms of size (Fressin et al., 2013), architecture (Lissauer et al., 2011), and environment (Mann et al., 2017), but due to the survey’s design, most of Kepler’s discoveries orbit faint and otherwise anonymous stars hundreds or thousands of parsecs from Earth. Follow-up studies to characterize Kepler’s planets and investigate their detailed properties are limited by the host stars’ faint apparent magnitudes.
Now, the recently commissioned Transiting Exoplanet Survey Satellite (TESS, Ricker et al. 2015) is beginning to identify analogs of the systems discovered by Kepler, but around the nearest and brightest stars in the sky. Using four wide-angle cameras, TESS is searching 80% of the sky for transiting exoplanets during its two-year primary mission. Already, TESS has discovered several new exoplanets around bright stars that are well-suited for follow-up observations (Huang et al., 2018b; Vanderspek et al., 2019), and hundreds more TESS planet candidates await confirmation.353535https://tess.mit.edu/alerts/
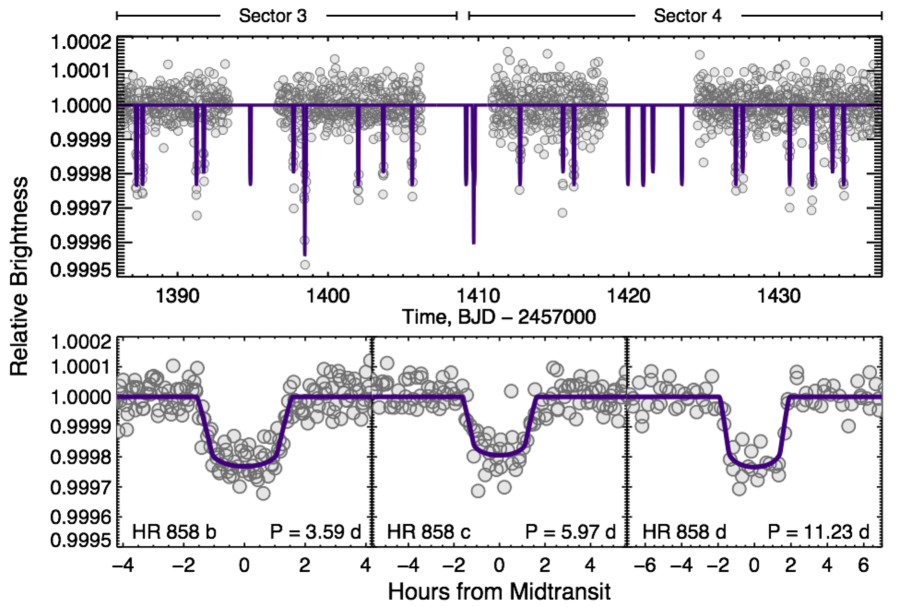
Early in the mission, most TESS planet discoveries were singly-transiting systems (Wang et al., 2019; Rodriguez et al., 2019; Nielsen et al., 2019), but now that some stars have been observed for longer time baselines, the survey is detecting transiting systems with increasingly complex architectures (Quinn et al., 2019; Dragomir et al., 2019). Here, we report the discovery of three super-Earths around the naked-eye star HR 858. The planets are all about twice the size of Earth and have periods of 3.59, 5.98, and 11.23 days. HR 858 b and c orbit within 0.03% of the 3:5 period ratio, and may be in true mean motion resonance. This compact and near-resonant architecture harkens back to the systems of tightly packed inner planets (STIPs) discovered by Kepler, but HR 858 is hundreds to thousands of times brighter ( = 6.4) than the hosts of those Kepler systems. We describe our observations in Section 2, our analysis to determine system parameters in Section 3, and our efforts to show that the planet candidates are not false positives in Section 4. We conclude by discussing the HR 858 system architecture and opportunities for follow-up observations in Section 5.
2. Observations and Data Reduction
2.1. TESS Photometry
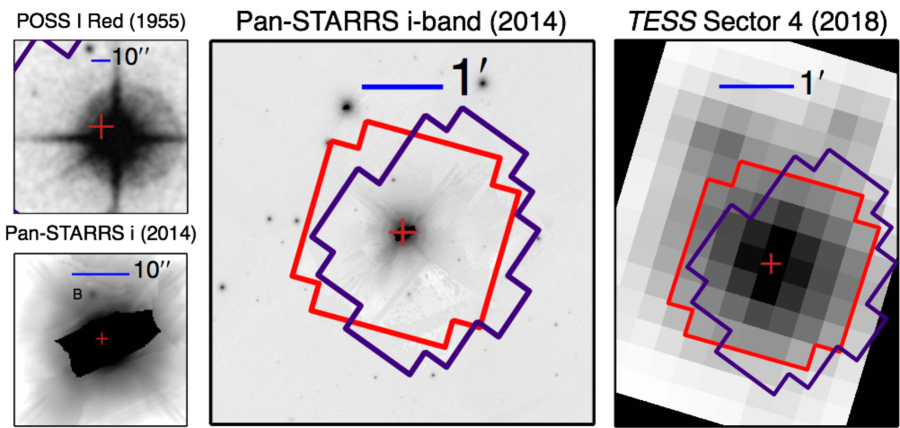
TESS observed HR 858 during the third and fourth sectors of its two-year-long primary mission, obtaining data from 20 September 2018 UT until 14 November 2018 UT. During Sector 4, TESS saved and downlinked images of HR 858 every two minutes, standard procedure for the bright, nearby dwarf stars around which TESS was specifically designed to discover planets. However, during Sector 3, HR 858 fell only a few pixels from the edge of the field of view, so (as for most of the sky) TESS only downlinked co-added images with more-coarsely-sampled 30 minute cadence.
Once the TESS data were transmitted to Earth, we processed the data using two different sets of analysis tools in parallel: the MIT Quick Look Pipeline (QLP, Huang et al. in prep) and the Science Processing Operations Center (SPOC, Jenkins 2015; Jenkins et al. 2016) pipeline based at NASA Ames Research Center. After extracting light curves from the TESS pixel data and searching for periodic signals, both pipelines identified the signatures of two transiting exoplanet candidates. These signals, which repeated every 3.59 and 5.98 days, were tested using standard diagnostics363636These tests included searches for shallow secondary eclipses, differences in transit depth between even and odd-numbered transits, and shifts in HR 858’s apparent position during transit. to determine whether the candidate transits were caused by some astrophysical or instrumental phenomenon other than a genuine system of transiting planets. We found no indication that these signals were false positives, and alerted the community to their existence via the MIT TESS Alerts webpage.373737https://tess.mit.edu/alerts/ We tentatively designated the planet candidates HR 858 b and c.
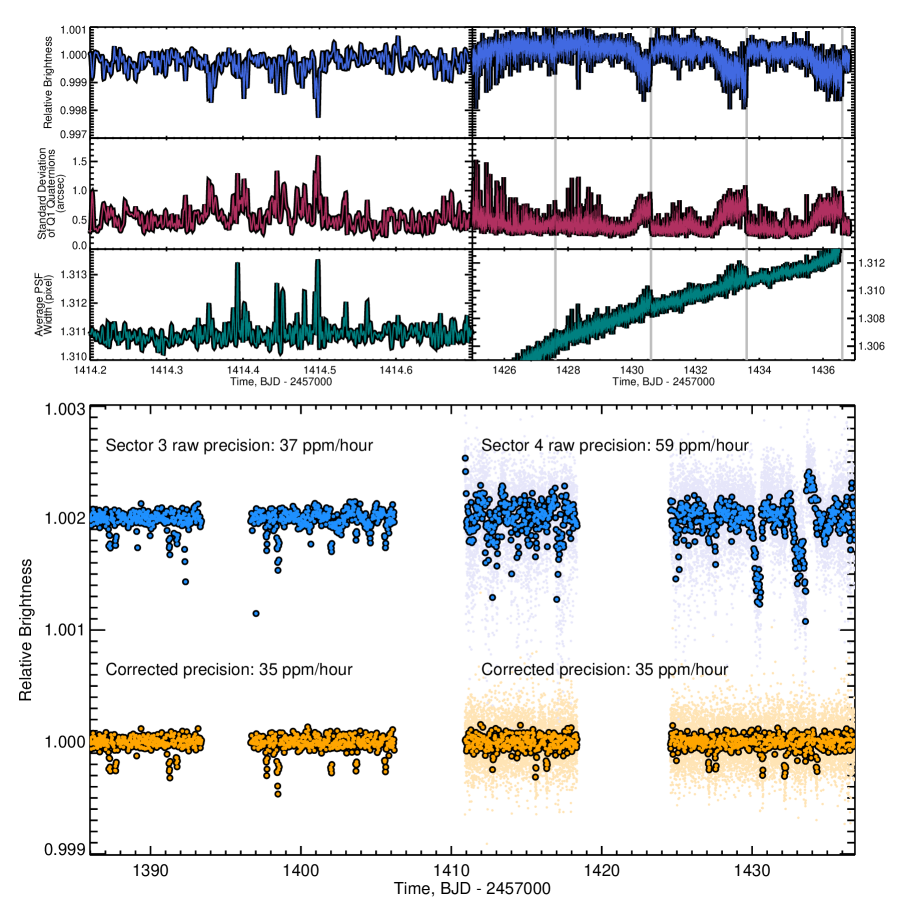
Next, working from the calibrated pixel files,383838We used a cutout from the online TESScut (https://mast.stsci.edu/tesscut/) tool for Sector 3 and the calibrated two-minute cadence target pixel files for Sector 4. we re-extracted light curves from a series of both circular and irregularly shaped apertures (Vanderburg et al., 2016). We ultimately chose the apertures shown in Figure 1, which minimized photometric scatter and contamination from two nearby stars. Systematic errors are present in the light curves from both sectors. Unlike Kepler, whose instrumental systematics were dominated by changes in the spacecraft’s focus (Jenkins et al., 2010), and K2, whose instrumental systematics were dominated by pointing drifts on timescales longer than single exposures (Vanderburg & Johnson, 2014), TESS’s instrumental systematics are dominated by pointing jitter on timescales shorter than an exposure. Figure 2 shows common features appearing in the HR 858 light curve, the width of the TESS PSF (from a fit of the TESS images to a 2d Gaussian), and the intra-exposure scatter in engineering “quaternion” data.393939The quaternion measurements are two-second-cadence vector time series that describe the spacecraft attitude based on observations of a set of guide stars. For each vector component (Q1,Q2,Q3), we take the standard deviation of all measurements within each two-minute science image. The quaternions are measured in each TESS camera (in camera coordinates along the CCD row, column, and roll about the boresight), and are rotated into spacecraft coordinates (where the roll axis is pointing at the sky between Cameras 2 and 3). The quaternions are available online at https://archive.stsci.edu/missions/tess/engineering/. These systematics are present on both short (exposure to exposure) and long (day) timescales (which come from steady increases in the pointing scatter ahead of reaction wheel momentum dump events).
We performed our own correction for the TESS systematics. First, we ignored data where the SPOC quality flag was non-zero and during the following time intervals (where ): (while the TESS operations team conducted tests on the spacecraft’s attitude control system), , , and (near TESS’s orbital perigee when Earthshine contaminated the aperture), and (when spacecraft/instrument communications were interrupted, shutting down the instrument, activating a heater, and introducing systematic trends).
We then treated the remaining short and long timescale systematic behavior separately. The long-timescale behavior gives rise to slow trends in the light curve with jumps each time the spacecraft resets the reaction wheel speeds by briefly firing its thrusters (a “momentum dump”). We remove this behavior by fitting a basis spline (with robust outlier rejection and knots spaced roughly every 1.5 days) to the light curve and introducing discontinuities in the basis spline at the time of each momentum dump. Dividing this spline fit from the light curve effectively removes the long-timescale drifts.
We treated the short-timescale behavior in the TESS light curves differently between Sector 3 and Sector 4. During Sector 3, there are only a handful of exposures strongly affected by short-timescale pointing jitter. We simply exclude the 2% of points with the widest measured PSF (indicating the largest intra-exposure pointing scatter), after removing slow drifts in the PSF width time series as done for the light curves (introducing discontinuities at momentum dumps). This cut corresponds roughly to excluding points with PSF width 7.5 larger than the high-pass-filtered median width, and removes all noticeable flux outliers from the light curve. This strategy is similar to that of Fausnaugh et al. (2019), who identified and removed anamolous points using the mean and standard deviation of the quaternion time series within exposures.
The short-timescale systematic effects in the Sector 4 light curve were higher-amplitude and more pervasive, so instead of simply clipping strongly affected points from the time series, we opted to decorrelate the light curve against other time series. In Sector 4, instead of using the PSF width as a proxy for spacecraft motion, we worked with the less-noisy quaternion data,404040We used the quaterions derived from Camera 2 (where HR 858 was observed) in camera coordinates. We converted the quaternion timestamps from spacecraft time to barycentric Julian date (BJD) towards HR 858. with long-term trends removed as done for the light curves and PSF width time series. We performed the decorrelation using a matrix-inversion least squares technique, iteratively removing 3 outliers from the fit until convergence. We experimented with decorrelating the light curve against different combinations of parameters including the averages and standard deviations of the (Q1, Q2, Q3) quaternions within each exposure, averages and standard deviations of products of quaternions (Q1Q2, Q2Q3, Q1Q3), and various cotrending basis vectors used by the SPOC pipeline’s Presearch Data Conditioning (PDC) module (Smith et al., 2012; Stumpe et al., 2014). We also experimented with decorrelating against higher (quadratic and cubic) orders of these time series. In the end, we found best results by decorrelating only against the standard deviation of the Q1 and Q2 quaternions and the seven cotrending vectors from PDC’s band 3 (fast timescale) correction. The result of this decorrelation (and the long-timescale correction) on the Sector 4 TESS data are shown in the bottom panel of Figure 2.
After producing light curves with systematic effects removed, we re-searched the light curve to look for additional transiting planet candidates. We searched the combined two-sector light curve (after binning the Sector 4 light curve to 30 minute cadence) with a Box-Least-Squares pipeline (Kovács et al., 2002; Vanderburg et al., 2016). In addition to recovering the two candidates identified by the QLP and SPOC pipelines, we detected a third convincing transit signal with a period of 11.23 days. TESS detected three transits of this candidate: two in Sector 3, and one in Sector 4. After identifying the new candidate, we re-derived the systematics correction while excluding points taken during transits of all three planet candidates, and used this light curve in our analysis.
We measured the centroid position of HR 858 in each TESS image and converted the measurements to time series in R.A. and DEC. The average changes in the position of HR 858’s centroid during each planet candidates’ transits were consistent with zero (with precision of a few milliarcseconds). This confidently rules out the possibility that any star more than 40″ away is the true source of the dimming events.
2.2. Archival and High Resolution Imaging
We examined the region of sky around HR 858 using archival surveys and newly-obtained data (Figure 1). Archival imaging from the Palomar Observatory Sky Survey (POSS) rules out background stars within about 6.5 magnitudes414141Based on the lack of a visible bulge in HR 858’s saturated PSF and the size of the saturated PSFs of nearby 12th-13th magnitude stars. of HR 858’s brightness at its present day position, while images from the Pan-STARRS telescope identify seven stars besides HR 858 inside the TESS photometric apertures. All of these stars are at least 9 magnitudes fainter than HR 858, and six of the seven are likely background objects. Parallax and proper motions observations from Gaia DR2 (Gaia Collaboration et al., 2016, 2018) reveal that the nearest star to HR 858 (about 84 to the northeast) is a co-moving companion (270 AU projected separation). The sky-projected velocity of HR 858 and the companion differ by only 2.108 0.034 , consistent with a bound orbit, and analysis of the companion’s spectral energy distribution (SED, following Stassun et al., 2018) reveals it to be an M-dwarf with K and . The Gaia observations of the comoving companion show large astrometric scatter; this may be due to systematic effects from the nearby, much brighter primary star, or it may be an indication that the comoving companion is itself an unresolved binary (Evans, 2018; Rizzuto et al., 2018). Some basic information about the comoving companion, which we call HR 858 B, is given in Table LABEL:bigtable.
We also obtained a high-resolution I-band image of HR 858 with the HRCam speckle imager on the Southern Astrophysical Research (SOAR) telescope. The observations and analysis were conducted as described by Tokovinin (2018). Our observation was sensitive to nearly equal-brightness companions at separations of 006 (1.8 AU projected distance) and fainter stars up to seven magnitudes fainter than HR 858 at larger (315, 100 AU projected) separations. We detected no additional stars brighter than these contrast limits near HR 858.
2.3. High Resolution Spectroscopy
We obtained high-resolution reconnaissance spectroscopy of HR 858 to determine spectroscopic parameters and rule out large radial velocity (RV) variations. We observed HR 858 twice with the Tillinghast Reflector Echelle Spectrograph (TRES424242www.sao.arizona.edu/html/FLWO/60/TRES/GABORthesis.pdf) on the 1.5m telescope at Fred L. Whipple Observatory, once with the CHIRON spectrograph on the 1.5m SMARTS telescope at Cerro Tololo Inter-American Observatory (CTIO), once with the echelle spectrograph on the 2.3m Australian National University (ANU) telescope at Siding Spring Observatory, and seven times with the Network of Robotic Echelle Spectrographs (NRES, Eastman et al. 2014; Siverd et al. 2016, 2018) operated by Las Cumbres Observatory (LCO, Brown et al., 2013) from CTIO and South African Astronomical Observatory (SAAO). The reconnaissance observations showed no large radial velocity variations or evidence for a composite spectrum. From the TRES data, we measured an absolute RV of 9.6 0.1 by cross-correlating the observed spectra with synthetic spectra derived from Kurucz (1992) atmosphere models and applying empirical corrections to shift the measured velocity to the IAU scale (Stefanik et al., 1999). We found no evidence for large ( ) RV variations that might indicate HR 858 is a close binary star. The measured absolute velocity is consistent with archival radial velocity measurements going back over a decade from the Gaia mission (Gaia Collaboration et al., 2018), Pulkuvo Observatory (Gontcharov, 2006), and the Geneva Copenhagen Survey (Casagrande et al., 2011).
After our initial reconnaissance, we obtained 30 observations on 13 separate nights with the MINERVA-Australis telescope array at Mt. Kent Observatory in Queensland, Australia (Addison et al., 2019) to place stronger limits on the transiting companions’ masses. We measured radial velocities via least-squares analysis (Anglada-Escudé & Butler, 2012) and corrected for spectrograph drifts with simultaneous Thorium Argon arc lamp observations. From these data, which showed scatter of about 14 , we calculate upper limits (95% confidence) on the masses of the three planet candidates around HR 858 of about 45 each using the RadVel package (Fulton et al., 2018). Our radial velocity observations are summarized in Table 1.
We determined spectroscopic parameters from the TRES spectra using the Stellar Parameter Classification (SPC) code (Buchhave et al., 2012, 2014) and found parameters (, , )434343[m/H] is the star’s overall metallicity assuming HR 858’s metals have the same relative proportions as in the Sun. consistent with literature determinations (Gray et al., 2006; Casagrande et al., 2011). Our spectroscopic reconnaissance also found that HR 858 is rotating moderately rapidly. Following Zhou et al. (2018), we measured a projected rotational velocity of and a macroturbulent velocity of . An analysis of the NRES spectra using SpecMatch (Petigura, 2015; Petigura et al., 2017) yielded results (, , ) consistent with those from TRES and SPC.
| Time | RV | RV Error | Instrument |
|---|---|---|---|
| BJD | |||
| 2458508.627 | 9.5450 | 0.1000 | TRES |
| 2458510.649 | 9.5990 | 0.1000 | TRES |
| 2458536.892 | 9.3000 | 0.5000 | ANU |
| 2458532.543 | 8.1940 | 0.0140 | CHIRON |
| 2458523.008 | 9.7820 | 0.0051 | MINERVA-Australis |
| 2458523.016 | 9.7860 | 0.0049 | MINERVA-Australis |
| 2458524.913 | 9.7892 | 0.0058 | MINERVA-Australis |
| 2458524.927 | 9.7811 | 0.0058 | MINERVA-Australis |
| 2458524.943 | 9.7773 | 0.0058 | MINERVA-Australis |
| 2458524.957 | 9.7319 | 0.0056 | MINERVA-Australis |
| 2458524.972 | 9.7726 | 0.0055 | MINERVA-Australis |
| 2458526.974 | 9.8016 | 0.0058 | MINERVA-Australis |
| 2458526.985 | 9.7963 | 0.0057 | MINERVA-Australis |
| 2458528.948 | 9.7806 | 0.0046 | MINERVA-Australis |
| 2458528.956 | 9.7688 | 0.0047 | MINERVA-Australis |
| 2458528.964 | 9.7639 | 0.0047 | MINERVA-Australis |
| 2458529.945 | 9.7676 | 0.0055 | MINERVA-Australis |
| 2458529.952 | 9.7885 | 0.0056 | MINERVA-Australis |
| 2458529.960 | 9.7886 | 0.0056 | MINERVA-Australis |
| 2458530.943 | 9.7718 | 0.0054 | MINERVA-Australis |
| 2458530.950 | 9.7779 | 0.0052 | MINERVA-Australis |
| 2458531.943 | 9.7683 | 0.0051 | MINERVA-Australis |
| 2458531.957 | 9.7761 | 0.0052 | MINERVA-Australis |
| 2458533.947 | 9.7950 | 0.0059 | MINERVA-Australis |
| 2458533.954 | 9.7917 | 0.0059 | MINERVA-Australis |
| 2458535.982 | 9.8029 | 0.0057 | MINERVA-Australis |
| 2458535.990 | 9.7817 | 0.0055 | MINERVA-Australis |
| 2458536.940 | 9.7757 | 0.0056 | MINERVA-Australis |
| 2458536.948 | 9.7740 | 0.0056 | MINERVA-Australis |
| 2458537.954 | 9.7717 | 0.0054 | MINERVA-Australis |
| 2458537.962 | 9.7793 | 0.0058 | MINERVA-Australis |
| 2458538.955 | 9.7609 | 0.0048 | MINERVA-Australis |
| 2458538.966 | 9.7682 | 0.0046 | MINERVA-Australis |
| 2458509.048 | 9.8214 | 0.0096 | MINERVA-Australis |
| 2458522.290 | 8.9689 | 0.7386 | LCO-SAAO |
| 2458533.266 | 8.8251 | 0.2172 | LCO-SAAO |
| 2458535.568 | 9.8806 | 0.1139 | LCO-CTIO |
| 2458536.538 | 9.8718 | 0.1457 | LCO-CTIO |
| 2458538.555 | 9.9197 | 0.1491 | LCO-CTIO |
| 2458542.258 | 9.5613 | 0.2002 | LCO-SAAO |
| 2458546.254 | 8.7488 | 0.1880 | LCO-SAAO |
Note. — RVs from each instrument have not been corrected for instrumental offsets onto the same velocity system. Times have been converted to BJD_TDB using routines written by Eastman et al. (2010).
3. Determination of System Parameters
We determined system parameters using the EXOFASTv2 global modeling software (Eastman et al., 2013; Eastman, 2017). EXOFASTv2 uses Markov Chain Monte Carlo (MCMC) to explore a high-dimensional space in physical model parameters and determine best-fit values and uncertainties. We fit the two-sector TESS light curve and a spectral energy distribution constructed from archival broadband photometry (listed in Table LABEL:bigtable). We imposed priors on spectroscopic parameters from TRES and the Gaia parallax, and we enforced an upper limit on -band extinction of mag from Schlegel et al. (1998). MIST isochrones (Choi et al., 2016) were used to constrain the stellar parameters. Each MCMC link’s linear and quadratic limb darkening parameters were assigned by interpolating from Claret & Bloemen (2011) models at that link’s surface gravity, effective temperature, and metallicity. We ran the fit until convergence (defined as 1000 independent posterior draws after the chains all reached a Gelman-Rubin statistic less than 1.01). The results of our fit are given in Table LABEL:bigtable.
We cross-checked the EXOFASTv2 analysis with other less-comprehensive analyses in parallel. In particular, we fit for light curve and stellar parameters following Huang et al. (2018b), and confirmed that our removal of low frequency variability and long-timescale systematics did not significantly affect the fit parameters. Another transit analysis that did not use constraints from the host star’s parameters yielded the duration of transit ingress/egress, (or the time between the first and second transit contacts; see Figure 1 of Seager & Mallén-Ornelas 2003) and the total transit duration, (from first to fourth contact). We also re-derived stellar parameters using an online interface444444http://stev.oapd.inaf.it/cgi-bin/param_1.3 to fit the effective temperature, -band magnitude and parallax with Padova models (da Silva et al., 2006), and using broadband photometry to fit the SED following Stassun et al. (2018); both analyses yielded results consistent with the EXOFASTv2 fit.
4. False Positive Analysis
While experience from the Kepler mission has taught us that small planet candidates from space-based transit surveys are usually planets (Morton & Johnson, 2011), especially those in multi-transiting systems (Lissauer et al., 2012), careful analysis is required to rule out false positive scenarios. During the Kepler and K2 eras, it became common to “statistically validate” planet candidates using tools like vespa (Morton, 2012, 2015), BLENDER (Torres et al., 2011), and PASTIS (Díaz et al., 2014) which quantify the likelihood that the any given signal arises from a false positive.
Planet candidates discovered by TESS often have advantages over candidates from Kepler/K2, which can make it possible to rule out some or all false positive scenarios categorically, rather than calculating probabilities based on false positive population models. In particular, most TESS planet candidates are observed at 2 minute cadence, so we can precisely measure ingress/egress times, and many TESS targets are nearby and have high proper motion, so it is possible to show that background stars cannot cause the transit signals.
For HR 858, we take advantage of both approaches. We consider the following false positive scenarios for one or more of the transit signals around HR 858:
-
1.
HR 858 is an eclipsing binary: Our radial velocity observations from MINERVA-Australis and TRES rule out this scenario (Section 2.3).
-
2.
Light from an unassociated eclipsing binary or transiting planet system is blended with HR 858: If the transit signal comes from a star other than HR 858, the observed transit depth will be:
(1) where is the true radius ratio of the transiting/eclipsing body on the source star, and is the fraction of the flux the source star contributes to the TESS light curve. The ratio of the transit ingress/egress duration, , to the duration from first to third contact () constrains the radius ratio of the transit source regardless of any diluting flux (from Seager & Mallén-Ornelas, 2003, Equation 21):
(2) We calculate the magnitude difference between HR 858 and the faintest companion which could cause the transit signals we see:
(3) (4) Using Equation 4 and our transit analysis (Section 3, we find 4.5, 5.9, and 6.1 magnitudes for HR 858 b, c, and d respectively (95% confidence). Analysis of the TESS image centroids shows that the source of the transits must be within 40″ of HR 858 (Section 2.1), and archival imaging (Section 2.2) shows no stars both close enough and bright enough to contribute the transit signals, including at HR 858’s present-day position, ruling out background false positive scenarios.
-
3.
Light from a physically associated companion which is an eclipsing binary or transiting planet system is blended with HR 858: The comoving companion HR 858 B is too faint (Gaia Rp = 14.5, Rp = 8.6 mag) to contribute the transits based on our constraints, and there is no evidence of any brighter resolved companions in speckle/archival imaging or any unresolved companion causing an RV acceleration. False positive scenarios involving bound companions to HR 858 are therefore unlikely, but we can not conclusively rule out the possibility that HR 858 has an undetected companion bright enough to contribute the transits.
Since we cannot rule out all false positive scenarios involving physically associated companions to HR 858, we use vespa to evaluate the probability of these false positive scenarios. Using the TESS light curve of each planet candidate and constraints from spectroscopy and imaging, vespa finds low false positive probabilities (FPP) for all three planet candidates (FPP for each candidate), so we consider HR 858 b, c, and d to be validated planets.
5. Discussion
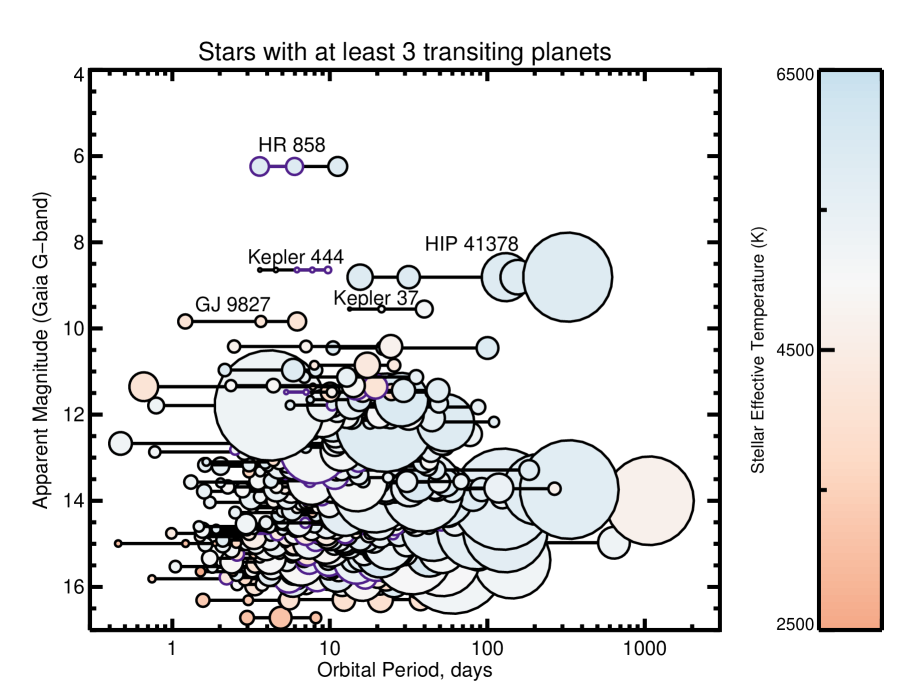
HR 858 is one of the brightest stars known to host transiting planets, trailing only HD 219134 (Motalebi et al., 2015), Mensae (Huang et al., 2018b), and 55 Cancri (Winn et al., 2011). Transiting planets around stars this bright afford rich opportunities for detailed characterization, including mass measurements through precise RV observations, secondary eclipse spectroscopy with the James Webb Space Telescope454545The PandExo tool predicts that NIRCam observations (with a grism and the F444W filter) of a single secondary eclipse of HR 858 b should yield an 11 detection over the full bandpass and 30% precision in 100 nm spectral bins. Despite HR 858 being near JWST’s bright limits, the simulated observing efficiency was 67% using the SUBGRISM64, frametime = 0.34 seconds read-out mode, and the star did not saturate the detectors., and measurements of the alignment of the planetary orbits and stellar spin axis via the Rossiter-McLaughlin effect (Rossiter, 1924; McLaughlin, 1924) or Doppler Tomography.464646Though HR 858’s moderate rotation complicates RV observations, it is possible to measure precise RVs of even more rapidly rotating stars (Barros et al., 2017). Early RV observations of HR 858 indicate it is possible to achieve precision of a few (D. Gandolfi and D. Anderson, priv. comm.), similar to the expected 1-2 amplitude of the RV orbits and Rossiter-McLaughlin signals. HR 858 stands out even among the brightest known transiting systems because of its multiplicity; the next-brightest star known to host 3 transiting planets is 9 times fainter than HR 858. (see Figure 4).
From Kepler, we know of many examples of compact, multi-transiting, and coplanar systems, but relatively few of these systems are in true mean motion resonances (Fabrycky et al., 2014). The HR 858 system could be one of the exceptions to this rule; HR 858 b and c may be in a true 3:5 mean motion resonance. We assessed these planets’ resonant state by randomly drawing 50 sets of initial orbital parameters from the EXOFASTv2 posterior probability distributions and performing N-body integrations for years using the Mercury6 (Chambers, 1999) code. We used a hybrid symplectic and Bulirsch-Stoer integrator, with a time-step of 90 minutes and energy conservation kept to 1 part in or better. The simulations include the stellar quadrupole field due to rotation as a moment, which we estimated to be by modeling the star as a polytrope (Lanza et al., 2011; Batygin & Adams, 2013) with our derived mass/radius/rotational velocity. About one third of the simulated system realizations show at least some evidence of mean motion resonance: 20% of the realizations exhibited librating resonance angles for the entire duration of the simulation, while another 14% exhibited librating resonance angles some of the time. Long-term RV and/or transit monitoring will help determine the resonant state of these planets; lower eccentricities for planets b and c474747The 3:5 mean motion resonance, in particular, is both easier to generate during disk migration (Quillen 2006) and more easily maintained in the presence of nearby planetary perturbers when the system eccentricities are low. A more narrow libration width, characteristic at lower eccentricities, presents fewer opportunities for a nearby perturbing planet to disrupt the resonance., and weaker perturbations from the outer planet d484848In our simulations, we found evidence that lower masses and eccentricities for planet d increased the likelihood of planets b and c being in resonance. should make a resonance more likely.
The comoving stellar companion, HR 858 B, adds further intrigue to the system’s architecture. The Gaia proper motion measurements for the primary and secondary differ by 13.9 0.2 mas yr-1. If we interpret this discrepancy as relative orbital motion between the two stars (and not systematics due to the large brightness contrast or unresolved orbital motion if HR 858 B is indeed itself a close binary), the orbit of HR 858 B about HR 858 A must be misaligned from the orbits of the transiting system by at least 40 degrees.494949As determined by a fit of the binary orbit using code available at https://github.com/logan-pearce/LOFTI (Pearce et al. in prep). If true, HR 858 B could have torqued HR 858’s planet-forming disk, causing a misalignment between the stellar spin axis and the transiting super-Earths’ orbits. In particular, HR 858 B’s mass and projected separation appear to put the system in a regime where the timescale for stellar spin axis realignment would be longer than the disk dissipation timescale, potentially “freezing in” the misalignment (Batygin, 2012; Spalding & Batygin, 2014). Future monitoring of the HR 858 A/B binary orbit should confirm its misalignment with the transit system and determine whether these mechanisms could create a spin/orbit misaligned multi-planetary system (that could be identified via Rossiter-McLaughlin observations of HR 858 b, c, or d).
Though the TESS prime mission survey is only about 25% complete, there may not be many new transiting planets around stars brighter than HR 858 left to discover. Pre-launch estimates of the TESS planet yield (Sullivan et al., 2015; Barclay et al., 2018; Huang et al., 2018a) predicted a handful of planet discoveries around naked eye stars, and so far only HR 858 and Mensae have fit this description. HR 858 will thus likely retain its privileged position as one of the brightest transit hosts in the sky and most favorable systems for detailed study.
References
- Addison et al. (2019) Addison, B., Wright, D. J., Wittenmyer, R. A., et al. 2019, arXiv e-prints, arXiv:1901.11231
- Anglada-Escudé & Butler (2012) Anglada-Escudé, G., & Butler, R. P. 2012, ApJS, 200, 15
- Barclay et al. (2018) Barclay, T., Pepper, J., & Quintana, E. V. 2018, ApJS, 239, 2
- Barros et al. (2017) Barros, S. C. C., Gosselin, H., Lillo-Box, J., et al. 2017, A&A, 608, A25
- Batalha et al. (2017) Batalha, N. E., Mandell, A., Pontoppidan, K., et al. 2017, PASP, 129, 064501
- Batygin (2012) Batygin, K. 2012, Nature, 491, 418
- Batygin & Adams (2013) Batygin, K., & Adams, F. C. 2013, ApJ, 778, 169
- Blunt et al. (2017) Blunt, S., Nielsen, E. L., De Rosa, R. J., et al. 2017, AJ, 153, 229
- Borucki et al. (2010) Borucki, W. J., Koch, D., Basri, G., et al. 2010, Science, 327, 977
- Brown et al. (2013) Brown, T. M., Baliber, N., Bianco, F. B., et al. 2013, PASP, 125, 1031
- Buchhave et al. (2012) Buchhave, L. A., Latham, D. W., Johansen, A., et al. 2012, Nature, 486, 375
- Buchhave et al. (2014) Buchhave, L. A., Bizzarro, M., Latham, D. W., et al. 2014, Nature, 509, 593
- Casagrande et al. (2011) Casagrande, L., Schönrich, R., Asplund, M., et al. 2011, A&A, 530, A138
- Chambers (1999) Chambers, J. E. 1999, MNRAS, 304, 793
- Choi et al. (2016) Choi, J., Dotter, A., Conroy, C., et al. 2016, ApJ, 823, 102
- Claret & Bloemen (2011) Claret, A., & Bloemen, S. 2011, A&A, 529, A75
- da Silva et al. (2006) da Silva, L., Girardi, L., Pasquini, L., et al. 2006, A&A, 458, 609
- Díaz et al. (2014) Díaz, R. F., Almenara, J. M., Santerne, A., et al. 2014, MNRAS, 441, 983
- Dragomir et al. (2019) Dragomir, D., Teske, J., Gunther, M. N., et al. 2019, arXiv e-prints, arXiv:1901.00051
- Eastman (2017) Eastman, J. 2017, EXOFASTv2: Generalized publication-quality exoplanet modeling code, Astrophysics Source Code Library, ascl:1710.003
- Eastman et al. (2013) Eastman, J., Gaudi, B. S., & Agol, E. 2013, PASP, 125, 83
- Eastman et al. (2010) Eastman, J., Siverd, R., & Gaudi, B. S. 2010, PASP, 122, 935
- Eastman et al. (2014) Eastman, J. D., Brown, T. M., Hygelund, J., et al. 2014, in Society of Photo-Optical Instrumentation Engineers (SPIE) Conference Series, Vol. 9147, Ground-based and Airborne Instrumentation for Astronomy V, 914716
- Evans (2018) Evans, D. F. 2018, Research Notes of the American Astronomical Society, 2, 20
- Fabrycky et al. (2014) Fabrycky, D. C., Lissauer, J. J., Ragozzine, D., et al. 2014, ApJ, 790, 146
- Fausnaugh et al. (2019) Fausnaugh, M. M., Vallely, P. J., Kochanek, C. S., et al. 2019, arXiv e-prints, arXiv:1904.02171
- Fressin et al. (2013) Fressin, F., Torres, G., Charbonneau, D., et al. 2013, ApJ, 766, 81
- Fulton et al. (2018) Fulton, B. J., Petigura, E. A., Blunt, S., & Sinukoff, E. 2018, PASP, 130, 044504
- Gaia Collaboration et al. (2018) Gaia Collaboration, Brown, A. G. A., Vallenari, A., et al. 2018, ArXiv e-prints, arXiv:1804.09365
- Gaia Collaboration et al. (2016) Gaia Collaboration, Prusti, T., de Bruijne, J. H. J., et al. 2016, A&A, 595, A1
- Gontcharov (2006) Gontcharov, G. A. 2006, Astronomy Letters, 32, 759
- Gray et al. (2006) Gray, R. O., Corbally, C. J., Garrison, R. F., et al. 2006, AJ, 132, 161
- Howell et al. (2014) Howell, S. B., Sobeck, C., Haas, M., et al. 2014, PASP, 126, 398
- Huang et al. (in prep) Huang, C. X., Pal, A., Vanderburg, A., & et. al. in prep
- Huang et al. (2018a) Huang, C. X., Shporer, A., Dragomir, D., et al. 2018a, arXiv e-prints, arXiv:1807.11129
- Huang et al. (2018b) Huang, C. X., Burt, J., Vanderburg, A., et al. 2018b, ApJ, 868, L39
- Hunter (2007) Hunter, J. D. 2007, Computing in Science and Engineering, 9, 90
- Jenkins (2015) Jenkins, J. M. 2015, in AAS/Division for Extreme Solar Systems Abstracts, Vol. 3, AAS/Division for Extreme Solar Systems Abstracts, 106.05
- Jenkins et al. (2010) Jenkins, J. M., Caldwell, D. A., Chandrasekaran, H., et al. 2010, ApJ, 713, L120
- Jenkins et al. (2016) Jenkins, J. M., Twicken, J. D., McCauliff, S., et al. 2016, in Proc. SPIE, Vol. 9913, Software and Cyberinfrastructure for Astronomy IV, 99133E
- Kovács et al. (2002) Kovács, G., Zucker, S., & Mazeh, T. 2002, A&A, 391, 369
- Kurucz (1992) Kurucz, R. L. 1992, in IAU Symposium, Vol. 149, The Stellar Populations of Galaxies, ed. B. Barbuy & A. Renzini, 225
- Landsman (1993) Landsman, W. B. 1993, in Astronomical Society of the Pacific Conference Series, Vol. 52, Astronomical Data Analysis Software and Systems II, ed. R. J. Hanisch, R. J. V. Brissenden, & J. Barnes, 246
- Lanza et al. (2011) Lanza, A. F., Damiani, C., & Gandolfi, D. 2011, A&A, 529, A50
- Lissauer et al. (2011) Lissauer, J. J., Fabrycky, D. C., Ford, E. B., et al. 2011, Nature, 470, 53
- Lissauer et al. (2012) Lissauer, J. J., Marcy, G. W., Rowe, J. F., et al. 2012, ApJ, 750, 112
- Mann et al. (2017) Mann, A. W., Gaidos, E., Vanderburg, A., et al. 2017, AJ, 153, 64
- McKinney et al. (2010) McKinney, W., et al. 2010, in Proceedings of the 9th Python in Science Conference, Vol. 445, Austin, TX, 51–56
- McLaughlin (1924) McLaughlin, D. B. 1924, ApJ, 60, doi:10.1086/142826
- Morton (2012) Morton, T. D. 2012, ApJ, 761, 6
- Morton (2015) —. 2015, VESPA: False positive probabilities calculator, Astrophysics Source Code Library, ascl:1503.011
- Morton & Johnson (2011) Morton, T. D., & Johnson, J. A. 2011, ApJ, 738, 170
- Motalebi et al. (2015) Motalebi, F., Udry, S., Gillon, M., et al. 2015, A&A, 584, A72
- Nielsen et al. (2019) Nielsen, L. D., Bouchy, F., Turner, O., et al. 2019, A&A, 623, A100
- Oliphant (2006) Oliphant, T. E. 2006, A guide to NumPy
- Petigura (2015) Petigura, E. A. 2015, PhD thesis, University of California, Berkeley
- Petigura et al. (2017) Petigura, E. A., Howard, A. W., Marcy, G. W., et al. 2017, AJ, 154, 107
- Quinn et al. (2019) Quinn, S. N., Becker, J. C., Rodriguez, J. E., et al. 2019, arXiv e-prints, arXiv:1901.09092
- Ricker et al. (2015) Ricker, G. R., Winn, J. N., Vanderspek, R., et al. 2015, Journal of Astronomical Telescopes, Instruments, and Systems, 1, 014003
- Rizzuto et al. (2018) Rizzuto, A. C., Vanderburg, A., Mann, A. W., et al. 2018, AJ, 156, 195
- Rodriguez et al. (2019) Rodriguez, J. E., Quinn, S. N., Huang, C. X., et al. 2019, arXiv e-prints, arXiv:1901.09950
- Rossiter (1924) Rossiter, R. A. 1924, ApJ, 60, doi:10.1086/142825
- Schlegel et al. (1998) Schlegel, D. J., Finkbeiner, D. P., & Davis, M. 1998, ApJ, 500, 525
- Seager & Mallén-Ornelas (2003) Seager, S., & Mallén-Ornelas, G. 2003, ApJ, 585, 1038
- Siverd et al. (2016) Siverd, R. J., Brown, T. M., Hygelund, J., et al. 2016, in Society of Photo-Optical Instrumentation Engineers (SPIE) Conference Series, Vol. 9908, Ground-based and Airborne Instrumentation for Astronomy VI, 99086X
- Siverd et al. (2018) Siverd, R. J., Brown, T. M., Barnes, S., et al. 2018, in Society of Photo-Optical Instrumentation Engineers (SPIE) Conference Series, Vol. 10702, Ground-based and Airborne Instrumentation for Astronomy VII, 107026C
- Smith et al. (2012) Smith, J. C., Stumpe, M. C., Van Cleve, J. E., et al. 2012, PASP, 124, 1000
- Spalding & Batygin (2014) Spalding, C., & Batygin, K. 2014, ApJ, 790, 42
- Stassun et al. (2018) Stassun, K. G., Corsaro, E., Pepper, J. A., & Gaudi, B. S. 2018, AJ, 155, 22
- Stefanik et al. (1999) Stefanik, R. P., Latham, D. W., & Torres, G. 1999, in Astronomical Society of the Pacific Conference Series, Vol. 185, IAU Colloq. 170: Precise Stellar Radial Velocities, ed. J. B. Hearnshaw & C. D. Scarfe, 354
- Stumpe et al. (2014) Stumpe, M. C., Smith, J. C., Catanzarite, J. H., et al. 2014, PASP, 126, 100
- Sullivan et al. (2015) Sullivan, P. W., Winn, J. N., Berta-Thompson, Z. K., et al. 2015, ApJ, 809, 77
- Tokovinin (2018) Tokovinin, A. 2018, PASP, 130, 035002
- Torres et al. (2011) Torres, G., Fressin, F., Batalha, N. M., et al. 2011, ApJ, 727, 24
- Vanderburg & Johnson (2014) Vanderburg, A., & Johnson, J. A. 2014, PASP, 126, 948
- Vanderburg et al. (2016) Vanderburg, A., Latham, D. W., Buchhave, L. A., et al. 2016, ApJS, 222, 14
- Vanderspek et al. (2019) Vanderspek, R., Huang, C. X., Vanderburg, A., et al. 2019, ApJ, 871, L24
- Wang et al. (2019) Wang, S., Jones, M., Shporer, A., et al. 2019, AJ, 157, 51
- Winn et al. (2011) Winn, J. N., Matthews, J. M., Dawson, R. I., et al. 2011, ApJ, 737, L18
- Zhou et al. (2018) Zhou, G., Rodriguez, J. E., Vanderburg, A., et al. 2018, AJ, 156, 93
| Parameter | Units | Values | ||
|---|---|---|---|---|
| Identifying Information | ||||
| HR 858, HD 17926, HIP 13363, TIC 178155732, TOI 396 | ||||
| Gaia DR2 Source ID 5064574720469473792 | ||||
| R.A | Right Ascension (J2000) | 02:51:56.25 | ||
| DEC | Declination (J2000) | -30:48:52.3 | ||
| PMRA | Proper Motion in Right Ascension (mas yr-1) | |||
| PMDEC. | Proper Motion in Declination (mas yr-1) | |||
| Parallax (mas) | ||||
| Tycho B-band Magnitude | ||||
| Tycho V-band Magnitude | ||||
| 2MASS J-band Magnitude | ||||
| 2MASS H-band Magnitude | ||||
| 2MASS K-band Magnitude | ||||
| WISE Band 1 Magnitude | ||||
| WISE Band 2 Magnitude | ||||
| WISE Band 3 Magnitude | ||||
| WISE Band 4 Magnitude | ||||
| Identifying Information and Photometric Properties for Co-moving Companion HR 858 B | ||||
| Gaia DR2 Source ID 5064574724768583168 | ||||
| R.A | Right Ascension (J2000) | 02:51:56.41 | ||
| DEC | Declination (J2000) | -30:48:44.2 | ||
| PMRA | Proper Motion in Right Ascension (mas yr-1) | |||
| PMDEC. | Proper Motion in Declination (mas yr-1) | |||
| Parallax (mas) | ||||
| Gaia G-band Magnitude | ||||
| Gaia Bp-band Magnitude | ||||
| Gaia Rp-band Magnitude | ||||
| Pan-STARRS -band Magnitude | ||||
| Pan-STARRS -band Magnitude | ||||
| Pan-STARRS -band Magnitude | ||||
| Observed Stellar Parameters | ||||
| Spectroscopic surface gravity (cgs) | ||||
| Effective Temperature (K) | ||||
| Metallicity (dex) | ||||
| Projected rotational velocity () | ||||
| Derived Stellar Parameters | ||||
| Mass () | ||||
| Radius () | ||||
| Luminosity () | ||||
| Density (cgs) | ||||
| Model-derived surface gravity (cgs) | ||||
| TESS-band linear limb-darkening coeff | ||||
| TESS-band quadratic limb-darkening coeff | ||||
| Planetary Parameters: | b | c | d | |
| Period (days) | ||||
| Radius () | ||||
| Time of conjunction () | ||||
| Semi-major axis (AU) | ||||
| Inclination (Degrees) | ||||
| Eccentricity (95% Confidence) | ||||
| Equilibrium temperature (K) | ||||
| Radius of planet in stellar radii | ||||
| Semi-major axis in stellar radii | ||||
| Planet/star separation at mid transit | ||||
| Transit depth | ||||
| Total transit duration (days) | ||||
| Transit Impact parameter | ||||
| Incident Flux (109 erg s-1 cm-2) | ||||