|
|
Self-Diffusion of Glycerol in -Alumina Nanopores: Understanding the Effect of Pore Saturation on the Dynamics of Confined Polyalcohols |
| Gerardo Campos-Villalobos,a Flor R. Siperstein,a Carmine D’Agostino,a and Alessandro Patti∗a | |
|
|
Molecular Dynamics simulations of glycerol confined in -Al2O3 slit nanopores are used to explain controversial and inconsistent observations reported in the literature regarding the dynamics of viscous fluids in confined geometries. Analysing the effects of the degree of confinement and pore saturation in this system, we found that the presence of the solid/liquid interface and the liquid/gas interface in partially saturated pores are the main contributors for the disruption of the hydrogen bond network of glycerol. Despite the reduction of hydrogen bonds between glycerol molecules caused by the presence of the solid, glycerol molecules near the solid surface can establish hydrogen bonds with the hydroxyl groups of -Al2O3 that significantly slow-down the dynamics of the confined fluid compared to the bulk liquid. On the other hand, the disruption of the hydrogen bond network caused by the liquid/gas interface in unsaturated pores reduces significantly the number of hydrogen bonds between glycerol molecules and results in a faster dynamics than in the bulk liquid. Therefore, we suggest that the discrepancies reported in the literature are a consequence of measurements carried out under different pore saturation conditions. |
1 Introduction
Spatial confinement in volumes of mesoscopic dimensions is known to dramatically affect the thermodynamic and transport properties of molecular fluids 1. Changes in the location of first-order transitions, structure and dynamics have been often reported for a wide variety of molecular systems in hard confining geometries 2, 3, 4, 5. For the specific case of solid-fluid interfaces, the spatial dependence in the intermolecular interactions imposes an inherent inhomogeneity in the system that challenges the scope of classical equilibrium thermodynamics by establishing a density variation perpendicular to the interface 6. The fundamental understanding of these modifications from bulk fluid behaviour is of great importance in technologies such as heterogeneous catalysis, engine lubrication, surface coating and enhanced oil recovery. In this regard, statistical mechanical theories and computer simulation techniques, including Monte Carlo (MC) and Molecular Dynamics (MD) methods, have played a crucial role.
Apart from density functional methods 7, most theoretical models of confined fluids do not describe spatial inhomogeneities in an explicit way. The phenomenon is rather treated as a phase-equilibrium problem between two macroscopically distinct phases with unique densities: the bulk and confined fluids (e.g. Travalloni’s model 8 and quasi-two dimensional fluid approach 9). By contrast, in particle-based simulations the fluid spatial distribution within the confining media is considered explicitly, allowing then for the study of the relationship between molecular structure and mobility.
While a considerable number of computer simulation studies have focused on associating liquids such as water confined in slit-shaped nanopores and nanotubes 10, 11, 12, only little attention has been paid to the case of organic viscous glass-formers in mesoporous materials, which are of high interest in condensed matter physics. A fundamentally important question in these systems is how the glass transition temperature is shifted due to the introduction of two- and three-dimensional geometric constraints 13. Within this category, the sugar alcohol glycerol (C3O3H8) has been one of the most extensively studied molecular glass-formers in experiments over the last few decades 14, 15, 16, 17. Despite its apparent simplicity, glycerol is a flexible molecule able to form highly directional intra- and inter-molecular hydrogen bonds. Thus in the liquid state, the complex hydrogen bonding network results in the emergence of an intermediate range order, which is atypical in molecular fluids with only dispersive interactions 18, 19.
Recent experiments on the mobility of liquid glycerol under hard confinement have led to especially intriguing, but apparently contradictory, conclusions 20. On the one hand, a breaking of the conventional free volume rules for molecular mobility was reported from spectroscopy measurements of glycerol in a mesoporous silica glass 21. The authors observed that upon confinement, the molecular motion was strongly suppressed, but that the local free volume between molecules was higher than in the bulk phase. On the other hand, D’Agostino et al. 22 reported an unexpected significant enhancement in the self-diffusion of glycerol when confined in mesoporous gamma-alumina (-Al2O3). The ratio of the effective self-diffusivity within the porous media to the free bulk liquid self-diffusivity was found to be at C and atmospheric pressure. Anomalously high self-diffusion coefficients had previously been observed for water and alkanes in partially filled porous materials 23, 24. Such a phenomenon has generally been attributed to the fast interphase exchange between the vapour and condensed phases within the confining volume. Nevertheless, although it is well known that the critical point of the vapour-liquid coexistence in simple fluids is shifted to lower temperatures in confined environments 25, 26, these arguments do not explain the high mobility of glycerol due to its negligible vapour pressure at the studied temperatures. It was hypothesized that the perturbation in the translational molecular motion was generated by a disruption in the hydrogen bond network of the liquid due to topological defects in the solid substrate 22. Previous computer simulation studies of glycerol in fully saturated cylindrical channels of hydroxylated silica have however demonstrated that confinement induces the classical effects seen for simple van der Waals glass-forming liquids, including structural heterogeneities and a dramatic slowing down in the overall relaxation dynamics 27.
Inspired by such an unsolved conundrum, we herein investigate the structure and dynamics of glycerol in realistic slit-shaped pores of -Al2O3 by performing atomistic MD simulations. In particular, we focus our attention on the effects of pore size and liquid concentration. Our results suggest that a necessary condition for the enhancement in the molecular diffusion over translational degrees of freedom is the partial saturation of the pores. In such conditions, the formation of interfaces with vacuum regions is found to profoundly affect the kinetics of breaking and re-formation of hydrogen bonds.
2 Computational Methods
2.1 Models
Classical MD simulations were performed using atomistic-scale representations of glycerol and -Al2O3 crystals. Interactions of glycerol were described via inter- and intra-molecular potentials of the OPLS/AA force-field family 28. In particular, we adopted the refined parameters by Caleman et al. 29, which allow for an accurate reproduction of structural and dynamical properties of the condensed phase over a wide range of thermodynamic state points.
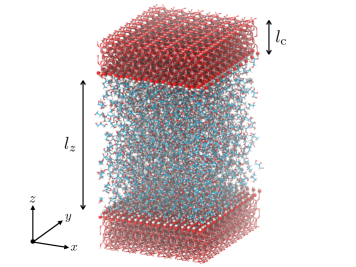
The crystallographic morphology of bulk -Al2O3 due to Digne et al. 30 was employed to construct the crystal structure. More specifically, the unit cell, which is comprised of 16 Al atoms and 24 O atoms, was replicated into a relatively large crystal supercell of dimensions , with Å, Å, and Å. This finite crystal size offers a reasonable balance between exposed surface area ( ) and thickness ( Å) while maintaining a computationally affordable number of atomic sites. In order to create a realistic surface structure, the crystal was cut along the (100) crystallographic facet, which is one of the main surfaces exposed by -Al2O3 nanocrystals. The final fully-hydroxylated surface of the crystal model contained OH groups per square nanometer with the OH bond vectors aligned in the direction normal to the surface. In order to mimic slit-shaped pore geometries, two identical layers of the solid substrate were placed in front of each other at a mutual distance along the direction of the simulation box. Different distances between the outermost surface H atoms of specularly symmetric crystalline -alumina layers were considered: 20, 40 and 60 Å. These inter-wall distances lie within the range of the typical pore dimensions of -Al2O3 nanocrystals 22. Since the systems were simulated under three-dimensional periodic boundary conditions, an extra empty gap of thickness Å was considered between the non-hydroxylated faces of the crystals in order to prevent long-range electrostatic interactions between periodic images of the primary slab. A pictorial representation of the model system is presented in Fig. 1.
Crystal atoms were treated as stationary (rigid) charged Lennard-Jones (LJ) sites with parameters taken from the CLAYFF force-field 31. By effectively freezing the crystal atoms, we make the following assumptions: (i) the rotation and translation of the crystals is negligible within the timeframe of a simulation run; and (ii) the orientation in which we freeze the crystal surface atoms plays a minor role in determining the properties of the interfacial glycerol molecules. LJ parameters for unlike interactions between glycerol and -Al2O3 were determined via geometric mixing rules as prescribed by Striolo and coworkers 32.
Although the classical atomistic model adopted here allows for the study of complex liquid-solid interactions, such as hydrogen-bonding, it neglects possible changes of the bonding nature, including chemisorption events. Nevertheless, a more detailed description based on quantum-mechanical calculations is impractical considering the system size and time-scale investigated in the present study. Other interesting alternatives such as the ReaxFF methodology 33, which approximates chemical reactivity with a classical treatment, remain computationally expensive.
2.2 Simulation Details
Glycerol molecules were initially distributed randomly between the two fully-hydroxylated -Al2O3 crystalline layers, so as to retrieve the equilibrium density of the bulk fluid, g cm-3, obtained from isothermal-isobaric simulations of the bulk liquid phase at K and bar. Additionally, in order to study the effect of nanopore saturation at each confinement length , different confinement concentrations, , have been investigated. The confinement concentration, which can be regarded as the liquid concentration in the slit-shaped pore, is calculated as
| (1) |
where , and are the number of glycerol molecules, glycerol molecular weight and Avogadro’s number, respectively. In particular, we studied systems with g cm-3. The number of glycerol molecules in each simulation is given in Table 1.
IIn the first stage, high-energy structures were relaxed by applying the steepest descent method. Subsequently, MD simulations of the confined systems under three-dimensional periodic boundary conditions were performed in the canonical ensemble () at K using the GROMACS 5.0.4 package 34. The classical equations of motion were numerically integrated using the leapfrog algorithm with a time step of 2 fs. The Nosé-Hoover thermostat 35, 36 with a relaxation constant of 0.5 ps was employed in order to control temperature fluctuations. The global cut-off for non-bonded (dispersion and electrostatic) interactions was set to the OPLS/AA value of Å. Due to the slab geometry with clearly defined interfaces, standard analytical tail corrections to the energy and pressure for bulk systems were neglected. Long-range electrostatics was handled using the particle mesh Ewald (PME) method 37. For efficiency purposes, all bond-lengths in the glycerol molecules were constrained to their equilibrium values using the LINCS algorithm 38, applying two iterations for a correct energy conservation. Structural and dynamical properties were calculated from long trajectories of a duration of 100 ns containing thermalized configurations.
| (g cm-3) | VLI Formation | ||
|---|---|---|---|
| 60 | 442 | 0.4 | Yes |
| 663 | 0.6 | Yes | |
| 885 | 0.8 | Yes (bubble) | |
| 1106 | 1.0 | Yes (bubble) | |
| 1394 | 1.2 | No | |
| 40 | 295 | 0.4 | Yes |
| 442 | 0.6 | Yes | |
| 590 | 0.8 | Yes (bubble) | |
| 738 | 1.0 | Yes (bubble) | |
| 930 | 1.2 | No | |
| 20 | 147 | 0.4 | Yes |
| 221 | 0.6 | Yes | |
| 295 | 0.8 | Yes | |
| 369 | 1.0 | Yes (bubble) | |
| 464 | 1.2 | No |
3 Results
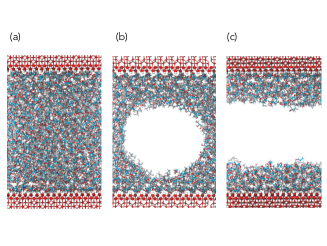
In this section, we show that hydrogen-bonding networks play an important role in the translational dynamics of glycerol and are influenced by confinement. However, we will see that the enhanced mobility of glycerol under confinement is not simply the consequence of the disruption of its intermolecular hydrogen-bonding network resulting from the presence of the pore walls as suggested in Ref. 22. Our results unambiguously indicate that the interactions established at the solid-liquid interface and the degree of confinement play both a key role in determining the glycerol dynamics in -Al2O3 nanopores. In particular, the degree of confinement depends on the pore size and on the glycerol concentration in the pore. The former is quantified in terms of distance, , between two -Al2O3 surfaces facing each other as shown in Fig. 1; whereas the latter, , is the mass of glycerol in the volume available between these solid surfaces (see Eq. 1) and measures the level of pore saturation. In Fig. 2, one can appreciate the effect of reducing on the distribution of glycerol in the pore for the specific case of Å. Upon decreasing the relative confinement concentration from 1 to 1/2 (left to right frame in Fig. 2), we detect the nucleation of a low-density cavity (or bubble), which eventually leads to two fully separated liquid films adsorbed at the crystal surfaces and entrapped between a solid-liquid and a gas-liquid interface. Given the low vapour pressure of glycerol, no molecules were detected in the gas phase, which for practical purposes can be effectively considered as vacuum.
The value of the confinement concentration at which bubbles and separated films are observed, strictly depends on the pore size or, equivalently, on the confinement length , as reported in Table 1. Both and have a remarkable impact on the distribution of glycerol in the pore and on its ability to form structural correlations over the length scales imposed by the degree of confinement. To gain a more detailed insight into the effect of the degree of confinement, in Fig. 3 we present the glycerol mean local density profiles along the direction perpendicular to the solid surfaces at and Å. A fully saturated pore, where , is characterized, in the vicinity of the solid-liquid interface, by strong spatial correlations that are propagated, less and less intensively, to the glycerol molecules approximately located in the center of the pore, where , relatively far from the solid surface. In this case, no bubbles or vacuum-liquid interfaces are observed. However, upon decreasing the glycerol confinement concentration, it is not possible to fully permeate the pore, which remains unsaturated, and a low-density cavity starts to form. The threshold value of the confinement concentration, , at which the formation of such a vacuum domain is observed, is determined by the pore size. In general, at all pores exhibit two fully separated liquid films and a clear vacuum region, regardless of their size.
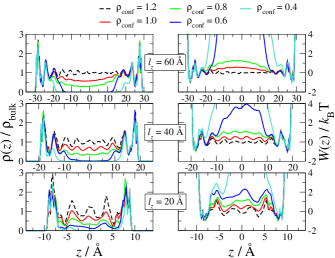
An interesting feature observed at all the confinement lengths studied here, is that changes in the liquid concentration barely affect the shape of the density distributions close to the surface. Taking as a reference the case of Å, the first two large peaks in remain effectively unaltered in the whole range of pore saturations. This indicates that even at partial saturation, the correlations of glycerol with -Al2O3 surface atoms are still very significant. Based on the suppression of the oscillations in the density profiles, the influence of the substrate can be considered to be effective on glycerol molecules lying within a distance of approximately Å from the solid surface.
The strong spatial dependency observed in the molecular packing of the fluid is the result of the local free energy, , of transferring a glycerol molecule from the bulk phase to a slab centred at position 39:
| (2) |
where is the Boltzmann’s constant. The equilibrium local density distribution, , is measured by the probability of finding a glycerol molecule, with center of mass in , in the interval (, ). This probability is proportional to a constrained partition function, , which reads
| (3) |
In particular, . In Fig. 3, we report for all the systems studied here. The presence of significant energy barriers in in the vicinity of the crystal suggests that glycerol molecules are highly constrained in specific regions of space and rarely diffuse to contiguous layers at the studied temperature. The first minima, which exceeds the mean attractive energy in the bulk fluid by approximately 1 reflects the favourable interactions established with the solid. This explains in part, the formation of the fully separated adsorbed liquid films at g cm-3.
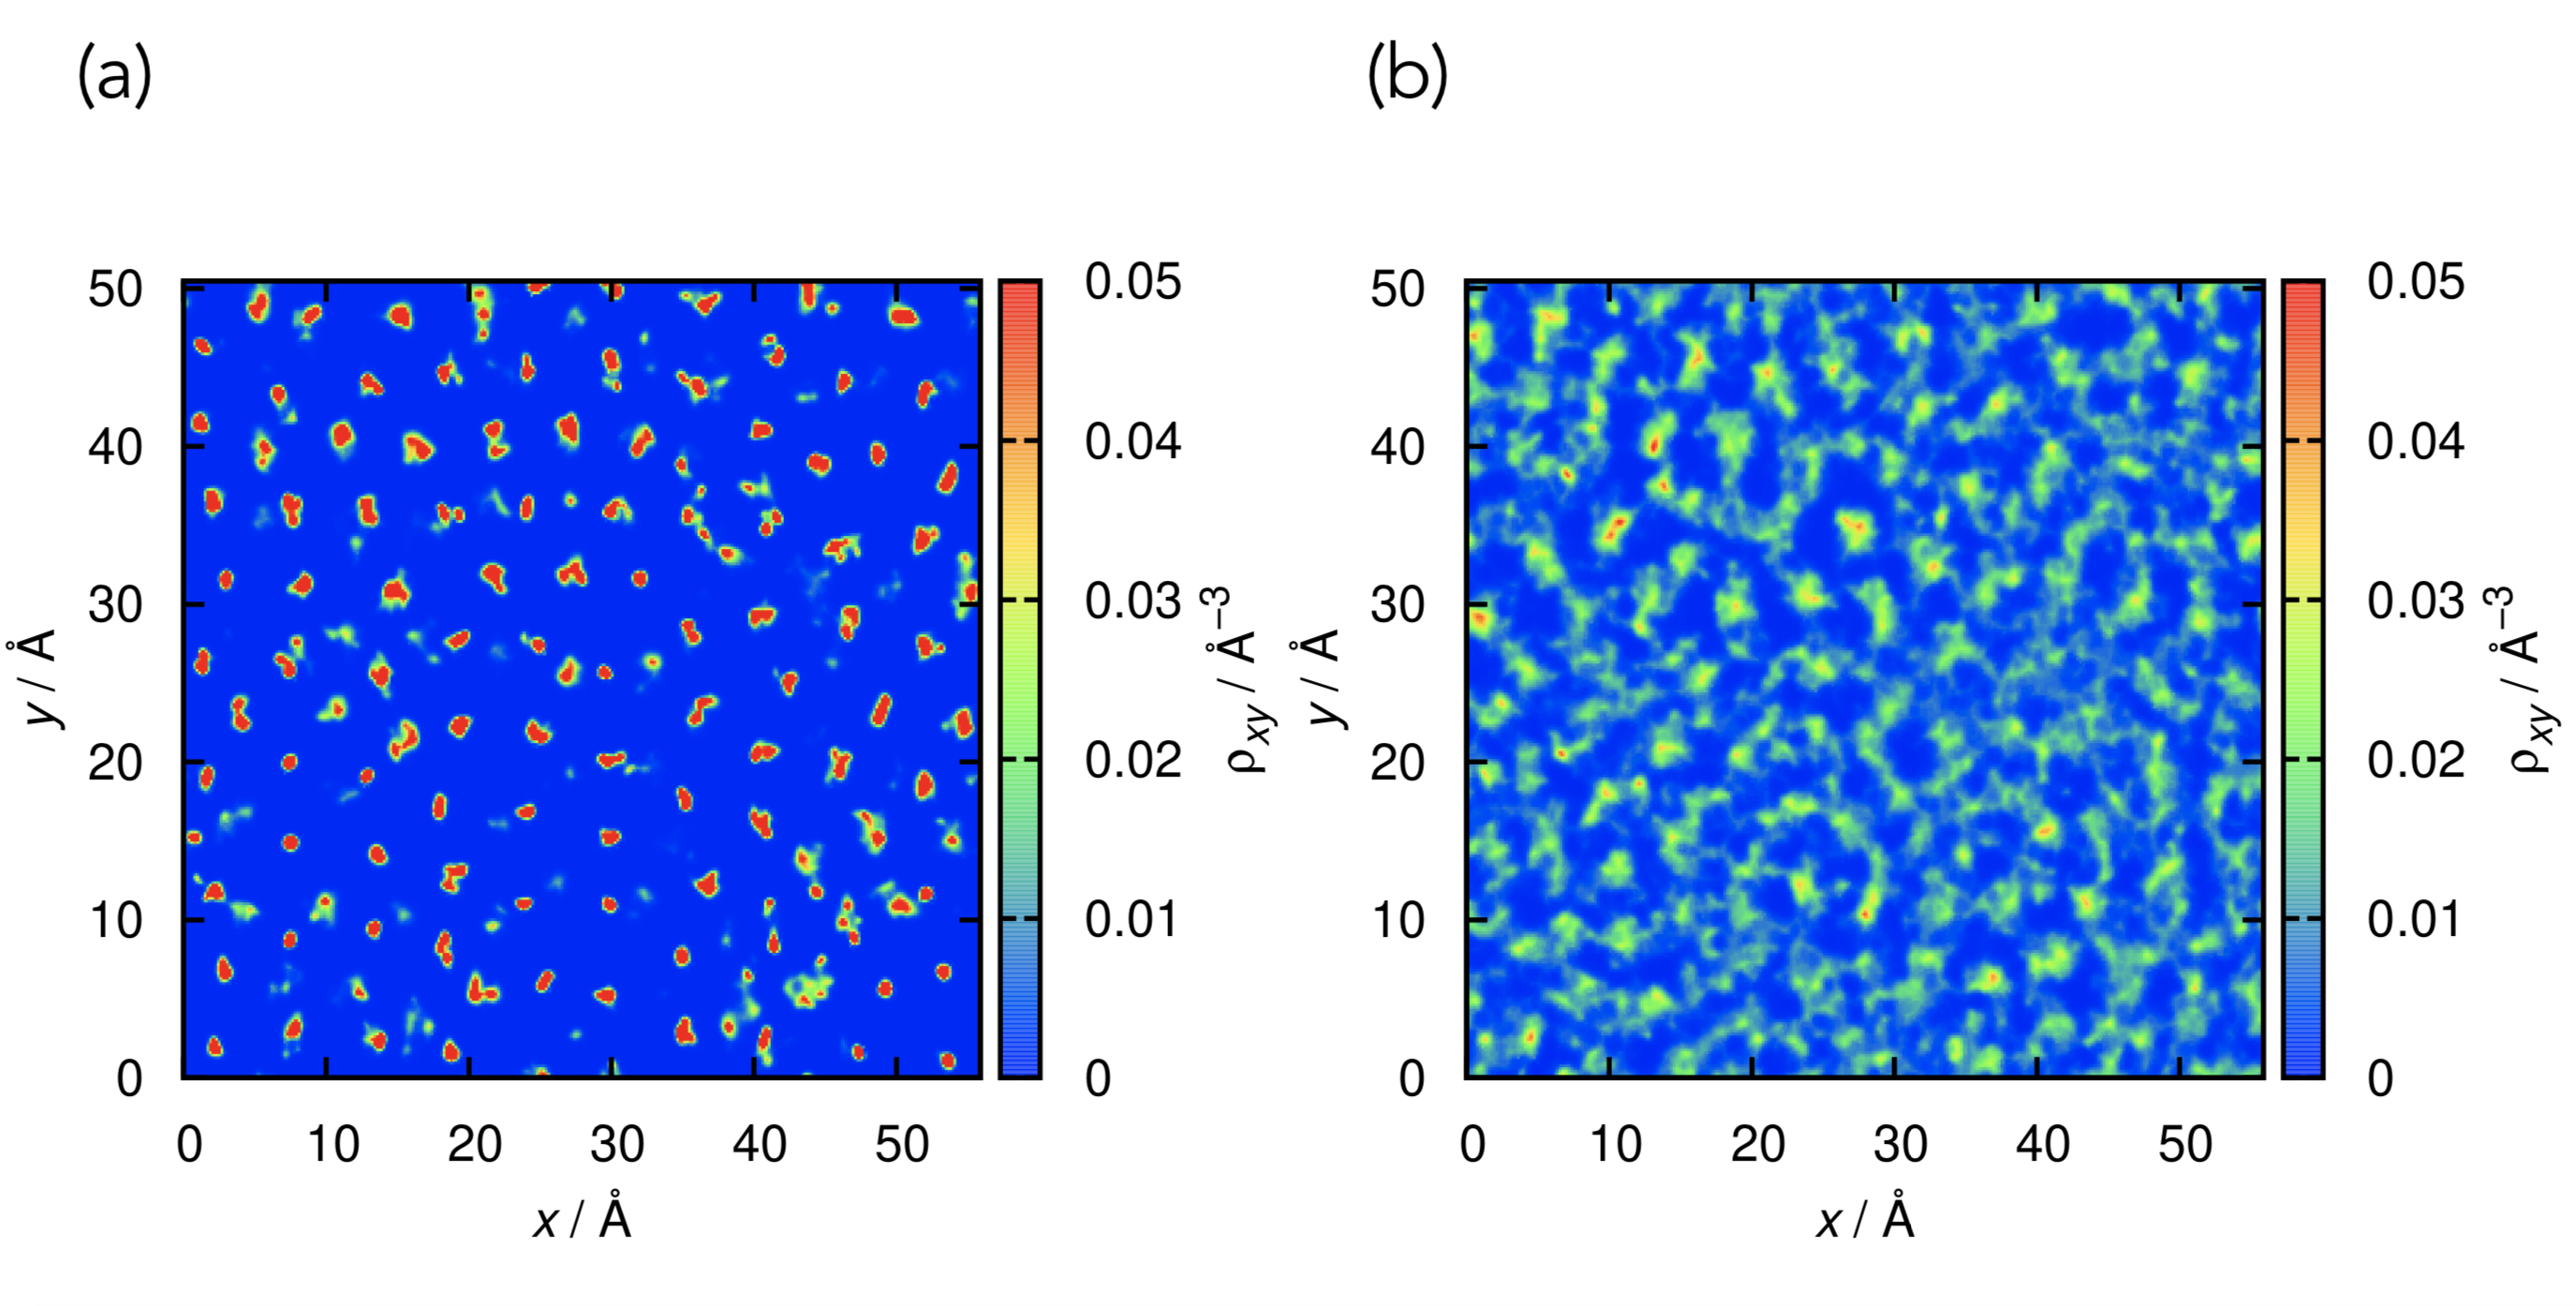
The solid-liquid spatial correlation can also be appreciated from the two-dimensional probability density maps of the glycerol’s central carbon, , reported in Fig. 4. In particular, the left frame refers to the layer of glycerol molecules adsorbed on the solid surface and indicates the presence of specific preferential locations that these molecules are more likely to occupy. Therefore, not only is a partial, but no-negligible, ordering found in the direction perpendicular to the interface, but also in the plane components () parallel to it. Similarly to the perpendicular spatial correlations in the liquid, also the in-plane spatial correlations become very weak closer to the center of the pore (right frame of Fig. 4). The strongly localized molecular positions of glycerol found in the adsorbed layer clearly indicate the presence of energetic interactions able to overcome the penalty due to the loss of configurational entropy. We attribute this in part to the propensity of glycerol to form highly-directional hydrogen bonds with the -Al2O3 hydroxyl groups.
With such a detailed insight into the spatial arrangement of glycerol in -Al2O3 nanopores, we now investigate how the glycerol hydrogen-bond network is being affected by the formation of solid-liquid and vacuum-liquid interfaces. To this end, we first need to introduce a geometric criterion defining the conditions for the formation of a hydrogen-bond. Following the suggestion by Busselez and coworkers, who studied the dynamics of glycerol in cylindrical silica nanopores, two hydroxyl groups form a hydrogen bond if the distance between their oxygen atoms is smaller than 3.5 Å and simultaneously, the angle between two hydroxyl groups OHO 27. In agreement with these authors’ MD simulation results, we find that the average number of hydrogen bonds per OH group in the unconstrained liquid phase is . This value changes if glycerol is confined in -Al2O3 as reported in Fig. 5, where the reduced number of hydrogen bonds per OH group is reported as a function of for different pore sizes.
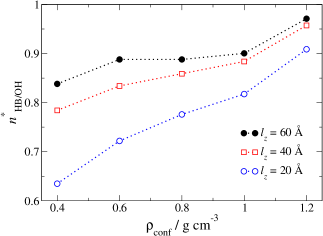
The trend observed in Fig. 5 unveils the remarkable effect of the degree of confinement on the disruption of the the hydrogen-bonding network of glycerol. At such a disruption is not especially significant, with . In this case, the reduction in is caused exclusively by the presence of the -Al2O3 surfaces. Although this result conciliates with the suggestion by D’Agostino et al. 22, the reduction of glycerol-glycerol hydrogen bonds is partially compensated by the presence of hydrogen bonds between glycerol and the hydroxyl groups in the surface of -Al2O3. In fact, it was observed that all the glycerol molecules lying in the contact layer have their three OH groups pointing to the surface and forming hydrogen bonds with the -Al2O3 hydroxyl groups. Despite the orientational restrictions imposed by the solid surface, it is important to note that the number of glycerol-glycerol hydrogen-bonds would be smaller if there were no glycerol-glycerol hydrogen-bonds in the contact layer as this would lead to approximately , , and for the pores of , and Å respectively. Therefore, some of the molecules in the contact layer are forming hydrogen-bonds with other glycerol molecules.
The disruption becomes more relevant at lower confinement concentrations, especially if the confinement length is particularly small ( Å). In other words, if the pore is not fully saturated, the average number of hydrogen bonds per OH group in liquid glycerol significantly decreases, due to the formation of a low-density cavity or two separated liquid films that create a vacuum-liquid interface. The minimum in is found at the lowest glycerol concentration due to the large interfacial area between the liquid films and vacuum.
Thus, if there is an effect of the hydrogen-bond network on the dynamics of glycerol, then it must be reflected in the dependence of the glycerol diffusivity on the degree of pore saturation. To test the validity of this hypothesis, we have calculated the reduced self-diffusion coefficient of glycerol, , defined as the ratio between the self-diffusivity in the pore and the self-diffusivity in the unconstrained liquid bulk. However, due to the intrinsic anisotropy and spatial inhomogeneity in the confined fluid, neither the standard three-dimensional Einstein relation nor the Kubo relation over the whole confined volume would be suitable approaches 40. Therefore, has been calculated as the density-weighted average of the local parallel diffusion coefficient in finite slabs centered at different positions in the simulation box:
| (4) |
In particular, the two-dimensional parallel component of the diffusion coefficient in a given slab , defined by the spatial interval (,), reads
| (5) |
where is the two-dimensional position vector of a glycerol molecule in slab at time and is the survival probability for particles to remain in that slab (see Ref. 40). The brackets stand for an ensemble average over sample molecules and time origins . Earlier computational studies have demonstrated that the diffusion coefficient calculated by averaging the translational motion along the direction, , would provide the same qualitative results 40, 6. Consequently, even if the global effective three-dimensional diffusion coefficients could be somehow obtained without a decoupling in the translational degrees of freedom, they would (in principle) follow the same trend and be quantitatively similar to those obtained with Eq. 4. The resulting dependence of on the confinement concentration is reported in Fig. 6 for different confinement lengths.
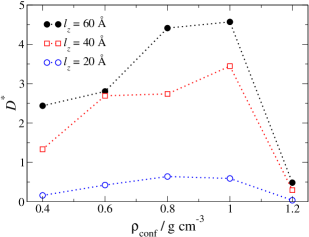
It is interesting to note that at (pore completely saturated), for any , suggesting a slower diffusion in the pores than in the bulk. By contrast, in pores that are partially saturated (), the reduced self-diffusion coefficient increases significantly, especially so at Å. As soon as a fully developed vacuum-liquid interface forms, decreases again, indicating that the disruption of hydrogen bonds in the liquid glycerol cannot be the only factor determining its dynamics. To unveil the missing piece of this puzzle, one should consider the spatial correlations discussed above and reported in Figs. 3 and 4. These correlations determine the diffusion profile along the direction that is shown in Fig. 7, where we report the local translational diffusion coefficients obtained via Eq 5.
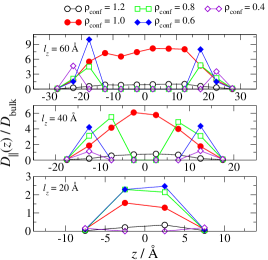
Each frame refers to a different pore size and, within each frame, we report the dependence of the parallel self-diffusivity on the position for different degrees of pore saturation. One can appreciate that the self-diffusion coefficient at the solid-liquid interface is especially low, with , but it increases significantly at increasing distance from the solid support. Additionally, at relatively low confinement concentrations, when a vacuum-liquid interface forms, no glycerol molecules are found within the vacuum region and therefore the self-diffusion coefficients are practically meaningless there. Pores that are completely filled show a similar behaviour, but the glycerol self-diffusion coefficient in there remains lower than that in the bulk across the whole pore volume. The case of very small pores ( Å) is especially interesting. While in Fig. 6 would indicate a reduced mobility as compared to that in the bulk, a deeper analysis reveals that this strictly depends on how far the glycerol molecules are from the -Al2O3 support (Fig. 7). The nucleation of the low-density cavity and subsequent formation of a vacuum-liquid interface deeply determine the disruption of the hydrogen-bond network and a significant increase of the glycerol mobility, which we do not observe in fully saturated pores, where a vacuum-liquid interface is not present.
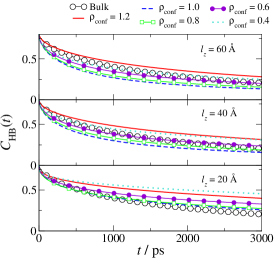
Finally, to better understand the effects of the interfaces on the glycerol dynamics, we have assessed the time fluctuations in the hydrogen-bonding network by evaluating the intermittent hydrogen-bond correlation function, , firstly introduced by Rapaport in the 1980s 41:
| (6) |
where is the binary hydrogen bond population operator, which equals unity if the hydroxyl groups and are hydrogen-bonded at time and zero otherwise. In particular, represents the conditional probability that the hydrogen bond between hydroxyls and , observed at time , still exists at time , regardless of whether bond-breaking events might have occurred meanwhile. Basically, a fast decay of would indicate a relatively short average life-time of a hydrogen bond. In Fig. 8, we present the correlation’s decay for different pore sizes at all confinement concentrations. For comparison, we also include the case of unconstrained bulk liquid. All the curves exhibit a similar time dependence, which can be approximated by an exponential decay. In addition, at Å and g cm-3, which provide the highest self-diffusivities in Fig. 5, displays a faster decays as compared to any other confinement concentration, including the case of the bulk fluid. By contrast, in smaller pores, the correlation decays slower than in the bulk at all times, confirming the above observations. We also calculated the correlation function for the glycerol-surface hydrogen bond kinetics and we found that the curves do not decay to zero in the whole simulated time. This conciliates with the observed suppression in the diffusion of glycerol adsorbed in the crystal surface (Fig. 7).
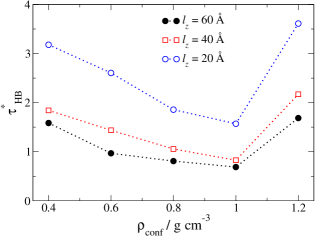
Finally, the average hydrogen bond lifetime, , was estimated from the reactive flux hydrogen-bond correlation function, , which is the time derivative of :
| (7) |
and by treating the hydrogen-bond breaking and re-formation as a reversible chemical reaction with well-defined rate constants 42. The dependence of , being normalized by the lifetime in the bulk, on the confinement concentration is reported in Fig. 9 at different confinement lengths. Overall, the results agree with those of Figs. 6 and 8. As a matter of fact, we note that for glycerol confined in pores with Å, the minimum in the ratio occurs at the where reaches its maximum value.
4 Conclusions
We have investigated the structure and dynamics of glycerol confined in -Al2O3 slit nanopores using atomistic MD simulations. As observed for simple liquids, the confinement of glycerol within hard geometric boundaries results in a spatially inhomogeneous molecular distribution. More specifically, in the vicinity of the solid surface, changes from a liquid-like to a crystal-like structure are promoted, due in part to the formation of hydrogen bonds with the hydroxyl groups of the -Al2O3 surface.
The dynamics of glycerol in fully saturated pores is primarly affected by the reduction of mobility at the solid-liquid interface, which is the result of a higher density and structural order in the contact layer than in the bulk liquid and the presence of hydrogen bonds between molecules in the contact layer and hydroxyl groups at the surface.
Pores that are not fully saturated exhibit a cavity, approximately located in their centre, that does not contain glycerol and causes a disruption of the hydrogen-bond network within the liquid, which in turns enhance the glycerol self-diffusion. The competition between the strong structural order at the solid-liquid interface and the disruption of hydrogen bonds far from it, leads to an overall self-diffusion that is faster than that in the liquid bulk. In particular, we found a significant enhancement in the self-diffusion of nanoconfined glycerol for pore sizes Å and confinement concentrations g cm-3.
The present study provides a fundamental guideline to understand recent experimental observations on the dynamics of glycerol in confined media 22, which is consistent with the dynamics of glycerol observed in thin films 43 and highlights the importance of liquid-gas interfaces in the dynamics of confined viscous fluids.
Conflicts of interest
There are no conflicts to declare.
Acknowledgements
The project leading to these results has received funding from the European Union’s Horizon 2020 research and innovation programme under the Marie Skłodowska-Curie grant agreement No 676045 (MULTIMAT). The authors acknowledge the assistance given by IT Services and the use of the Computational Shared Facility at the University of Manchester.
Notes and references
- Evans 1990 R. Evans, J. Phys. Condens. Matter, 1990, 2, 8989.
- Alcoutlabi and McKenna 2005 M. Alcoutlabi and G. B. McKenna, J. Phys. Condens. Matter, 2005, 17, R461.
- Christenson 2001 H. K. Christenson, J. Phys. Condens. Matter, 2001, 13, R95.
- Alba-Simionesco et al. 2006 C. Alba-Simionesco, B. Coasne, G. Dosseh, G. Dudziak, K. E. Gubbins, R. Radhakrishnan and M. Sliwinska-Bartkowiak, J. Phys. Condens. Matter, 2006, 18, R15.
- Chia et al. 2017 C. L. Chia, C. Avendaño, F. R. Siperstein and S. Filip, Langmuir, 2017, 33, 11257–11263.
- Mittal et al. 2008 J. Mittal, T. M. Truskett, J. R. Errington and G. Hummer, Phys. Rev. Lett., 2008, 100, 145901.
- Monson 2012 P. A. Monson, Microporous Mesoporous Mater., 2012, 160, 47–66.
- Travalloni et al. 2010 L. Travalloni, M. Castier, F. W. Tavares and S. I. Sandler, Chem. Eng. Sci., 2010, 65, 3088–3099.
- Martinez et al. 2007 A. Martinez, M. Castro, C. McCabe and A. Gil-Villegas, J. Chem. Phys, 2007, 126, 074707.
- Mashl et al. 2003 R. J. Mashl, S. Joseph, N. R. Aluru and E. Jakobsson, Nano Lett., 2003, 3, 589–592.
- Matsumoto et al. 2002 M. Matsumoto, S. Saito and I. Ohmine, Nature, 2002, 416, 409.
- Striolo et al. 2005 A. Striolo, A. A. Chialvo, K. E. Gubbins and P. T. Cummings, J. Chem. Phys, 2005, 122, 234712.
- Pissis et al. 1994 P. Pissis, D. Daoukaki-Diamanti, L. Apekis and C. Christodoulides, J. Phys. Condens. Matter, 1994, 6, L325.
- Debenedetti and Stillinger 2001 P. G. Debenedetti and F. H. Stillinger, Nature, 2001, 410, 259.
- Davidson and Cole 1951 D. W. Davidson and R. H. Cole, J. Chem. Phys., 1951, 19, 1484–1490.
- Root and Berne 1997 L. J. Root and B. J. Berne, J. Chem. Phys., 1997, 107, 4350–4357.
- Lunkenheimer et al. 1996 P. Lunkenheimer, A. Pimenov, M. Dressel, Y. G. Goncharov, R. Böhmer and A. Loidl, Phys. Rev. Lett., 1996, 77, 318.
- Chelli et al. 1999 R. Chelli, P. Procacci, G. Cardini and S. Califano, Phys. Chem. Chem. Phys., 1999, 1, 879–885.
- Blieck et al. 2005 J. Blieck, F. Affouard, P. Bordat, A. Lerbret and M. Descamps, Chem. Phys., 2005, 317, 253–257.
- Buntkowsky et al. 2018 G. Buntkowsky, M. Vogel and R. Winter, Z. Phys. Chem., 2018, 232, 937–972.
- Kilburn et al. 2008 D. Kilburn, P. E. Sokol, V. García Sakai and M. Ashraf Alam, Appl. Phys. Lett., 2008, 92, 033109.
- D’Agostino et al. 2012 C. D’Agostino, J. Mitchell, L. F. Gladden and M. D. Mantle, J. Phys. Chem. C, 2012, 116, 8975–8982.
- D’Orazio et al. 1989 F. D’Orazio, S. Bhattacharja, W. P. Halperin and R. Gerhardt, Phys. Rev. Lett., 1989, 63, 43.
- Valiullin et al. 1997 R. R. Valiullin, V. D. Skirda, S. Stapf and R. Kimmich, Phys. Rev. E, 1997, 55, 2664.
- Evans et al. 1986 R. Evans, U. Marini Bettolo Marconi and P. Tarazona, J. Chem. Phys., 1986, 84, 2376–2399.
- Dijkstra 1997 M. Dijkstra, J. Chem. Phys., 1997, 107, 3277–3288.
- Busselez et al. 2009 R. Busselez, R. Lefort, Q. Ji, F. Affouard and D. Morineau, Phys. Chem. Chem. Phys., 2009, 11, 11127–11133.
- Jorgensen et al. 1996 W. L. Jorgensen, D. S. Maxwell and J. Tirado-Rives, J. Am. Chem. Soc., 1996, 118, 11225–11236.
- Caleman et al. 2011 C. Caleman, P. J. van Maaren, M. Hong, J. S. Hub, L. T. Costa and D. van der Spoel, J. Chem. Theory Comput, 2011, 8, 61–74.
- Digne et al. 2004 M. Digne, P. Sautet, P. Raybaud, P. Euzen and H. Toulhoat, J. Catal., 2004, 226, 54–68.
- Cygan et al. 2004 R. T. Cygan, J. Liang and A. G. Kalinichev, J. Phys. Chem. B, 2004, 108, 1255–1266.
- Phan et al. 2013 A. Phan, D. R. Cole and A. Striolo, J. Phys. Chem. B, 2013, 117, 3829–3840.
- Van Duin et al. 2001 A. C. T. Van Duin, S. Dasgupta, F. Lorant and W. A. Goddard, J. Phys. Chem. A, 2001, 105, 9396–9409.
- Van Der Spoel et al. 2005 D. Van Der Spoel, E. Lindahl, B. Hess, G. Groenhof, A. E. Mark and H. J. C. Berendsen, J. Comput. Chem., 2005, 26, 1701–1718.
- Nosé 1984 S. Nosé, Mol. phys., 1984, 52, 255–268.
- Hoover 1985 W. G. Hoover, Phys. Rev. A, 1985, 31, 1695.
- Darden et al. 1993 T. Darden, D. York and L. Pedersen, J. Chem. Phys., 1993, 98, 10089–10092.
- Hess et al. 1997 B. Hess, H. Bekker, H. J. C. Berendsen and J. Fraaije, J. Comput. Chem., 1997, 18, 1463–1472.
- Marrink and Berendsen 1994 S. J. Marrink and H. J. C. Berendsen, J. Phys. Chem., 1994, 98, 4155–4168.
- Liu et al. 2004 P. Liu, E. Harder and B. J. Berne, J. Phys. Chem. B, 2004, 108, 6595–6602.
- Rapaport 1983 D. C. Rapaport, Mol. Phys., 1983, 50, 1151–1162.
- Luzar and Chandler 1996 A. Luzar and D. Chandler, Nature, 1996, 379, 55.
- Capponi et al. 2010 S. Capponi, S. Napolitano, N. R. Behrnd, G. Couderc, J. Hulliger and M. Wübbenhorst, J. Phys. Chem. C, 2010, 114, 16696–16699.