Phase stability transfer across the optical domain using a commercial optical frequency comb system
Abstract
We report the frequency noise suppression of a diode laser by phase-locking it to a cavity-stabilized laser, using a commercial optical frequency comb. By phase-locking the frequency comb to the narrow reference at telecom wavelength we were able to phase-coherently distribute the reference stability across the optical spectrum. Subsequently, we used one of the comb teeth as an optical reference for a external cavity diode laser. We demonstrated the locked laser frequency stability by comparing it to an independent cavity-stabilized laser of the same wavelength and by performing spectroscopic measurements on a dipole-forbidden narrow optical transition in a single 88Sr+ ion. These measurements indicated a fast laser-linewidth of and , respectively.
I introduction
Narrow linewidth laser systems, exhibiting high frequency stability, are an important tool in many scientific fields, such as precision spectroscopy and optical atomic clocksLudlow et al. (2015); Nicholson et al. (2012); Hinkley et al. (2013), tests of fundamental physicsChou et al. (2010); Eisele et al. (2009) and gravity wave detectionAbbott et al. (2016).
Over the years, several technologies and methods were developed for the generation of stable optical references. The most common scheme involves phase-locking a laser source to a high-finesse and ultra stable optical cavity using electronic feedback in a Pound-Drever-Hall configurationDrever et al. (1983). Such laser systems were shown to exhibit fractional frequency instabilities of a few times in seconds of integration Swallows et al. (2012); Alnis et al. (2008); Young et al. (1999); Jiang et al. (2011), ultimately limited by the thermal instability of the cavity length Kessler et al. (2012a). Advanced cavities, developed to deliver enhanced frequency stability, are often wavelength-specific and cumbersome to setup Kessler et al. (2012b). Being so, the motivation to distribute the phase coherence of a cavity-stabilized laser to other lasers in different domains of the optical spectrum arises naturally.
The transfer of stability between two narrow-linewidth lasers was demonstrated with the utilization of an optical frequency comb as a coherent bridge over the optical spectral gap Hagemann et al. (2013); Yamaguchi et al. (2012); Nicolodi et al. (2014); Scharnhorst et al. (2015); Su et al. (2015); Akamatsu et al. (2013); Inaba et al. (2013); Akamatsu et al. (2012); Yamanaka et al. (2015); Nemitz et al. (2016); Yamaguchi et al. (2011). The heart of the scheme relies on exploiting the correlations between distinct discrete frequency modes of the frequency comb, usually referred to as frequency teeth. The relation between the comb repetition rate , the carrier to envelope phase shift and the nth comb mode Ye and Cundiff (2005) is,
| (1) | ||||
It therefore follows that by phase locking to a spectrally narrow optical reference, such as a cavity-stabilized clock laser, each other comb mode will inherit the master laser phase noise spectrum, with its power scaled by ; This is provided that the lock is sufficiently fast, the carrier-envelope offset frequency is independently stabilized and any superimposed extra-cavity noise has sufficiently low powerNewbury and Swann (2007). Early frequency combs had limited servo bandwidth on the repetition frequency, resulting in poor tracking of the optical frequency reference at high frequencies. Therefore, in early demonstrations of this method, other techniques were incorporated to combat the fast phase noise of the locked comb modes, most commonly pre-stabilization of the target laser to an external optical cavity Hagemann et al. (2013); Yamaguchi et al. (2012) or establishing a fast feed-forward scheme Stenger et al. (2002) to eliminate the correlated comb noise Grosche et al. (2008); Nicolodi et al. (2014). This scheme was also used with high bandwidth frequency combs, due to excessive phase-noise at high-Fourier components of each comb mode Scharnhorst et al. (2015). Using custom built combs, exhibiting high servo bandwidth, low residual phase noise and sub-Hz linewidthsFang et al. (2013); Nakajima et al. (2010); Ohmae et al. (2017), high bandwidth phase stability transfer for locking ECDL lasers was demonstrated Su et al. (2015); Akamatsu et al. (2013); Inaba et al. (2013); Akamatsu et al. (2012); Yamanaka et al. (2015); Nemitz et al. (2016).
In this work we use a low-noise commercial comb system (Menlo Systems GmbH; FC1500-250-ULN) to transfer the phase stability of a commercially available telecom laser (Stable Laser Systems; SLS-INT-1550-200-1) to an external cavity diode laser operating at a wavelength of . By comparing this laser against a different, cavity-stabilized, laser at we were able to estimate the laser fast-linewidth to be , reaching a fractional frequency stability of (corresponding to sub- drifts) after . We later Used this laser for a spectroscopic measurement of the optical clock transition in 88Sr+ trapped ion, as a further examination of the stabilized laser spectral properties.
II experiment
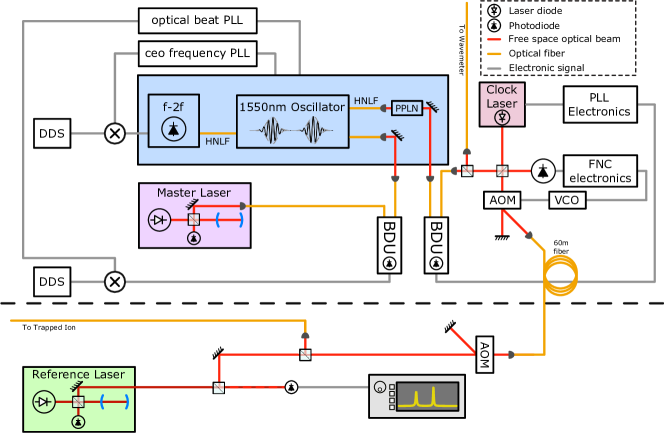
Our experimental setup is outlined in Fig. 1, including the phase-transfer scheme and the set-up used for comparisons of the comb-stabilized laser at with a cavity-stabilized laser operating at the same wavelength (hereafter referred to as the reference laser), and with the clock transition of a single trapped 88Sr+ ion.
The master laser, a commercial laser source at is Pound-Drever-Hall locked to an Ultra-Low Expansion (ULE) glass, high finesse, Fabry-Perot cavity, with servo bandwidth of approximately . The comb, an erbium-doped fiber mode-locked laser oscillator, outputs a comb spectrum centered around , which is then amplified and split into several output ports. The carrier-envelope offset frequency, , is locked using an f-2f interferometer Ye and Cundiff (2005). Small fractions (1mW) of the master laser and comb main port outputs are injected into a fiber-coupled commercial beat detection unit (BDU) through optical fibers. We employ a PLL scheme to lock the BDU output, which is the beat signal of the master laser and the closest comb tooth, to a GPS referenced DDS signal. The feedback loop controls with a servo bandwidth, transferring the phase stability of the master laser to the comb.
The clock laser is an External-Cavity Diode Laser (ECDL). The laser output power is split into two paths, the first is coupled to a long fiber connected to another BDU, while the second is coupled into a fiber through a fiber noise-cancellation system. This long fiber leads to another lab where the comparison with the reference laser and the ion spectroscopy measurements have been carried out.
Comb light going into a third optical output port is fed into a nonlinear optical fiber, increasing the spectral width of the pulse so that a large portion of the optical power is spread around . It is then frequency doubled to produce a phase coherent comb spectrum at , which is coupled using a short fiber into the other port of that second BDU. The output beat at is band-pass filtered, frequency divided and compared to a GPS referenced oscillating signal. Using a PLL scheme with a digital frequency phase detector we then control a fast current modulation port of the laser diode to lock the two lasers beat, effectively reducing the laser phase noise while transferring the phase stability of the master laser to the clock laser.
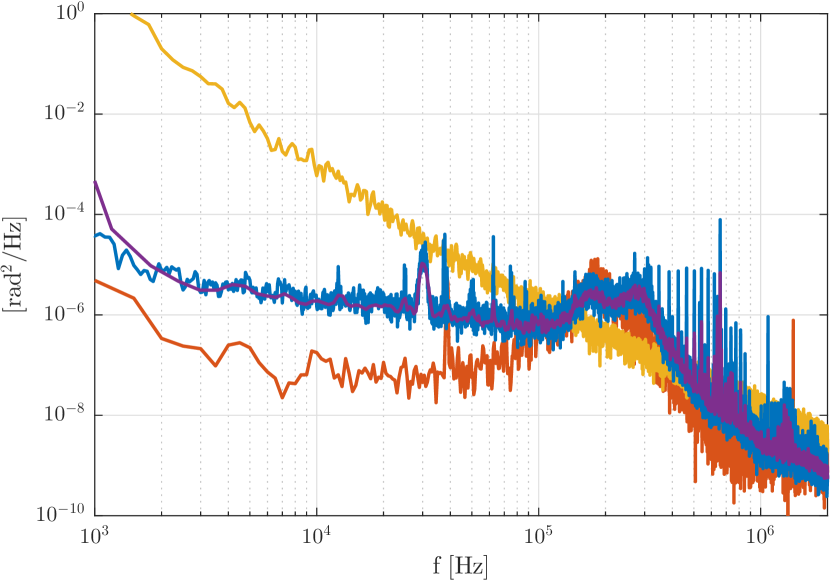
To characterize the performance of our locking scheme we performed frequency beat measurements between the comb and clock lasers with the reference laser. In each case we recorded the oscillating beat signal and performed all other data processing on it. We extracted the phase noise signal from the time-dependent oscillating signal by implementing an all-digital phase noise measurement (detailed in Angrisani et al. (2001)). We then used the phase noise signal to estimate the underlying power spectral density (PSD). In such way we characterized the phase noise of the comb spectral tooth at 674nm, the free running clock laser and locked clock laser. These measurements are presented in Fig. 2.
We first inspected the phase noise signal of the comb tooth at , extracted from the beat with the reference laser. Since the reference laser is known to have a fast linewidth narrower than , we could attribute all fast phase noise in the beat signal to the frequency comb, hereby characterizing its fast phase modulations. The red solid line in Fig. 2(a) shows the phase-noise PSD. A dominant feature it exhibits is the large increase in phase noise around . This large increase is the result of two contributions: The first contribution is that of the servo-bump of the control loop locking the comb repetition rate to the master laser, and the second is the servo bump of the master laser lock to the ULE cavity. The master laser servo bumps were independently observed in a self-heterodyne measurement of the master laser. The contribution of the repetition rate servo bumps was observed in the optical comb lock error-signal. We estimate the RMS phase noise, integrated over - , to be 0.7 radian.
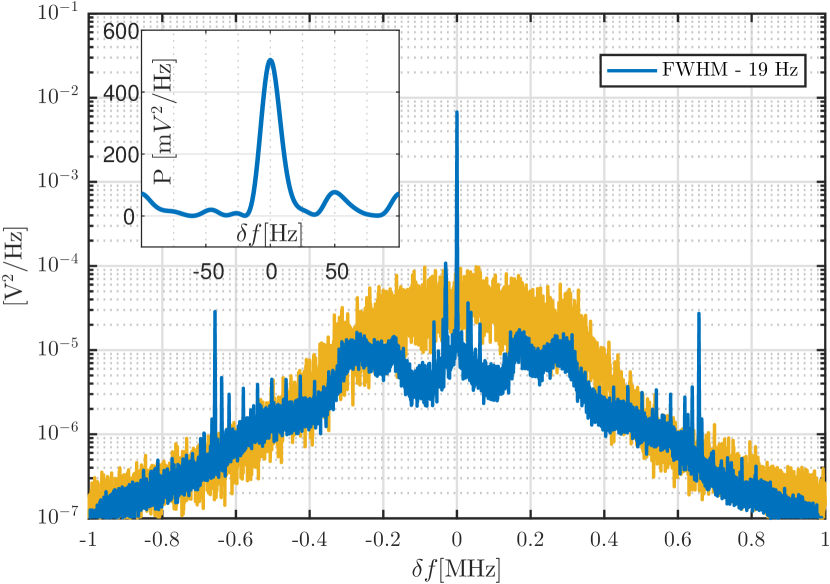
Next, we recorded the beat signal of the reference and clock lasers. We took two measurements; One in which the clock laser was free running and another in which it was locked to the comb tooth. The yellow (blue) solid line in Figure 2(b) is the PSD of the free running (locked) beat signal. It is clear that when the clock laser is locked, a substantial amount of the signal energy is concentrated around the central peak, here evaluated to be below the resolution limit, whereas for the free running signal the energy is spread over a larger band. The inset in Fig. 2(b) shows the same PSD, filtered with a band-pass filter and integrated over a time corresponding to a Fourier limit of . The full-width-half-max of the PSD signal is , placing a lower bound on the relative stability of the reference and the clock lasers.
To appreciate the spectral properties of the residual phase noise we inspected the PSD of the extracted phase noise signal. The yellow (blue) solid-line in Fig 2(a) is the extracted phase noise PSD of the free-running (locked) clock laser and reference laser beat. The lock bandwidth is estimated to be roughly , limited by the clock laser modulation response. The master laser and comb servo bumps at around are therefore well within the loop bandwidth and are hence transferred to the clock laser from the frequency comb. Other apparent features are frequency spikes in the and the frequency bands, both are likely due to electric noise in the lab ground signal, which we where unable to reduce. We measured the RMS phase noise of the locked clock laser, integrated over the same band as above, to be 2.2 radians; i.e. roughly three times larger than that of the comb tooth.
To further test the spectral properties of our clock laser we used it to drive the electric-quadruple optical clock transition of a single 88Sr+ ion, trapped in a linear Paul trap. Details of the Paul-trap apparatus and the lasers involved in trapping, cooling and imaging the ion can be found in Akerman et al. (2012). Optical clock transition spectroscopy serves to characterize the frequency noise spectrum between the clock laser and the electronic transition.
In a first experiment we performed Rabi nutation on the clock transition by tuning the laser to resonance and, at fixed laser power, scanning the pulse duration. We initiated our ion in the state, and performed 100 repetitions of each pulse time. We then used a maximum likelihood fit to extract the decay of Rabi oscillations. Rabi oscillation amplitude can decay due to different noise sources, including the laser-ion phase noise we measured in the beat measurements described above.
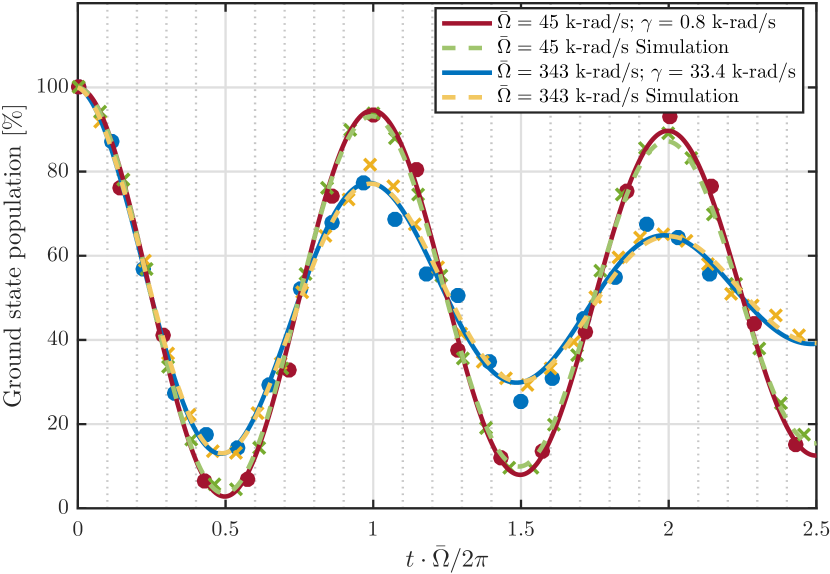
The data (solid dots) and fit (solid lines) of two such measurements are shown in Fig. 3. The two measurements differ by the clock laser optical power, corresponding to different Rabi frequencies; 45 kHz and 343 kHZ respectively. For ease of comparison the two nutation curves are shown on a time-axis which is normalized by the Rabi nutation period. As seen, the slower Rabi oscillations (red curve) maintain better coherence whereas fast Rabi oscillations (blue curves) de-cohere after 3 Rabi periods. This is a manifestation of the high-frequency laser phase noise inherited from the frequency comb.
To test whether this assumption is correct we performed a numerical simulation of the Rabi nutation experiment. We numerically generated a phase noise signal with the same PSD as was measured by the beat with the reference laser (purple solid line in Fig. 2(a)), and used it to realize a stochastic laser phase term in a monte-carlo simulation of two level system interacting with laser. The simulation results are shown by the light yellow and green crosses and dashed lines in Fig. 3. As seen, the laser phase noise is indeed the main source of decoherence. A similar effect was observed in Scharnhorst et al. (2015), where the authors have implemented a transfer oscillator scheme which mitigated the frequency comb induced phase noise and resulted in increased coherence for fast Rabi nutations.
We next turned to examine the ion-laser coherence at longer times by performing Rabi frequency scans. Here we used a -pulse corresponding to a Fourier limited spectral width.
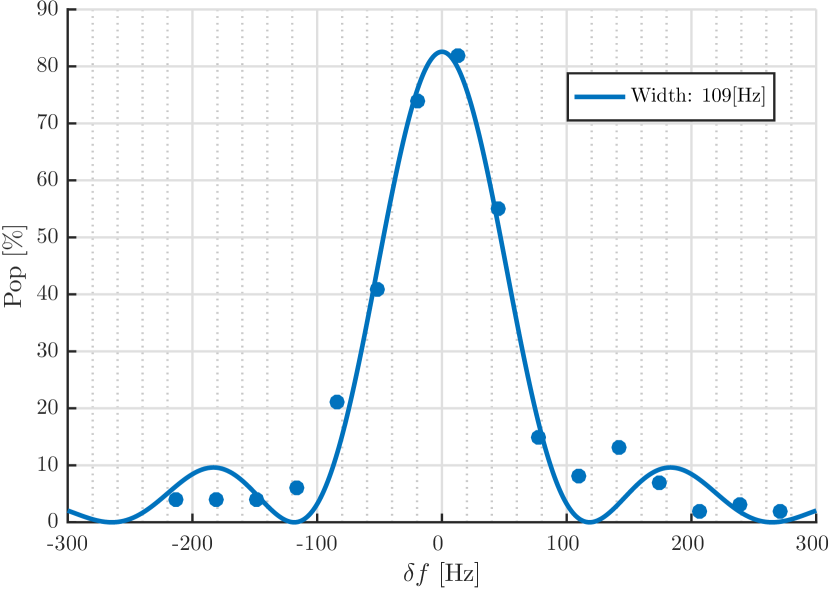
The results of a laser frequency scan across the ion resonance frequency are shown in Fig. 4. The FWHM of the Rabi resonance is () consistent with finite-time Fourier broadening. Longer pulses did not result further narrowing of the resonance indicating that at times longer than , we are limited by low frequency phase noise of the relative frequency between the laser and the ion.
To investigate whether this relative phase noise is dominated by the laser or the ion we converted to a different spectroscopic scheme. A dominant source of noise in the transition frequency is due to ambient magnetic noise via the first order Zeeman effect. To mitigate the resulting phase noise we performed a Ramsey spectroscopy experiment on the optical clock transition, incorporating a series of radio-frequency Magnetic Field Dynamical Decoupling (MFDD) pulses during the Ramsey wait time Akerman et al. (2015). The magnetic susceptibility of the transition frequency is,
| (2) | ||||
where and are the respective Zeeman sub-levels. The MFDD pulses coherently transfer the superposition in the or the manifold, between two chosen levels, such that the resulting susceptibilities in the two cases have opposite signs. The ratio of time intervals between subsequent MFDD pulses is chosen to match the ratio of susceptibilities of the two levels. Thus the accumulated phase due to (low frequency) magnetic field noise is reversed in each two-pulse cycle.
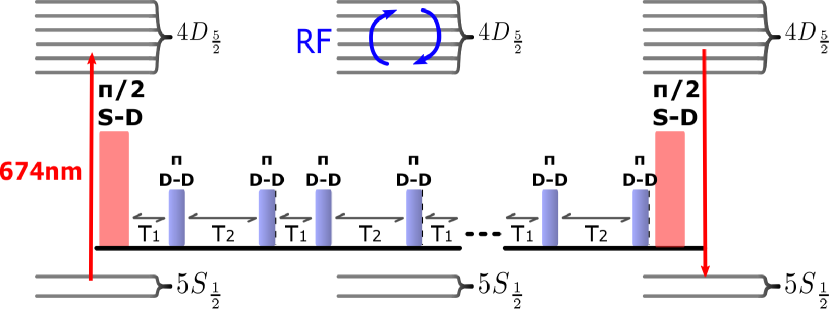
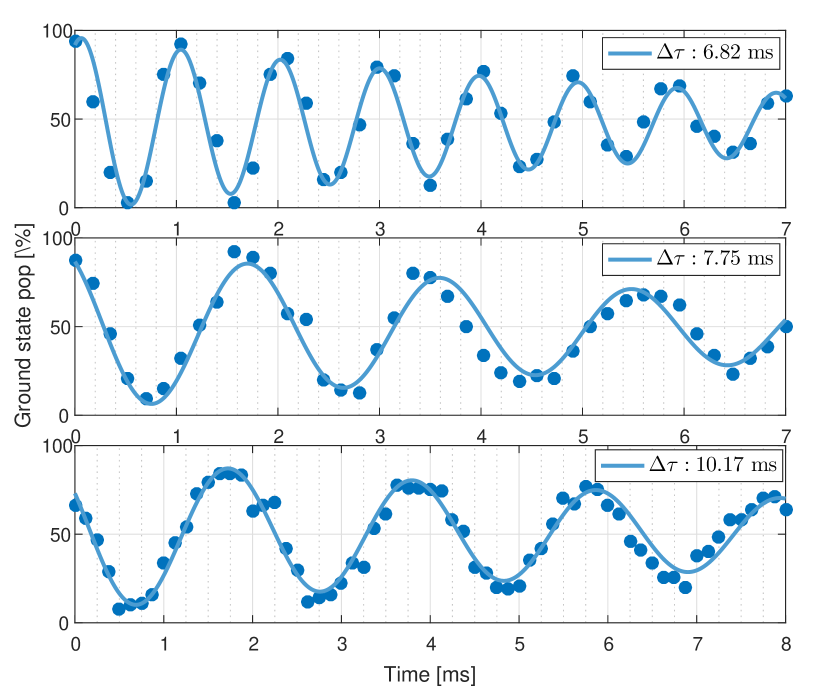
We performed a series of Ramsey spectroscopy experiments with different number of MFDD pulses. Figure 5 shows both a schematic time-sequence and the results for three such experiments, using zero, one and four MFDD pulses. We started with driving the ion on the transition, preparing an equal superposition of these states. The RF pulses where chosen to drive the transition in the manifold. The time between pulses was determined according to,
| (3) | ||||
Here, N is number of MFDD pulses and r is the susceptibility ratio according to Eq. (2). As seen, the three measurements show an increase in coherence time as the number of MFDD pulses increases. This is an indication for a significant contribution of magnetic field noise to the overall ion-laser phase noise comparison. Adding more than three pulses did not prolong our coherence time further, implying that the remaining phase noise is not due to magnetic field noise. Using four MFDD pulses we measured a coherence time of . Assuming a white frequency noise model, this corresponds to a laser linewidth of Agarwal (1978), relatively close to the obtained by beating the the clock laser and the reference laser.
III conclusion
In this work we demonstrated the transfer of phase stability of a stable, reference at telecom wavelength across the optical spectrum to visible light at . This scheme is especially useful when building systems in which the spectroscopy of multiple species and transitions requires narrow-linewidth lasers of multiple wavelengths. Here, the phase stability of a single reference can be conveniently distributed across optical spectral gas to multiple wavelengths. We measured the linewidth of our phase-stable laser at 674 nm by beating it against another, independently stabilized, narrow-linewidth laser and by performing precision spectroscopy of a single trapped-ion. Both measurements exhibited the linewidth reduction of the bare laser diode, with the two laser comparison indicating a linewidth after and the spectroscopic measurement a linewidth of after . On the other hand, the fast locking of the laser to the comb transferred the fast phase noise component resulting from the servo bumps of the comb to the master laser and the master laser to the reference cavity. We have shown that this high-frequency phase-noise imposes decoherence when performing fast operations on the ion.
This work was supported by the Crown Photonics Center, ICore-Israeli excellence center circle of light, the Israeli Science Foundation, the Israeli Ministry of Science Technology and Space, the Minerva Stiftung and the European Research Council (consolidator grant 616919-Ionology).
References
- Ludlow et al. (2015) A. D. Ludlow, M. M. Boyd, J. Ye, E. Peik, and P. O. Schmidt, Reviews of Modern Physics 87, 637 (2015).
- Nicholson et al. (2012) T. Nicholson, M. Martin, J. Williams, B. Bloom, M. Bishof, M. Swallows, S. Campbell, and J. Ye, Physical review letters 109, 230801 (2012).
- Hinkley et al. (2013) N. Hinkley, J. Sherman, N. Phillips, M. Schioppo, N. Lemke, K. Beloy, M. Pizzocaro, C. W. Oates, and A. Ludlow, Science 341, 1215 (2013).
- Chou et al. (2010) C.-W. Chou, D. Hume, T. Rosenband, and D. Wineland, Science 329, 1630 (2010).
- Eisele et al. (2009) C. Eisele, A. Y. Nevsky, and S. Schiller, Physical Review Letters 103, 090401 (2009).
- Abbott et al. (2016) B. P. Abbott, R. Abbott, T. Abbott, M. Abernathy, F. Acernese, K. Ackley, C. Adams, T. Adams, P. Addesso, R. Adhikari, et al., Physical review letters 116, 061102 (2016).
- Drever et al. (1983) R. W. P. Drever, J. L. Hall, F. V. Kowalski, J. Hough, G. M. Ford, A. J. Munley, and H. Ward, Applied Physics B 31, 97 (1983).
- Swallows et al. (2012) M. Swallows, M. Martin, M. Bishof, C. Benko, Y. Lin, S. Blatt, A. M. Rey, and J. Ye, IEEE transactions on ultrasonics, ferroelectrics, and frequency control 59, 416 (2012).
- Alnis et al. (2008) J. Alnis, A. Matveev, N. Kolachevsky, T. Udem, and T. W. Hänsch, Phys. Rev. A 77, 053809 (2008).
- Young et al. (1999) B. C. Young, F. C. Cruz, W. M. Itano, and J. C. Bergquist, Phys. Rev. Lett. 82, 3799 (1999).
- Jiang et al. (2011) Y. Jiang, A. Ludlow, N. D. Lemke, R. W. Fox, J. A. Sherman, L.-S. Ma, and C. W. Oates, Nature Photonics 5, 158 (2011).
- Kessler et al. (2012a) T. Kessler, T. Legero, and U. Sterr, Journal of the Optical Society of America B 29, 178 (2012a).
- Kessler et al. (2012b) T. Kessler, C. Hagemann, C. Grebing, T. Legero, U. Sterr, F. Riehle, M. Martin, L. Chen, and J. Ye, Nature Photonics 6, 687 (2012b).
- Hagemann et al. (2013) C. Hagemann, C. Grebing, T. Kessler, S. Falke, N. Lemke, C. Lisdat, H. Schnatz, F. Riehle, and U. Sterr, IEEE Transactions on Instrumentation and Measurement 62, 1556 (2013).
- Yamaguchi et al. (2012) A. Yamaguchi, N. Shiga, S. Nagano, Y. Li, H. Ishijima, H. Hachisu, M. Kumagai, and T. Ido, Applied Physics Express 5, 022701 (2012).
- Nicolodi et al. (2014) D. Nicolodi, B. Argence, W. Zhang, R. Le Targat, G. Santarelli, and Y. Le Coq, Nature Photonics 8, 219 (2014).
- Scharnhorst et al. (2015) N. Scharnhorst, J. B. Wübbena, S. Hannig, K. Jakobsen, J. Kramer, I. D. Leroux, and P. O. Schmidt, Optics express 23, 19771 (2015).
- Su et al. (2015) F. Su, J. Yan-Yi, C. Hai-Qin, Y. Yuan, B. Zhi-Yi, and M. Long-Sheng, Chinese Physics B 24, 074202 (2015).
- Akamatsu et al. (2013) D. Akamatsu, H. Inaba, K. Hosaka, M. Yasuda, A. Onae, T. Suzuyama, M. Amemiya, and F.-L. Hong, Applied Physics Express 7, 012401 (2013).
- Inaba et al. (2013) H. Inaba, K. Hosaka, M. Yasuda, Y. Nakajima, K. Iwakuni, D. Akamatsu, S. Okubo, T. Kohno, A. Onae, and F.-L. Hong, Optics express 21, 7891 (2013).
- Akamatsu et al. (2012) D. Akamatsu, Y. Nakajima, H. Inaba, K. Hosaka, M. Yasuda, A. Onae, and F.-L. Hong, Optics express 20, 16010 (2012).
- Yamanaka et al. (2015) K. Yamanaka, N. Ohmae, I. Ushijima, M. Takamoto, and H. Katori, Physical review letters 114, 230801 (2015).
- Nemitz et al. (2016) N. Nemitz, T. Ohkubo, M. Takamoto, I. Ushijima, M. Das, N. Ohmae, and H. Katori, Nature Photonics 10, 258 (2016).
- Yamaguchi et al. (2011) A. Yamaguchi, M. Fujieda, M. Kumagai, H. Hachisu, S. Nagano, Y. Li, T. Ido, T. Takano, M. Takamoto, and H. Katori, Applied physics express 4, 082203 (2011).
- Ye and Cundiff (2005) J. Ye and S. T. Cundiff, Femtosecond optical frequency comb: principle, operation and applications (Springer Science & Business Media, 2005).
- Newbury and Swann (2007) N. R. Newbury and W. C. Swann, JOSA B 24, 1756 (2007).
- Stenger et al. (2002) J. Stenger, H. Schnatz, C. Tamm, and H. R. Telle, Physical review letters 88, 073601 (2002).
- Grosche et al. (2008) G. Grosche, B. Lipphardt, and H. Schnatz, The European Physical Journal D 48, 27 (2008).
- Fang et al. (2013) S. Fang, H. Chen, T. Wang, Y. Jiang, Z. Bi, and L. Ma, Applied Physics Letters 102, 231118 (2013), https://doi.org/10.1063/1.4809736 .
- Nakajima et al. (2010) Y. Nakajima, H. Inaba, K. Hosaka, K. Minoshima, A. Onae, M. Yasuda, T. Kohno, S. Kawato, T. Kobayashi, T. Katsuyama, et al., Optics Express 18, 1667 (2010).
- Ohmae et al. (2017) N. Ohmae, N. Kuse, M. E. Fermann, and H. Katori, Applied Physics Express 10, 062503 (2017).
- Angrisani et al. (2001) L. Angrisani, M. D’Apuzzo, and M. D’Arco, IEEE Transactions on instrumentation and measurement 50, 930 (2001).
- Akerman et al. (2012) N. Akerman, Y. Glickman, S. Kotler, A. Keselman, and R. Ozeri, Applied Physics B 107, 1167 (2012).
- Akerman et al. (2015) N. Akerman, N. Navon, S. Kotler, Y. Glickman, and R. Ozeri, New Journal of Physics 17, 113060 (2015).
- Agarwal (1978) G. Agarwal, Physical Review A 18, 1490 (1978).