Pressure dependence of ferroelectric quantum critical fluctuations
Abstract
Phase transitions to a long-range-ordered state driven by a softened phonon mode are ubiquitious across condensed matter physics, but the evolution of such a mode as the system is tuned to or from the transition has never been explictly measured until now. We report for the first time the effect of pressure on the soft mode associated with ferroelectricity in the archetypal quantum critical paraelectric SrTiO3. This is an ideal, clean, model system for exploring these effects, with pressure directly addressing the phonon modes only. We measure and report the effect of quantum critical fluctuations on the pressure and temperature dependence of the ferroelectric soft phonon mode as the system is tuned away from criticality. We show that the mean field approximation is confirmed experimentally. Furthermore, using a self-consistent model of the quantum critical excitations including coupling to the volume strain and without adjustable parameters, we determine logarithmic corrections that would be observable only very close to the quantum critical point. Thus, the mean-field character of the pressure dependence is much more robust to the fluctuations than is the temperature dependence. We predict stronger corrections for lower dimensionalities. The same calculation confirms that the Lydanne-Sachs-Teller relation is valid over the whole pressure and temperature range considered. Therefore, the measured dielectric constant can be used to extract the frequency of the soft mode down to K and up to kbar of applied pressure. The soft mode is observed to stiffen further, raising the low-temperature energy gap and returning towards the expected shallow temperature dependence of an optical mode. This behavior is consistent with the existence of a ferroelectric quantum critical point on the pressure-temperature phase diagram of SrTiO3, which applied pressure tunes the system away from. This work represents the first experimental measurement of the stiffening of a soft phonon mode as a system is tuned away from criticality, a potentially universal phenomenon across a variety of phase transitions and systems in condensed matter physics.
I Introduction
The incipient ferroelectric SrTiO3 has been studied in great detail and is used as a dielectric or an insulating substrate in many applications (Barrett1952, ; Cowley1964, ; Samara1966, ; Mueller1979, ; Muller1991, ; Fujishita2016, ; Atkinson2017, ) as it possess an anomalously high dielectric constant at low temperatures. SrTiO3 is the clearest example of a quantum paraelectric known. The nature of the quantum paraelectric state has been an open question since Barrett (Barrett1952, ) first attempted to describe the deviation from Curie-Weiss behavior observed in SrTiO3. Recently, progress has been made (Coak2018, ) in describing this state but the effect of fluctuations on the pressure dependence has not been considered until this work.
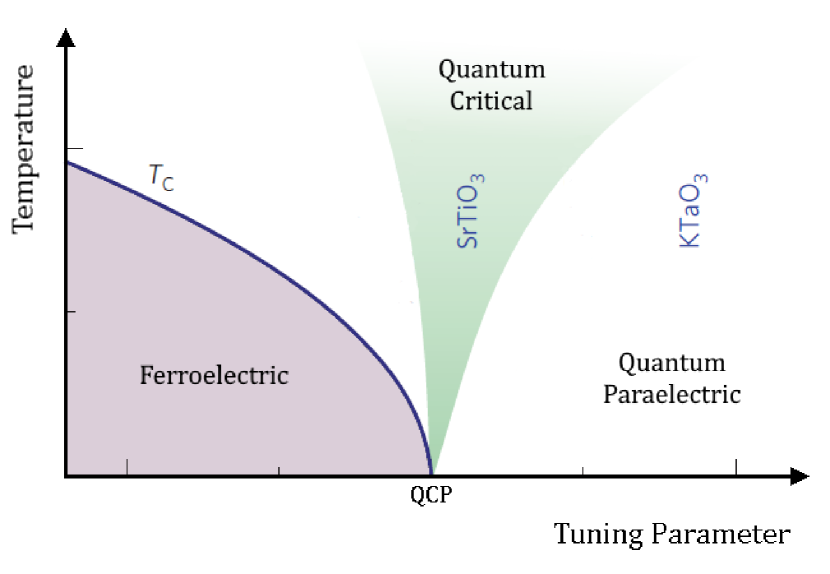
SrTiO3 has a cubic perovskite structure at room temperature with a well-documented antiferrodistortive transition at around 110 K (Shirane1969, ), below which the unit cell is tetragonal. The dielectric constant, , of SrTiO3 exhibits a classical Curie-Weiss temperature dependence at high temperatures (Mueller1979, ), but departs from the Curie-Weiss behavior as the polarization is modified by quantum fluctuations below 50 K, and no ferroelectric ordering is observed. The system remains close to long-range order through a displacive ferroelectric transition, but the transition does not occur in pristine SrTiO3. The polarisation is due to the ionic motion of a transverse optical phonon mode, which softens to approach zero energy at low temperature at the zone center point. This mode, commonly described as the ‘soft mode’ or ‘ferroelectric mode’ corresponds to opposing motion of the oxygen octahedra and titanium ions along the c-axis (Cowley1964, ; Fleury1968, ). Inelastic neutron scattering experiments by Yamada et al. (Yamada1969, ) have shown however that the soft mode is ‘frozen out’ at low temperatures - instead of falling to zero the phonon energy flattens out to a fixed value or gap as temperature is decreased below 50 K. This means that spontaneous long-range ferroelectricity does not form, but a low-energy excitation into short range charge ordering is available to the system, leading to the very large polarizability and departures from classical predictions seen at low temperatures (Muller1991, ). These phenomena have been linked to a postulated ferroelectric quantum critical point (QCP) at the equivalent of a small ‘negative pressure’ on SrTiO3’s pressure-temperature phase diagram (Fig. 1) - quantum critical fluctuations of the polarization in the vicinity of this point lead to a modified dependence of the dielectric properties. The application of strain (Uwe1976, ), or the substitution of a heavier oxygen isotope to form SrTi18O3 (Itoh2000a, ; Wang2000, ), which both have the opposite effect on the system to applying pressure, lead to a ferroelectric phase, consistent with this QCP. Our recent work (Coak2018, ) has shown through detailed measurements of the dielectric constant under pressure that SrTiO3 is driven away from its quantum critical regime by the application of pressure. The dielectric response was in addition seen to match that seen in KTaO3 at elevated pressures, in agreement with the position on the pressure/doping phase diagram postulated for this material (Fig. 1). Additionally, the dielectric loss in SrTiO3 is dominated by a series of peaks at characteristic temperatures. The largest of these peaks, at approximately 10 K, is associated with quantum fluctuations. Recent work (Coak2018b, ) suggests that this peak reflects a localized excitation formed of quantum fluctuations of domain walls.
Critical exponents in the temperature dependence of susceptibility, resistivity and heat capacity have been used extensively to identify and characterize the various states discovered in the heavy fermion systems and incipient transition metal itinerant magnets Lonzarich_MagneticElectron . There are good reasons for this. In particular the power of the temperature critical exponents lies in the incredible precision that temperature can be controlled and measured. This is not in general true for pressure. There are also differences in how pressure and temperature affect the energy scales - for the temperature case, the quantum critical cone is extremely narrow at low and then widens out, with subtle exponent crossovers, and with quantum critical effects persisting to unintuitively high temperatures. In contrast, a small change in pressure at low temperature - where critical effects are strongest just above the QCP - can push the system out of the quantum critical cone. It is worth understanding why the pressure dependence is mean-field-like - widely assumed but by no means obvious from first principles. For paraelectrics such as STO, the leading effect of the electrostrictive coupling on the zone-centre fluctuations is only to renormalize its anharmonic coefficients (Cowley1964, ), as shown later in the Theory section. Such couplings could also affect the dispersion away from (LinesAndGlass, ), but these are higher order effects involving fluctuations of the steric degrees of freedom which we have ignored in our model as their effect is stronger on the acoustic modes (Axe1970, ).
In this study the pressure dependence is measured explicitly. The relative paucity of data points compared to the temperature sweeps prohibits detailed numerical analysis. However, by considering a standard microscopic model of the ferroelectric fluctuations coupled to the volume strain and solved within the self-consistent phonon approximation (SCPA) (Arce-Gamboa2017a, ; Arce-Gamboa2018a, ), we reveal that the pressure dependence is indeed mean-field-like, except very close to the QCP where weak logarithmic corrections are expected. As a consequence of this, whilst the crossovers from quantum critical to classical and quantum paraelectric are clear in the temperature exponents, this crossover does not appear in the pressure dependence. The SCPA is equivalent to the self-consistent renormalization method used for itinerant magnets (Loehneysen2007, ).
The accompanying changes to the soft mode frequency have not been studied with pressure and temperature, and are reported here for the first time, extracted from the temperature and pressure dependence of the dielectric constant. The Lydanne-Sachs-Teller (LST) relation (Lyddane1941, ) allows the dielectric response of a polarizable crystal to be determined from its phonon spectrum or vice versa. The full relation including all phonon branches can be written as
| (1) |
where denotes the relative permittivity of the material, the refractive index or dielectric response at frequencies well above the relevant phonon frequencies and and are the frequencies of the longitudinal optical (LO) and transverse optical (TO) of phonon mode at the zone center (). In SrTiO3 a single TO mode corresponding to opposite motions of the titanium ion and surrounding oxygen octahedron is softened at the zone center (Yamada1969, ) and dominates the dielectric properties of the system. Following Barker (Barker1966, ) and Yamada (Yamada1969, ), we simplify the LST relation by assuming the pressure and temperature dependence of all modes other than the soft TO and its accompanying LO mode to be insignificant. Over the 20 kbar (2 GPa) range reported in this study, SrTiO3 does not undergo any structural transitions, changes in lattice parameters are well under a percent (Guennou2010, ) and the variation of room-temperature phonon frequencies has been shown to be linear with pressure up to a much larger range (Ishidate1992, ). The effect of these comparatively low pressures (several orders of magnitude below the bulk modulus (Beattie1971, )) on SrTiO3 is therefore to cause a small leading-order perturbation to the lattice and phonons, with the notable exception of the soft mode. All other optical modes can be expected to tune with applied pressure in the same manner, and their terms in the LST relation cancel, leading to
| (2) |
where and denote the ferroelectric soft mode and its longitudinal equivalent, which is denoted as and of energy 148 cm-1 by Ishidate et al. (Ishidate1992, ).
II Experiments
II.1 Methods
High precision capacitance measurements were carried out on single crystal samples of SrTiO3 from Crystal GmbH with gold electrodes vacuum evaporated onto the surfaces in a parallel-plate capacitor geometry. Measurements under extremely hydrostatic pressure conditions were made possible by the development, in collaboration with CamCool Research Ltd, of a piston-cylinder clamp cell with miniature shielded coaxial cables running into the sample region and electrically isolated from the cell body. This eliminates stray capacitances from the wiring and allows pF capacitance signals to be measured with stabilities of one part in a million. The shield conductors of the coaxial cables were joined together at the sample position and at the measurement instrument in the standard 2-point capacitance setup. The pressures in the measurements reported were 0/ambient, 2.4, 3.3, 4.6, 5.2, 6.9, 8.6, 9.6, 11.9, 14.1, 15.7, 17.1, 18.6 and 20.0 kbar, with a typical uncertainty of 0.2 kbar. An Andeen-Hagerling 2550A 1 kHz capacitance bridge was used, at a voltage of 0.1 V. Sample thickness, corresponding to capacitor plate separation, was 0.5 mm. Measurements were taken on a modified 1K Dipper cryostat from ICE Oxford, allowing continuous stable temperature control down to 1.2 K, and an adiabatic demagnetization refrigerator developed in house capable of reaching 200 mK. Typical heating or cooling rates were held at 0.01 K per minute to allow the large thermal mass of the pressure cell to thermally equilibrate.
II.2 Results
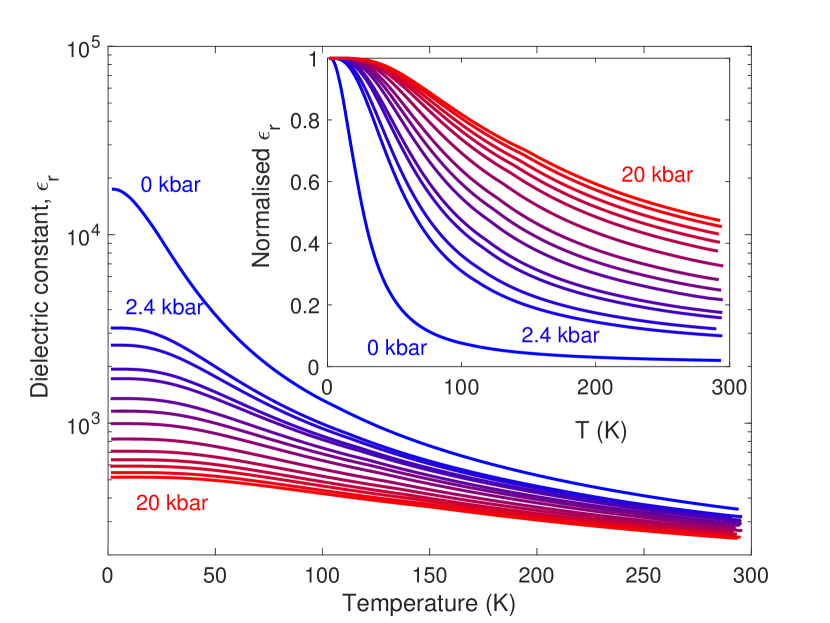
Measurements were carried out of the dielectric constant of SrTiO3 from room temperature down to 1.5 K at fixed hydrostatic pressures up to 20.0 kbar. The effect of pressure, as discussed in more detail in our recent paper (Coak2018, ), is to drastically reduce the magnitude of the low-temperature dielectric constant from ~18,000 at ambient pressure to ~500 at 20.0 kbar as the system is tuned away from a ferroelectric transition and associated quantum critical behavior - see Fig 2.
a) b)
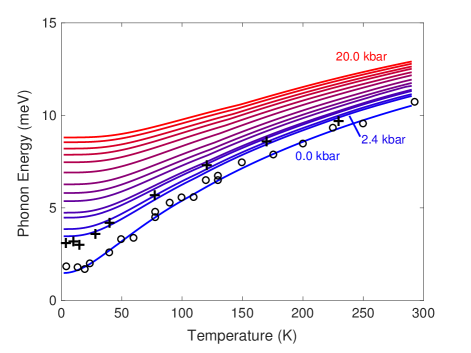
LST Analysis : Such a drastic change in the dielectric properties must reflect a change in the phonon spectrum of the system as the two are linked by the LST - the phonon frequencies directly determine the dielectric response. Eq. 2 was used to extract the temperature and pressure dependence of the frequency of the ferroelectric soft mode at the zone centre. and only change by ~1% over the pressure and temperature ranges studied, as will be shown in the rest of this section, so a good approximation of can be found by simply setting these to be constant. Including the known pressure and temperature dependencies of these parameters will give a more accurate estimate of the phonon frequency however, and this was done to find the data presented in Fig. 3(a).
The refractive index at high frequencies was assumed to be temperature independent, in line with the conclusions of Kamarás et al. (Kamaras1995, ), but the pressure, , dependence was considered. The linear pressure dependence with a value of found by Giardini (Giardini1957, ) for optical frequencies at room temperature was used to model the changes in . An exact numerical value for is hard to define, as exhibits frequency dependence out to the highest frequencies measured (Levin1955, ; Cardona1965, ), but can be estimated as between 2.7 - 3.0 under ambient conditions. The numerical value for was therefore set to 2.87 by fitting the extracted phonon frequencies at ambient pressure to the experimental values found by Yamada et al. (Yamada1969, ) from inelastic neutron scattering.
The longitudinal optical mode frequency has been found to be under ambient conditions by Ishidate et al. (Ishidate1992, ) and Lebedev (Lebedev2009, ). Ishidate measured room temperature phonon frequencies in SrTiO3 up to a pressure range an order of magnitude higher than that reported in this work, and found a linear pressure dependence throughout, with . The temperature variation of at ambient pressure was reported by Servoin et al. (Servoin1980, ), and this was fitted with a linear relationship to extract a gradient . Both pressure and temperature effects are therefore on order a percent over the ranges studied, just as with the refractive index changes, so all three must be considered for a rigorous analysis.
Holding and constant as in Yamada et al. and fitting the resulting constant of proportionality to match the Yamada data gives , with frequencies in meV and dimensionless. Yamada had a similar conversion factor of 37790, suggesting comparable sample quality - the dielectric constant is very sensitive to sample purity and surface finish, easily explaining the slight difference. Including the variation in and leads to:
(pressures in kbar, temperature in K).
Phonon Frequency Results : This last equation was used to extract the values for shown in Fig. 3(a). As pressure is increased the phonon frequency markedly flattens off and returns towards the flat temperature dependence of an archetypal optical mode. The low-temperature gap, , is doubled from 2 meV by even 2.4 kbar, the smallest pressure applicable with this setup. The small phonon energy or gap is directly linked to the ferroelectric quantum critical fluctuations observed in this material, so the gap widening as seen and becoming energetically inaccessible as the system is tuned away from criticality is an expected result. The prediction that pressure will tune the system towards the behavior seen in KTaO3 is supported by the data as well - the soft mode energy for KTaO3 overlayed on Fig. 3(a) lie by inspection at where SrTiO3 values at around 2 kbar would be found.
a) b)
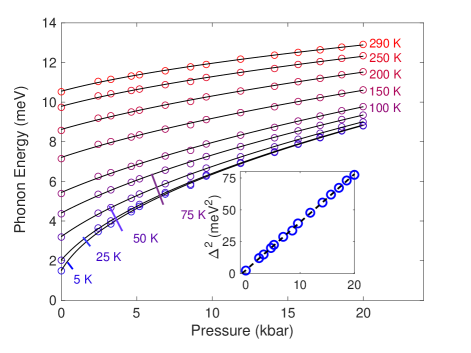
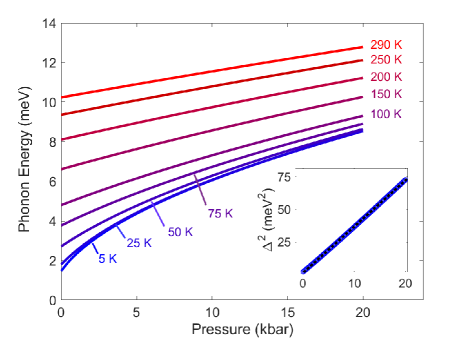
Fig. 4(a) shows the pressure dependence of at fixed temperatures, taken directly from the data of Fig. 3(a). The data at 1.5 K, 2 K, 5 K and those extrapolated to 0 K all overlap as the dielectric response flattens off as temperature approaches zero, so any data in this range can be taken as the zero-temperature value. The inset of Fig. 4(a) shows the square of the phonon energy at 2 K, equivalent to the zero-temperature gap, , plotted against pressure. This shows very good agreement to a linear fit, giving the behavior expected from Landau theory with the critical pressure at which the ferroelectric quantum critical point occurs equal to -0.7(1) kbar. This is in agreement with the analysis in our earlier paper (Coak2018, ) and with observations that strain or oxygen-18 substitution (both equivalent to ‘negative pressure’ in SrTiO3) drive the system to a ferroelectric state (Uwe1976, ; Itoh2000a, ; Wang2000, ).
III Theory
III.1 Model
We consider a standard model Hamiltonian for displacive ferroelectrics with normal mode coordinates that describe local displacements , with in the unit cell that are associated with the soft TO mode, the condensation of which is driven by the dipolar force and leads to the ferroelectric transition. We also consider the coupling to volume strain . The Hamiltonian is as follows, (Arce-Gamboa2018a, )
| (3) |
where is the Hamiltonian of the polar degrees of freedom alone,
is the elastic energy,
and is a linear-quadratic coupling between and ,
Here, is the conjugate momentum of ; and is the dipolar interaction with Fourier transform where is a constant that depends on the lattice structure. is the frequency of the purely harmonic model; and are coefficients of the isotropic and anisotropic cubic anharmonicities, respectively; is the coupling constant between the polarization and volume strain; and and are, respectively, the bulk modulus and applied hydrostatic stress (e.g. biaxial stress for and pressure for ).
Though the low temperature paraelectric lattice structure of SrTiO3 is tetragonal, we will follow previous work (Rowley2014, ) and assume cubic symmetry for simplicity. The TO excitations of (3) are thus doubly degenerate,
| (4) |
where is the square of the phonon gap at the zone-center. In addition to (4), there is a singlet LO mode which we will neglect as it is gapped out by the large depolarizing field of order . Within the SCPA, (Arce-Gamboa2018a, ; Arce-Gamboa2017a, ) is given as follows,
| (5) |
where are the fluctuations of polarization,
| (6) |
with a Bose factor and is the average volume strain,
| (7) |
By substituting Eqs. (6) and (7) into Eq. (5), we separate the contributions from thermal and quantum fluctuations as follows Schneider1976 ,
| (8) | ||||
where is the critical pressure at K,
| (9) |
and,
| (10a) | ||||
| (10b) | ||||
where , , and is the Debye temperature. Eqs. (8), (9), and (10) self-consistently determine the temperature and pressure dependence of .
III.2 Results
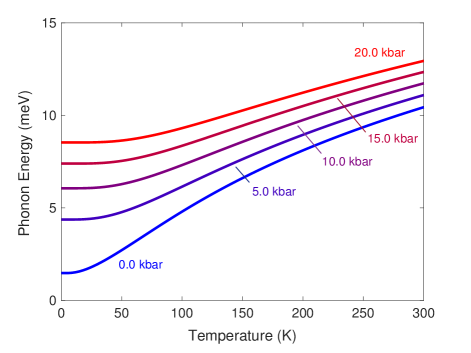
The non-adjustable model parameters are , and which we fit experimental data reported for SrTiO3 as follows: and are determined from the temperature dependence of the transverse optic phonon gap measured by neutron scattering, Yamada1969 ; is obtained from the slope of versus measured here (see inset of Fig. 4(b)); and from specific heat data (K) Burns1980 . The resulting parameters are meV, meV3, meV2, and meV. The calculated temperature and pressure dependence of is in good qualitative and quantitative agreement with experiments, as shown in Figs. 3 and 4.
To further explore the behavior of the excitations, we study the pressure dependence of the fluctuations near the QCP. At K, Eq. (8) gives,
| (11) |
For ,
| (12) |
with positive constants. Thus the lower (upper) critical dimension is . While there are strong deviations from mean field behavior for , the corrections are only logarithmic for . Equation. (11) then gives,
| (13) |
with weak logarithmic corrections for . Such corrections should be observable only when extremely close to the QCP () and a renormalization group analysis would be required for a quantitative description. For the present experiments, , and thus are not observable.
Quantum critical excitations in uniaxial and ferroelectrics are generally expected to differ from those of cubic systems. We briefly consider such cases in Appendix A.
IV Conclusions
The Lydanne-Sachs-Teller relation was used to extract the pressure and temperature dependence of the transverse optical soft mode frequency in SrTiO3 from precision measurements of the dielectric constant under pressure. The mode was seen to stiffen as pressure was applied, moving towards a more typical flat optical mode. The low-temperature phonon gap widened with increasing pressure, showing excellent agreement to the predicted by Landau theory and with an extrapolated critical pressure of -0.7(1) kbar.
By treating the pressure within a self-consistent model for the quantum ferroelectric excitations, we have shown that the pressure dependence is robustly mean-field like. There are logarithmic corrections very close to absolute zero but these extend only to very low pressures (much less than 1 kbar). At the same time we verify the applicability of the LST over the whole of the phase space considered.
SrTiO3 forms an ideal model system for the study of the physics of soft phonon modes and of quantum criticality, and pressure allows direct and clean tuning of the phonons - the driving mechanism of the whole system. Our results provide the first measurement of the stiffening of a soft phonon mode as a system is tuned away from criticality in a clean and direct manner by the application of hydrostatic pressure - a potentially universal phenomenon across a variety of phase transitions and systems in condensed matter physics.
Acknowledgements
Acknowledgements.
The authors would like to thank G.G. Lonzarich, P.B. Littlewood, F.M. Grosche, D.E. Khmelnitskii, S.E. Dutton, N.D. Mathur, J. van Wezel, G. Tsironis, C. Panagopoulos, L.J. Spalek, H. Hamidov, P.A.C. Brown, D. Jarvis and J. Zaanen for their help and discussions. We would also like to acknowledge support from Jesus, Churchill and Trinity Colleges of the University of Cambridge, the Engineering and Physical Sciences Research Council, IHT KAZATOMPROM and the CHT programme. The work was carried out with financial support from the Ministry of Education and Science of the Russian Federation in the framework of Increase Competitiveness Program of NUST MISiS (№ K2-2017-024), implemented by a governmental decree dated 16th of March 2013, N 211. Work at the University of Costa Rica is supported by the Vice-rectory for Research under the project no. 816-B7-601 and the Office of International Affairs.Appendix A Uniaxial and ferroelectrics
For uniaxial ferroelectrics, there is an preferred polarization direction which we choose to be the -axis. The Hamiltonian is similar to that of Eq. (3) except that , and . The phonon excitations are , Roussev2003 which give
| (14) |
The upper critical dimension is thus and there are weak logarithmic corrections in .
For ferroelectrics, there is an easy plane of polarization and the Hamiltonian is again similar to that of Eq. (3) except that . The excitations are and . The former isotropic dispersion dominates the critical behavior and the corrections to mean-field behavior are thus the same as those given in Eq. (12).
References
- (1) J. H. Barrett, Dielectric constant in perovskite type crystals, Physical Review 86, 118-120 (1952)
- (2) R. A. Cowley, Lattice dynamics and phase transitions of strontium titanate, Physical Review 134, A981-A997 (1964)
- (3) G. A. Samara, Pressure and temperature dependences of the dielectric properties of the perovskites BaTiO3 and SrTiO3, Physical Review 151, 378-386 (1966)
- (4) K. A. Müller and H. Burkard, SrTiO3 : An intrinsic quantum paraelectric below 4 K, Phys. Rev. B 19, 3593-3602 (1979)
- (5) K. A. Müller, W. Berlinger and E. Tosatti, Indication for a novel phase in the quantum paraelectric regime of SrTiO3, Z. Physik B - Condensed Matter 84, 277-283 (1991)
- (6) H. Fujishita, S. Kitazawa, M. Saito, R. Ishisaka, H. Okamoto and T. Yamaguchi, Quantum Paraelectric States in SrTiO3 and KTaO3: Barrett Model, Vendik Model, and Quantum Criticality, J. Phys. Soc. Jpn. 85, 074703 (2016)
- (7) W. A. Atkinson, P. Lafleur and A. Raslan, Influence of the ferroelectric quantum critical point on SrTiO3 interfaces, Phys. Rev. B 95, 054107 (2017)
- (8) M. J. Coak, C. R. S. Haines, C. Liu, S. E. Rowley, G. G. Lonzarich and S. S. Saxena, Emergence of a quantum coherent state at the border of ferroelectricity, ArXiv preprint 1808.02428, (2018)
- (9) G. Shirane and Y. Yamada, Lattice-dynamical study of the 110 K phase transition in SrTiO3, Physical Review 177, 858-863 (1969)
- (10) P. A. Fleury and J. M. Worlock, Electric-field-induced Raman scattering in SrTiO3 and KTaO3, Physical Review 174, 613-623 (1968)
- (11) Y. Yamada and G. Shirane, Neutron scattering and nature of the soft optical phonon in SrTiO3, J. Phys. Soc. Jpn. 26, 396-403 (1969)
- (12) H. Uwe and T. Sakudo, Stress-induced ferroelectricity and soft phonon modes in SrTiO3, Phys. Rev. B 13, 271-286 (1976)
- (13) M. Itoh and R. Wang, Quantum ferroelectricity in SrTiO3 induced by oxygen isotope exchange, Applied Physics Letters 76, 221-223 (2000)
- (14) R. Wang, N. Sakamoto and M. Itoh, Effects of pressure on the dielectric properties of SrTi18O3 and SrTi16O3 single crystals, Phys. Rev. B 62, R3577 (2000).
- (15) M. J. Coak, C. R. S. Haines, C. Liu, D. M. Jarvis, P. B. Littlewood and S. S. Saxena, Dielectric response of quantum critical ferroelectric as a function of pressure, Sci. Rep. 8, 14936 (2018)
- (16) G. G. Lonzarich, The Magnetic Electron, Cambridge University Press (1997)
- (17) M. A. Lines and A. M. Glass, Principles and applications of ferroelectrics and related materials, Clarendon Press (1970)
- (18) J. Axe, J. Harada and G. Shirane, Anomalous acoustic dispersion in centrosymmetric crystals with soft optic phonons, Phys. Rev. B 1, 1227-1234 (1970)
- (19) S. E. Rowley, L. J. Spalek, R. P. Smith, M. P. M. Dean, M. Itoh, J. F. Scott, G. G. Lonzarich and S. S. Saxena, Ferroelectric quantum criticality, Nat. Phys. 10, 367-372 (2014)
- (20) J. R. Arce-Gamboa and G. G. Guzmán-Verri, Random electric field instabilities of relaxor ferroelectrics, npj Quantum Materials 2, 28 (2017)
- (21) J. R. Arce-Gamboa and G. G. Guzmán-Verri, Quantum ferroelectric instabilities in superconducting SrTiO3, Phys. Rev. Mat. 2, 10484 (2018)
- (22) H. v. Löhneysen, A. Rosch, M. Vojta and P. Wölfle, Fermi-liquid instabilities at magnetic quantum phase transitions, Reviews of Modern Physics 79, 1015-1075 (2007)
- (23) R. H. Lyddane, R. G. Sachs and E. Teller, On the polar vibrations of alkali halides, Physical Review 59, 673-676 (1941)
- (24) A. S. Barker, Temperature dependence of the transverse and longitudinal optic mode frequencies and charges in SrTiO3 and BaTiO3, Physical Review 145, 391-399 (1966)
- (25) M. Guennou, P. Bouvier, J. Kreisel and D. Machon, Pressure-temperature phase diagram of SrTiO3 up to 53 GPa, Phys. Rev. B 81, 054115 (2010)
- (26) T. Ishidate and T. Isonuma, Phase transition of SrTiO3 under high pressure, Ferroelectrics 137, 45-52 (1992)
- (27) A. G. Beattie, Pressure dependence of the elastic constants of SrTiO3, Journal of Applied Physics 42, 2376 (1971)
- (28) G. Shirane, R. Nathans and V. J. Minkiewicz, Temperature dependence of the soft ferroelectric mode in KTaO3, Physical Review 157, 396-399 (1967)
- (29) K. Kamarás, K. -L. Barth, F. Keilmann, R. Henn, M. Reedyk, C. Thomsen, M. Cardona, J. Kircher, P. Richards and J. -L. Stehlé, The low-temperature infrared optical functions of SrTiO3 determined by reflectance spectroscopy and spectroscopic ellipsometry, Journal of Applied Physics 78, 1235-1240 (1995)
- (30) A. A. Giardini, Stress-optical study of strontium titanate, Journal of the Optical Society of America 47, 726 (1957)
- (31) S. B. Levin, N. J. Field, F. M. Plock and L. Merker, Some optical properties of strontium titanate crystal, J. Opt. Soc. Am. 45, 737-739 (1955)
- (32) M. Cardona, Optical properties and band structure of SrTiO3 and BaTiO3, Physical Review 140, A651-A655 (1965)
- (33) A. I. Lebedev, Ab initio calculations of phonon spectra in ATiO3 perovskite crystals (A = Ca, Sr, Ba, Ra, Cd, Zn, Mg, Ge, Sn, Pb), Physics of the Solid State 51, 362-372 (2009)
- (34) J. L. Servoin, Y. Luspin and F. Gervais, Infrared dispersion in SrTiO3 at high temperature, Phys. Rev. B 22, 5501-5506 (1980)
- (35) T. Schneider, H. Beck and E. Stoll, Quantum effects in an n-component vector model for structural phase transitions, Phys. Rev. B 13, 1123-1130 (1976)
- (36) G. Burns, Comment on the low temperature specific heat of ferroelectrics, antiferroelectrics, and related materials, Solid State Comm. 35, 811-814 (1980)
- (37) R. Roussev and A. J. Millis, Theory of the quantum paraelectric-ferroelectric transition, Phys. Rev. B 67, 014105 (2003)