Optical polarization properties of February 2010 outburst of the blazar Mrk 421
Abstract
In this paper, we explore the behavior of optical polarization during the multi-wavelength outburst of the blazar Mrk 421 detected in February 2010. We use optical polarization measurements in the wavelength range 500-700 nm from SPOL observations available between January 1, 2010 and March 31, 2010 (MJD 55197-55286) including the period of multi-wavelength flaring activity detected from the source around February 16-17, 2010 (MJD 55243-55244). We also use near simultaneous optical and radio flux measurements from SPOL in V and R bands and OVRO at 15 GHz respectively. We find that the emissions in the optical and radio bands do not show any significant change in the source activity unlike at X-ray and –ray energies during the outburst. The optical and radio flux measurements are found to be consistent with the long term quiescent state emission of the source. Moreover, the linear polarization in the wavelength range 500-700 nm decreases to a minimum value of 1.6 during the X-ray and –ray outburst which is significantly lower than the long term average value of 4.2. The angle of polarization varies between 114∘-163∘ with a preferred average value of 137∘ during this period. We estimate the degree of polarization intrinsic to the jet taking into account the host galaxy contamination in R band and compare this with the theoretical synchrotron polarization estimated for a power law distribution of relativistic electrons gyrating in an emission region filled with ordered and chaotic magnetic fields. The intrinsic linear polarization estimated for different epochs during the above period is found to be consistent with the theoretical synchrotron polarization produced by the relativistic electrons with power law spectral index 2.2. We find that the behavior of optical polarization possibly supports the two emission zone hypothesis for blazars in which X-ray and –rays are produced in one region whereas the optical emission takes place from another region permeated with ordered and chaotic magnetic fields. The decrease in linear polarization during the X-ray and –ray outburst can be attributed to the sudden dominance of chaotic magnetic field over the ordered field in the optical emission region in the relativistic jet of the blazar Mrk 421.
1 Introduction
BL Lacertae objects (BL Lacs) and Flat Spectrum Radio Quasars (FSRQs) collectively form the blazar class of active galactic nuclei (AGN) with highly collimated relativistic jets pointing at small angles ( 10∘) towards the observer on Earth (Urry & Padovani, 1995). FSRQs are observed to be more luminous and powerful than BL Lacs. In addition, the optical spectra of FSRQs have prominent emission lines from the thermal plasma whereas no such or weak spectral lines are observed from BL Lacs. Blazars are observed to emit radiation over the entire electromagnetic spectrum from radio to TeV –rays. Most of the electromagnetic radiation observed from blazars is explained by the synchrotron and inverse Compton processes. The broadband spectral energy distribution (SED) of blazars exhibits two broad humps peaking at low (radio-UV/optical-soft X-ray) and high (hard X-ray-MeV-GeV-TeV –ray) energies respectively. The physical process for the origin of low energy hump has been completely understood and is attributed to the synchrotron radition of relativistic electrons and positrons in the jet magnetic field. However, the origin of high energy hump is not very clear and is one of the important open questions in the high energy astrophysics research until today. In the generally accepted scenario, high energy emission from blazars is attributed to the inverse Compton (IC) scattering of low energy photons produced both inside and outside the jet by the same population of relativistic electrons responsible for the origin of low energy hump. If target photons for IC scattering are the synchrotron photons produced inside the jet, it is referred to as synchrotron self Compton (SSC) process under the leptonic scenario (Maraschi et al., 1992; Ghisellini et al., 1998). On the other hand, if the seed photon field for IC scattering is outside the jet, the process is known as external Compton (EC) model (Dermer et al., 1992; Sikora et al., 1994). In the alternative hadronic scenario, models based on proton synchrotron or secondary emission from the cascade initiated by proton- interactions have been proposed to explain the high energy hump in the blazar SED (Aharonian, 2002; Mücke et al., 2003; Abdo et al., 2011; Fraija & Marinelli, 2015). Blazars are also observed to exhibit broadband or orphan flaring activity (dominant at X-ray and –ray energies) with the highest output flux level varying at timescales ranging from months to few minutes (Cui, 2004; Fraija, 2015; Ackermann et al., 2016; Singh et al., 2018, 2019). The physical processes involved in the flaring activity of these sources are not completely understood.
The broadband radiation measured from the blazars is characterized as non-thermal, variable, Doppler boosted and highly polarized. The observations of polarized radiation at optical wavelengths from blazars support the synchrotron process in the ordered magnetic field in the blazar jets. FSRQs are observed to be less polarized than the radio selected BL Lacs (Fan et al., 2008). The observations of high degree of polarization during the flaring and quiescent states play a very important role in exploring the emission mechanisms operating in the jets or outflows in blazars. The measurements of the degree and angle of polarization from blazars at low energies help in probing the underlying particle distribution along with the strength and configuration of magnetic field in the emission region of the blazar jet. Correlated variability between polarization and flux in different energy bands provides information about the magnetic field geometry in the blazar jet. Therefore, variability study of the polarization is important for exploring the jet properties and associated magnetic field structure (Visvanathan & Wills, 1996). It has also been observed that the polarization is connected to the morphology and relativistic beaming and therefore plays an important role in the unification models for quasars (Fan et al., 2008; Zakamska et al., 2005). Mrk 421 is a well studied BL Lac object and has been considered as an excellent candidate for understanding the physical mechanisms involved in the blazar jets. In this work, we use the optical polarization measurements on Mrk 421 observed during the extreme outburst in the X-ray and –ray energy bands in February 2010 to investigate the physical processes involved in the flaring activity. The paper is organized as follows: in Section 2, we present an overview of the important results based on the multi-wavelength studies of the flare detected from Mrk 421 in February 2010. In Section 3, we describe the observations and data sets used in this work. Section 4 describes the results of the optical and radio observations of the source. In Section 5, we discuss the theoretical aspects of the synchrotron polarization and compare them with the results obtained during the outburst. Finally, we conclude the important findings of this study in Section 6.
2 Overview of Mrk 421 outburst in February 2010
Mrk 421 is a very active BL Lac type blazar at redshift z=0.031 (Sbarufatti et al., 2005). The source has been observed to undergo broadband flaring activities occasionally since its discovery at TeV –rays in 1991 (Punch et al., 1992). Here, we present an overview of the results from the X-ray and –ray observations of Mrk 421 outburst detected around February 16-17, 2010 (MJD 55243-55244). The X-ray outburst detected by the MAXI-GSC and Swift-BAT (Burst Alert Telescope) was found to be the brightest among the previous high activity states of the source (Isobe et al., 2010). The strength of the jet magnetic field derived from the X-ray observations was found to be weaker than the earlier reported values for this blazar. In the –ray band, the outburst was simultaneously detected by the Fermi-LAT (Large Area Telescope) at MeV-GeV energies (Singh et al., 2012). Significant spectral hardening in both X-ray and MeV-GeV –ray bands was observed irrespective of the large flux variations during the outburst (Isobe et al., 2010; Singh et al., 2012). The observed spectral variation during this outburst was different from the results of previous flaring episodes of Mrk 421 where a positive correlation between hardness and flux had been detected. At TeV –ray energies, the flaring activity of Mrk 421 was simultaneously detected by many ground based –ray telescopes operational during the period of broadband outburst and rapid flux variations on timescales down to few minutes were observed on the night of February 16-17, 2010 (Tluczykont et al., 2011; Fortson et al., 2012; Shukla et al., 2012; Singh et al., 2015; Bartoli et al., 2016).
Near simultaneous broadband data on the Mrk 421 outburst observed in February 2010 have been extensively used to understand the physical process involved in flaring activity of the source in the literature. Zheng et al. (2014) investigated the time-dependent properties of the outburst using a single zone SSC model and assuming a strong magnetic turbulence for the stochastic acceleration of electrons to relativistic energies. They concluded that the X-ray and –ray emissions observed during outburst were produced via synchrotron and SSC processes by the population of electrons whose injection into the emission region changed with time. Singh et al. (2017) used a time dependent one zone SSC process to model the daily X-ray and –ray light curves by numerically solving the kinetic equation for the evolution of the population of electrons in the emission region. The injection of electrons into the emission region was assumed to be a time-dependent power law produced by the putative acceleration process. It was suggested that the X-ray and –ray flaring activity observed in February 2010 can be attributed to an efficient acceleration process associated with the sudden increase in the electron density in the emission region. However, the optical polarization measurements during the outburst have not been exclusively used to probe this particular flaring activity of the blazar Mrk 421. Radio follow-up observations of the X-ray and –ray flares at 22 GHz detected the apparent superluminal inward motion of the jet component instead of a newly born component associated with the outburst (Niinuma et al., 2012). The motion of the jet component toward the core was attributed to the possible ejection of a new component which could not be resolved during the radio observations.
3 Data Set
A broadband giant flaring activity was observed from the blazar Mrk 421 in February 2010 by nearly all the ground and space based instruments world wide. The maximum change in the flux state was detected around February 16-17, 2010 (MJD 55243-55244) in the X-ray and –ray energy bands. In this work, we have used near simultaneous optical and radio archival data collected between January 1, 2010 and March 31, 2010 (MJD 55197-55286) and publicly avaialable under the Fermi Multiwavelength Observing-Support Programs111https://fermi.gsfc.nasa.gov/ssc/observations/multi/programs.html. The data for three months including the period of X-ray and –ray outbursts have been selected for exploring the optical and radio behavior of the blazar Mrk 421 during and without the flaring activity.
The spectropolarimeter (SPOL) at the Steward observatory of the Univeristy of Arizona provides ground based observational support to the Fermi-Large Area Telescope (LAT) monitored blazars (Smith et al., 2009). SPOL is a high throughput and moderate resolution dual beam instrument with a waveplate and Wollaston prism. This instrument contributes to the measurements of the degree of linear polarization in the wavelength range = 500-700 nm and optical magnitudes in V and R bands from the nightly monitoring of the –ray bright blazars. The linear polarization is measured by using a /2 waveplate in the telescope. The optical magnitude/flux measurements are provided from the differential spectrophotometry. A Johnson band pass filter with effective wavelength of 540 nm is used for V band differential photometry whereas R band measurements are performed using Kron-Cousins band pass filter with effective wavelength of 640 nm. The optical measurements by SPOL in V and R bands are not corrected for the interstellar extinction and contamination from the host galaxy starlight. In this work, we have used the polarization data and optical (V and R bands) flux measurements from the SPOL observations222http://james.as.arizona.edu/ psmith/Fermi/ of the blazar Mrk 421 during the period mentioned above.
The 40 m telescope at the Owens Valley Radio Observatory (OVRO) provides radio observations of selected Fermi-blazars at 15 GHz (Richards et al., 2011). The optics of this telescope uses a large diameter f/0.4 parabolic reflector with an altitude-azimuth mount. A cooled receiver operating in the Ku band with central frequency of 15 GHz and bandwidth of 3 GHz is installed at the prime focus of the telescope. The radiometry with the 40 m telescope includes pointing to a nearby bright source, calibration of noise source and flux density measurements. In the present work, we have used near simultaneous radio flux measurements at 15 GHz on blazar Mrk 421 available from the OVRO archive333http://www.astro.caltech.edu/ovroblazars/data.php/ for the period of optical observations discussed above.
4 Results
4.1 Optical and Radio Light curves
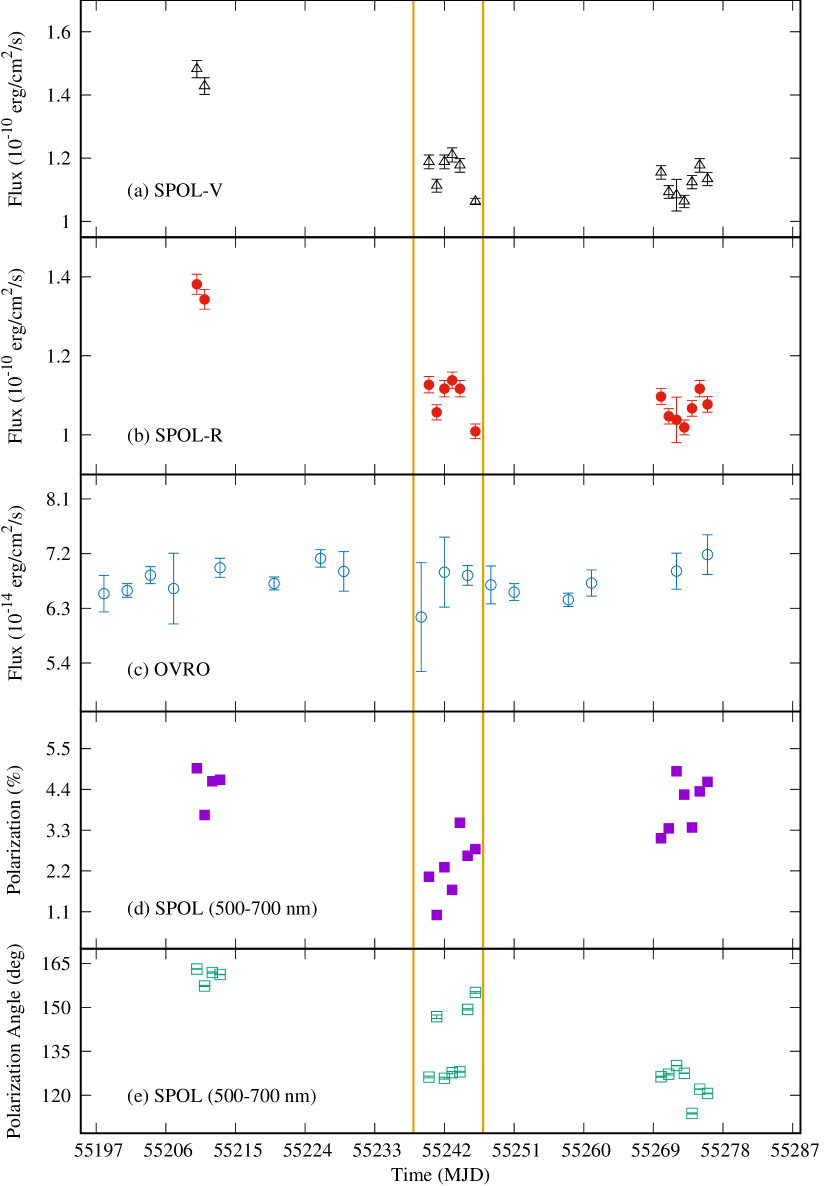
The daily light curves of Mrk 421 in optical and radio wave-bands for the period January 1, 2010 and March 31, 2010 (MJD 55197-55286) are shown in Figure 1(a-c) respectively. The time interval between the two vertical lines (MJD 55240-55246) in Figure 1 indicates the period covering the giant flaring activity of the source detected in the X-ray and –ray bands. Visual inspection of the optical light curves, Figure 1(a-b), suggests that the source was in a relatively higher emission state much before the X-ray and –ray outburst. During the period of flaring activity in high energy bands, the optical emission in both bands (V and R) is almost steady and consistent with the long term quiescent state of the source. It is important to note here that the optical fluxes reported in Figure 1(a-b) are not corrected for the contamination due to thermal emission from the host galaxy and interstellar reddening. The host galaxy of most of the blazars is observed to be relatively bright in optical bands and its contribution is very strong in near-infrared (Nilsson et al., 2007). The host galaxy contribution in the optical emission from Mrk 421 is discussed in detail in Section 5.1. The radio observations at 15 GHz from OVRO, as reported in Figure 1(c), also indicate a steady state of the source during the whole period and do not exhibit any change in the source activity during the X-ray and –ray outburst. We use -test of null-hypothesis of constant emission to characterize the nature of broadband emission during the different epochs. During the period of outburst, the optical emission in the V and R bands is characterized by constant flux levels of (1.110.03)10-10 erg cm-2 s-1 and (1.090.02)10-10 erg cm-2 s-1 respectively using a -test of null-hypothesis. Whereas the -test for fluxes measured during the period excluding the flaring episode suggests that the optical emission in both bands is variable. This is consistent with the visual inspection of the optical light curves where a high optical activity state of the source is observed prior to the X-ray and –ray outburst. The radio emission at 15 GHz described by a constant flux of (6.720.05)10-14 erg cm-2 s-1 throughout the period considered in this study is compatible with the long term quiescent state of the blazar Mrk 421. Therefore, the optical and radio light curves indicate that there is no change in the source activity at low energies during its giant flaring activity in X-ray and –ray energy bands observed in February 2010.
4.2 Observed Polarization
The degree of optical linear polarization and corresponding polarization angle measured in the wavelength range 500-700 nm by the SPOL during the period January 1, 2010 and March 31, 2010 (MJD 55197-55286) are displayed in Figure 1(d-e). The polarization measurements between the two vertical lines are near simultaneous observations during the X-ray and –ray outburst of the blazar Mrk 421 in February 2010. It is evident from Figure 1(d) that the degree of optical linear polarization decreases during the flaring activity in high energy bands. The maximum degree of linear polarization measured during the time interval of outburst is comparable to the minimum degree of polarization observed during the period without flaring episode. The degree of linear polarization during the peak of X-ray and –ray outburst observed around February 16-17, 2010 (MJD 55243-55244) is found to be lowest ( 1.6). A constant fit to the degree of polarization measured during the flaring episode gives an average polarization of 2.230.31, which is only 50 of the average polarization 4.240.18 estimated using the measurements excluding the period of X-ray and –ray outburst. This suggests that the optical linear polarization reduces significantly during the flaring activity of the source. The time variation of the polarization angle shown in Figure 1(e) suggests that the polarization angle measured during the period of this study randomly changes from 114∘ to a maximum of 163∘. During the period of X-ray and –ray outburst (time interval between the vertical lines in Figure 1), the polarization angle varies between 126∘–155∘. This indicates that the variation in polarization angle during the flaring activity is within the values measured for the periods before and after the outburst. The polarization angle for Mrk 421 is found to have a preferred mean value of 137∘ during January 1, 2010 and March 31, 2010 (MJD 55197-55286) and it does not change significantly during the X-ray and –ray outburst of the source. The value of the polarization angle as 180∘ indicates that the polarization vector is aligned along north-south direction and it increases going east of north.
The linear polarization of incoherent synchrotron emission is complex with its real and imaginary parts as observable quantities. It can be expressed as (Burn, 1966; Sokoloff et al., 1998)
| (1) |
where and are the observed degree and angle of linear polarization respectively. The observable quantities and are estimated in terms of the measured Stokes parameters using the relations
| (2) |
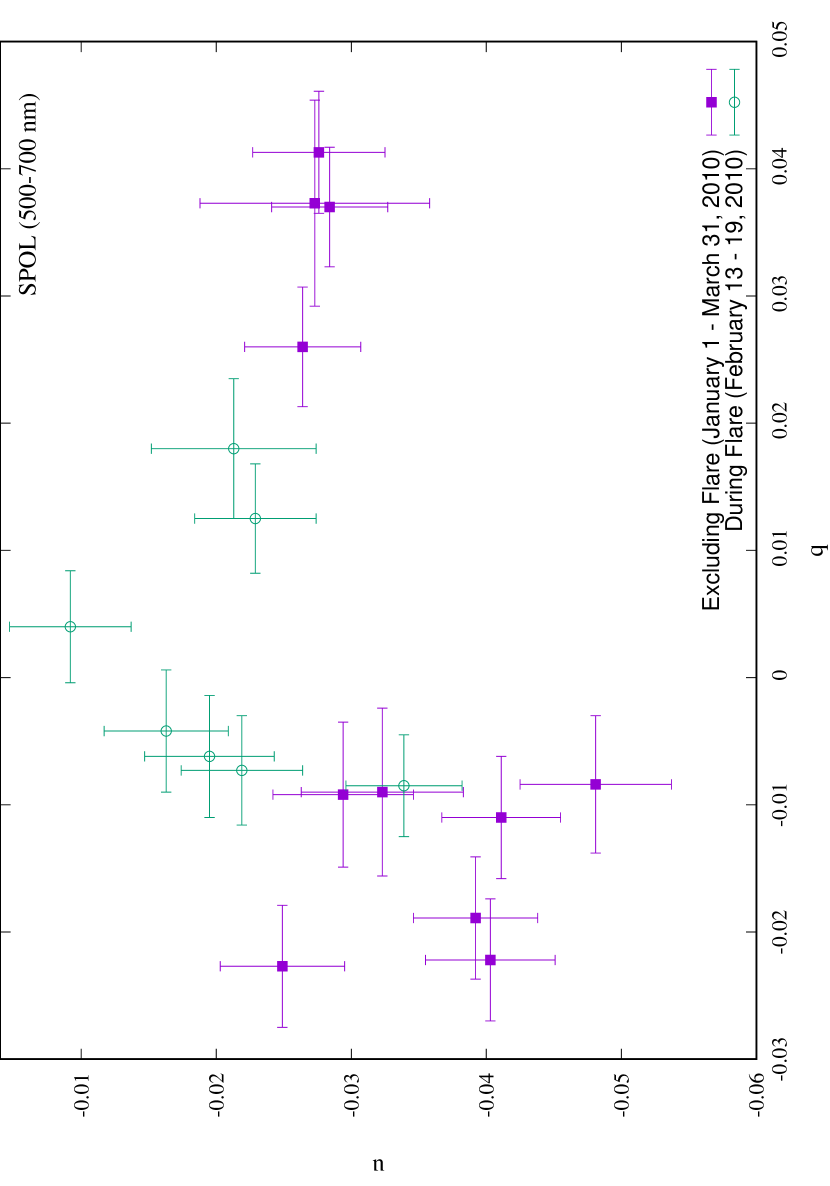
where and are Stokes parameters normalized by the total synchrotron intensity (I). The relation between Stokes parameters indicates that is a linear function of and slope of the line (tan ) corresponds to the angle of polarization. The scatter plot ( versus ) of the measured mean values of the normalized Stokes parameters for individual observations with the SPOL is shown in Figure 2 to understand the polarimetric behavior of the blazar Mrk 421 during January 1, 2010 – March 31, 2010 (MJD 55197-55286). The distance of individual points from the origin of plot gives the degree of linear polarization. The Stokes parameters depicted in Figure 2 are observed to be linearly correlated and a linear fit gives the slope of the line to be 0.130.10. However, no strong conclusion can be drawn from the scatter plot due to large error bars and less data points. The linear polarization reported in Figure 1(d) has been corrected for the statistical bias associated with this being a positive definite quantity. We note that no correction for thermal emission contamination from the host galaxy of the source is applied in the degree of polarization measurements by the SPOL. The effect of host galaxy contamination on the linear polarization is discussed in Section 5.1.
4.3 Variability and Correlations
The observation of highly variable and polarized radiation at optical and radio wavelengths is one of the important characteristics of broadband emissions from blazars during the flaring episodes. We use three different statistical parameters to characterize the variability in optical and radio emissions from the blazar Mrk 421 during the X-ray and –ray outbursts observed during February 2010 (Figure 1). To quantify the intrinsic variability, we first estimate the fractional variability () which is defined as (Vaughan et al., 2003; Singh et al., 2018)
| (3) |
and the error in is given by
| (4) |
where is the variance, is the mean square measurement error, is the mean and is the number of measurements available in a given period. This parameter takes into account the uncertainties in the measurement of a physical quantity and gives degree of intrinsic variability of the source. The value of close to zero implies no significant variability whereas value close to one indicates strong variability. Next, we use the amplitude of variation () to calculate the peak-to-peak variability, which is expressed as (Heidt & Wagner, 1996; Singh et al., 2018)
| (5) |
and the error in is given by
| (6) |
where and are the maximum and minimum values of the measurement with uncertainties and respectively, is the error in mean, and is the average measurement error. The third parameter we estimate is the relative variability amplitude () or variability index, which is defined as (Kovalev et al., 2005; Singh et al., 2018)
| (7) |
and the uncertainty on is given by
| (8) |
The variability parameters described above have been computed for all the observables reported in Figure 1 for two epochs namely during the flare and excluding the flare. The values of the above variability parameters estimated for the two epochs are given in Table 1 & 2 respectively. The values calculated for optical emission (V and R bands) during the two epochs are nearly similar and consistent with the long term quiescent behavior of the source. This indicates that there is no sign of strong intrinsic variability present in the optical emissions during the X-ray and –ray outburst of Mrk 421. The values of for radio emission at 15 GHz also do not shown any significant variability. However, the values of and parameters estimated for the optical emissions (V and R bands) during the period without flaring episode are larger than the values during outburst. This can be attributed to the relatively high optical activity state of the source observed prior to the X-ray and –ray outburst. The values for the degree of polarization hint that the optical polarization is more variable during the X-ray and –ray outburst than the period excluding the flaring episode. and parameters which mainly depend on the peak values of the observables are also found to be relatively higher during the flaring episode for the linear polarization. This is consistent with the fact that the linear polarization is observed to decrease to its lowest value of 1.6 during the period of outburst. The three variability parameters estimated for the polarization angle during both epochs do not show any significant change in their values. The variability analysis using the above three parameters suggests that the optical and radio fluxes do not exhibit variability during the flaring episode. Whereas, X-ray and –ray emissions from the blazar Mrk 421 are characterized by significant variability during the period of outburst in February 2010 (Singh et al., 2015). This indicates that the emissions from Mrk 421 in low and high energy bands are not co-spatial during the giant flaring activity of the source.
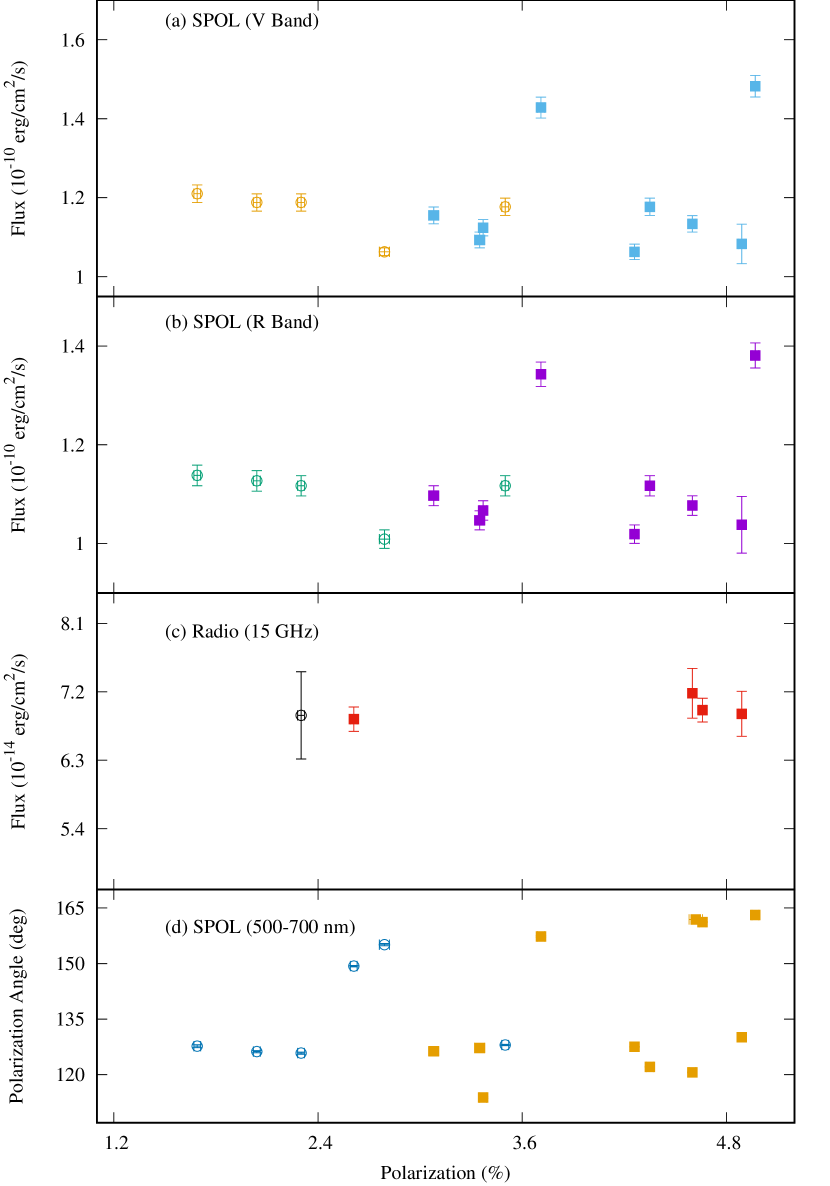
We also estimate the Pearson’s correlations coefficients to probe the intrinsic correlation of the optical-radio flux and polarization angle with the simultaneously observed degree of linear polarization. The Pearson’s coefficient characterizes the linear correlation between two observables related to the broadband emission from the sources like blazars. The optical flux in two bands (V and R), radio flux at 15 GHz and angle of polarization are plotted against the near simultaneous measurement of degree of linear polarization in Figure 3 for the periods during the flare and excluding the flare of the blazar Mrk 421. The visual inspection of Figure 3 and estimated values of Pearson’s coefficients (0.20) both suggest that the degree of linear polarization is very weakly correlated with other observables during the two epochs. This is found to be compatible with the variability analysis described above for different physical quantities measured from the blazar Mrk 421. Very weak or no correlation has been reported between the TeV –ray emissions and near simultaneous optical and radio flux measurements during the flaring activity of Mrk 421 detected in February 2010 (Singh et al., 2015). However, a strong correlation between –ray and X-ray fluxes derived during the same period supports one zone SSC process for high energy emission from the blazar Mrk 421. This also suggests that the broadband emissions in low (optical and radio) and high (X-ray and –ray) energy bands can be produced from different regions in the jet of Mrk 421 during the outburst.
5 Discussion
5.1 Intrinsic Jet Polarization
The degree of polarization is quantified as the fraction of polarized flux measured from a source. The synchrotron emissions from the relativistic jet of blazars are characterized by strong linear polarization in optical and radio bands. However, several depolarization effects like host galaxy contamination and wavelength dependent Faraday rotation play an important role in decreasing the degree of synchrotron polarization. The degree of linear synchrotron polarization intrinsic to the jet is given by (Carnerero et al., 2017)
| (9) |
where and are the measured degree of linear polarization and flux in a given wavelength band respectively and is the unpolarized flux contribution from the host galaxy. The polarization measurement by the SPOL in the wavelength range 500-700 nm has an effective wavelength close to the R band. The host galaxy contribution due to the thermal emission in R band is estimated to be 3.6810-11 erg cm-2 s-1 (Carnerero et al., 2017). The average optical flux in R band observed from the source during the period of X-ray and –ray outburst is 1.0910-10 erg cm-2 s-1 (Section 4.1). This indicates that the host galaxy contribution is 30 of the observed flux from the blazar Mrk 421 and hence its effect on the depolarization of the synchrotron radiation from the jet will be significant. The intrinsic polarization to the jet in R band is found to be (Equation 9). In V band, the contamination of host galaxy ( 1.3710-11 erg cm-2 s-1) is relatively small as compared to R band (Nilsson et al., 2007). This implies that the host galaxy has significant depolarization effect on the linear synchrotron polarization measured from the jet of Mrk 421 in optical R band. In 1966, Burn proposed that the degree of polarization can be expressed as (Burn, 1966)
| (10) |
where is the observational wavelength. Spectropolarimetric study of blazars also suggests the wavelength dependence of the degree of linear polarization (Kulshrestha et al., 1987; Blinov et al., 2016). Therefore, Faraday dispersion can depolarize the synchrotron polarization due to the wavelength dependence of its rotation measure (RM ) in the optical band. However, we are not able to explore the depolarization effect of Faraday rotation in this work due to the unavailability of the near simultaneous observations of polarization in different wavelength bands. According to Jones et al. (1985), the synchrotron radiation from blazars can be depolarized due to the superposition of emissions from more than one region in the jet with independent orientation of magnetic fields and it can predict smaller variability for BL Lacs type of blazars (characterized by more than one emission regions). The emission regions in the jet can be filled with relativistic electron populations of different energy distributions (Jones et al., 1985; Björnsson, 1985). Here, we consider only the depolarization effect of host galaxy contamination in R band to estimate the intrinsic jet polarization using the observed degree of polarization in the wavelength band 500-700 nm from the SPOL observations.
5.2 Linear Synchrotron Polarization
For blazars, it has been widely accepted that the non-thermal emission at radio and optical frequencies is the synchrotron radiation due to ultra-relativistic leptons (electrons/positrons) in the magnetic field of localized regions which move relativistically along the jet axis. Owing to the synchrotron origin, the radiation emitted in these frequency bands is expected to be highly polarized depending on the nature and geometry of the magnetic field in the emission region. The general formalism for estimating the degree of polarization of the radiation produced by the synchrotron process is properly understood in the literature (Westfold, 1959; Legg & Westfold, 1968). The degree of polarization measured at radio wavelengths is observed to be less than that in optical bands. This suggests that the optical emission is produced from a smaller region with more uniform and ordered magnetic field in comparison to the radio emission (Jorstad et al., 2013). In the present study, we consider a simple scenario that there are two emission regions in the jet of Mrk 421 during the flaring episode in February 2010 where optical emission comes from one region and X-ray and –ray are produced from another region. The optical emission observed in V and R bands is attributed to the synchrotron radiation of the relativistic electrons in the emission region. The electrons are assumed to be accelerated to relativistic energies by the well known first order Fermi acceleration process before injecting into the emission region. The energy spectrum of relativistic electrons in the emission region can be approximated by a power law of the form
| (11) |
where is the electron spectral index and and are the minimum and maximum electron Lorentz factors respectively. The magnetic field in the emission region () is considered to be
| (12) |
where is the strength of ordered magnetic field produced by shocks and is the strength of chaotic magnetic field. The synchrotron photons produced by the above population of electrons (Equation 11) gyrating in the resultant magnetic field (Equation 12) is described by a power law with energy spectral index
| (13) |
The degree of linear polarization () for optically thin synchrotron radiation depends on the photon spectral index (energy distribution of electrons) and structure of the magnetic field. It is expressed as (Westfold, 1959; Björnsson, 1985; Fraija et al., 2017)
| (14) |
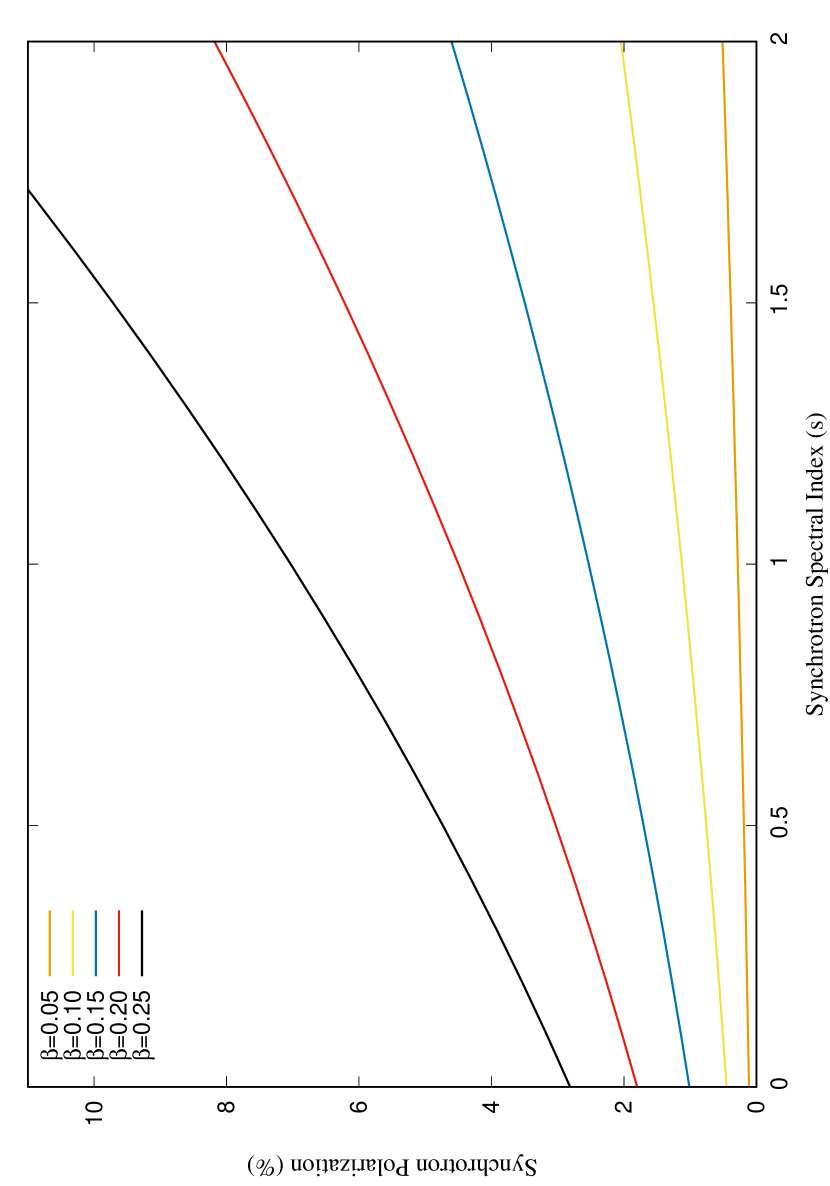
where is the ratio of ordered to chaotic magnetic fields strength in the emission region. The synchrotron radiation from blazars in low energy bands is observed to be optically thin. The expected percentage of synchrotron polarization () as a function of the observed synchrotron spectral index () for different configurations of and is shown in Figure 4. It is evident from Figure 4 that the degree of linear synchrotron polarization for a given synchrotron spectral index () increases monotonically with increase in the ratio of two magnetic fields in the optical emission region. The increasing value of the ratio () implies that the ordered magnetic field dominates over the chaotic magnetic field. A completely isotropic chaotic magnetic field produces synchrotron radiation with zero linear polarization whereas perfectly ordered uniform magnetic field will result in the maximum degree of linear synchrotron polarization of 69–75 for relativistic electrons with typical spectral indices of 2–3. The chaotic magnetic field in the emission region can be compressed by the moving shock waves. If the optical emission region is highly magnetized, a fast moving shock leads to the significant variation in the polarization leaving the flux level unchanged (Zhang et al., 2016).
We compare the theoretical degree of linear polarization () shown in Figure 4 with the intrinsic jet polarization () calculated using the observed polarization () from the SPOL observations (Section 5.1). The results from the comparison of the theoretical and measured degree of polarization during different epochs are summarized in Table 3. It is observed that the measured optical polarization in the wavelength range 500-700 nm by the SPOL is broadly consistent with the theoretically expected synchrotron polarization for spectral index of corresponding to with different values of the ratio of two magnetic fields (). If the spectral distribution of the relativistic electrons is assumed to be described by a power law with index 2.2 in the optical emission region, the change in degree of polarization during different epochs can be attributed to the relative variation in the strength of ordered and chaotic magnetic fields. The lowest value of the linear polarization ( 1.6) measured near simultaneous X-ray and –ray peak around February 16-17, 2010 (MJD 55243-55244) indicates a sudden increase in the strength of chaotic magnetic field component over the ordered magnetic field (0.17) in the emission region. This can happen due to the motion of turbulent plasma which makes the ordered magnetic field tangled keeping the resultant magnetic field constant in the emission region (Begelman, 1998).
Long term optical polarization study in R band using eight years of data suggested that the blazar Mrk 421 exhibits an average degree of linear polarization of 3.5 with preferred polarization angle of 169∘ during the period February 2008 to May 2016 (Fraija et al., 2017). The variability analysis of the polarization in R band indicates that the average values of the degree and angle of polarization can be explained using two different emitting regions where the dominant optical emission originates from a region permeated by a stable magnetic field. Authors have also reported a connection between the polarimetric variations and spatial changes of the magnetic field in relativistic jet of Mrk 421. They have not considered the period of X-ray and –ray outburst of the source detected in February 2010.
6 Conclusion
In this paper, we have studied the behavior of linear polarization in the wavelength range 500-700 nm measured by the spectro-polarimeter at the Steward Observatory during the extreme flaring activity of the blazar Mrk 421 detected around February 16-17, 2010 (MJD 55243-55244). This outburst of the source was observed by many ground and space based multi-wavelength instruments world wide. The flaring activity was detected to be dominant in the X-ray and –ray energy bands. A summary of the nature of optical linear polarization obtained from the present study is given in the following points:
-
•
The optical light curves (V and R bands) indicate a relatively higher emission state of the blazar Mrk 421 in January 2010 prior to the giant X-ray and –ray flare observed around February 16-17, 2010. During the broadband flaring state, the optical emission (V and R bands) does not show any change in the source activity. The radio emission at 15 GHz is also found to be broadly consistent with the long term quiescent state of the source like its optical counterpart. The analysis of the optical emission using 100 year historical light curve of Mrk 421 suggests a variability period of 17 years in R band (Fraija et al., 2017). This explains the the long-term quiescent state of the source in optical bands.
-
•
Variability analysis of the optical (V and R bands) and radio light curves using different parameters indicates the absence of significant variability and the emission is consistent with the quiescent state of Mrk 421 derived from the long term observations. The variability parameters estimated for the period without flaring episode have values higher than that during the outburst due to relatively high optical emission state in January 2010.
-
•
Polarization measurements from the blazar Mrk 421 suggest an average value of 4.2 for the degree of linear polarization in the wavelength range 500-700 nm for the period without flaring activity of the source. The optical linear polarization during February 16-17, 2010 outburst is found to be 1.6 which is less than the average value of 2.2 for the week of X-ray and –ray outburst. This indicates that the degree of optical linear polarization decreases during the flaring activity of the source in the X-ray and –ray energy bands. The angle of polarization has an average value of 137∘ during the entire period.
-
•
Variability analysis of the degree of linear polarization based on different variability parameters suggests that the optical polarization is variable during the X-ray and –ray outburst of Mrk 421. Whereas, angle of polarization does not change significantly. A non-zero positive Pearson coefficient (0.20) for the measured degree of optical linear polarization with optical (V and R bands) and radio fluxes is observed. This indicates possibly the common origin via the synchrotron process in the blazar jet.
-
•
The non-thermal contribution from the host galaxy of Mrk 421 in the R band is observed to play a significant role in depolarizing the linear synchrotron polarization intrinsic to the jet. The degree of linear polarization intrinsic to the jet is found to be approximately 1.5 times higher than the measured value in the wavelength range 500-700 nm by the SPOL after correcting for the contribution from the host galaxy. The estimated intrinsic linear polarization is consistent with the synchrotron polarization produced by the relativistic electrons described by a power law with spectral index of 2.2 in the region filled with ordered and chaotic magnetic fields. The change in linear polarization can be attributed to the ratio of the strength of ordered magnetic field to the chaotic component in the emission region. However, simultaneous measurements of the degree of linear polarization in different optical bands during the flaring episodes are very important to fully explore the physical processes for blazars and effect of wavelength dependent Faraday rotation on the polarized jet emission.
-
•
Our study suggests the presence of two emission regions in the jet of Mrk 421 where optical emission is produced from one region and X-ray and –rays are produced from another region. The optical emission region can be filled with ordered and chaotic magnetic fields and steady population of relativistic electrons. The decrease in optical linear polarization during the X-ray and –ray outburst is caused due to sudden dominance of the chaotic magnetic field over the ordered magnetic field in the emission region. Whereas, the X-ray and –ray flaring activity possibly originates due to the sudden increase in the density of relativistic electrons in the second emission region (Singh et al., 2017).
References
- Urry & Padovani (1995) Urry, C. M. & Padovani, P. 1995, PASP, 107, 803
- Maraschi et al. (1992) Maraschi, L. et al. 1992, ApJ, 397, L5
- Ghisellini et al. (1998) Ghisellini, G. et al. 1998, MNRAS, 299, 433
- Dermer et al. (1992) Dermer, C. D. et al. 1992, A&A, 256, L27
- Sikora et al. (1994) Sikora, M. et al. 1994, ApJ, 421, 153
- Aharonian (2002) Aharonian, F. A. 2002, MNRAS, 332, 215
- Mücke et al. (2003) Mücke, A. et al. 2003, APh, 18, 593
- Abdo et al. (2011) Abdo, A. A. et al. 2011, ApJ, 736, 131
- Fraija & Marinelli (2015) Fraija, N. & Marinelli, A. 2015, APh, 70, 54
- Cui (2004) Cui, W. 2004, ApJ, 605, 662
- Fraija (2015) Fraija, N. 2015, APh, 71, 1
- Ackermann et al. (2016) Ackermann, M. et al. 2016, ApJ, 824, L20
- Singh et al. (2018) Singh, K. K. et al. 2018, APh, 103, 122
- Singh et al. (2019) Singh, K. K. et al. 2019, JASR, 63, 766
- Fan et al. (2008) Fan, J. H. et al. 2008, PASJ, 5, 707
- Visvanathan & Wills (1996) Visvanathan, N. & Wills, B. J. 1998, AJ, 116, 2119
- Zakamska et al. (2005) Zakamska, N. L. et al. 2005, AJ, 129, 1212
- Sbarufatti et al. (2005) Sbarufatti, B. et al. 2005, ApJ, 635, 173
- Punch et al. (1992) Punch, M. et al. 1992, Nature, 358, 477
- Isobe et al. (2010) Isobe, N. et al. 2010, PASJ, 62, L55
- Singh et al. (2012) Singh, K. K. et al. 2012, NewA, 17, 679
- Tluczykont et al. (2011) Tluczykont, M. et al. 2011, arXiv:1106.1035
- Fortson et al. (2012) Fortson, L. et al. 2012, AIPCS, 1505, 514
- Shukla et al. (2012) Shukla, A. et al. 2012, A&A, 541, 140
- Singh et al. (2015) Singh, K. K. et al., 2015, APh, 61, 32
- Bartoli et al. (2016) Bartoli, B. et al. 2016, ApJS, 222, 6
- Zheng et al. (2014) Zheng, Y. G. et al., 2014, MNRAS, 442, 3166
- Singh et al. (2017) Singh, K. K. et al. 2017, NewA, 54, 24
- Niinuma et al. (2012) Niinuma, K. et al. 2012, ApJ, 759, 84
- Smith et al. (2009) Smith, P. S. et al. 2009, arXiv:0912.3621
- Richards et al. (2011) Richards, J. L. et al. 2011, ApJS, 194, 29
- Nilsson et al. (2007) Nilsson, K. et al. 2007, A&A, 475, 199
- Burn (1966) Burn, B. J. 1966, MNRAS, 133, 67
- Sokoloff et al. (1998) Sokoloff, D. D. et al. 1998, MNRAS, 299, 189
- Vaughan et al. (2003) Vaughan, S. et al. 2003, MNRAS, 345, 1271
- Heidt & Wagner (1996) Heidt, J. & Wagner, S. J. 1996, A&A, 305, 42
- Kovalev et al. (2005) Kovalev, Y. Y. et al. 2005, AJ, 130, 2473
- Carnerero et al. (2017) Carnerero, M. I. et al., 2017, MNRAS, 472, 3789
- Kulshrestha et al. (1987) Kulshrestha, A. et al. 1987, A&AS, 71, 565
- Blinov et al. (2016) Blinov, D. et al. 2016, MNRAS, 462, 1775
- Jones et al. (1985) Jones, T. W. et al. 1985, ApJ, 290, 627
- Björnsson (1985) Björnsson, C. I. 1985, MNRAS, 216, 241
- Westfold (1959) Westfold, K. C. 1959, ApJ, 130, 241
- Legg & Westfold (1968) Legg, M. P. C. & Westfold, K. C. 1968, ApJ, 154, 499
- Jorstad et al. (2013) Jorstad, S. G. et al. 2013, AJ, 773, 147
- Fraija et al. (2017) Fraija, N. et al. 2017, ApJS, 232, 7
- Zhang et al. (2016) Zhang, H. et al. 2016, ApJ, 817, 63
- Begelman (1998) Begelman, M. C. 1998, ApJ, 493, 291
| Observables | (%) | ||
|---|---|---|---|
| Optical flux (V) | 0.170.05 | 9.101.96 | 0.050.01 |
| Optical flux (R) | 0.170.05 | 5.861.56 | 0.060.01 |
| Radio (15 GHz) | 0.340.18 | – | 0.060.01 |
| Linear Polarization | 0.340.09 | 67.638.78 | 0.550.07 |
| Polarization Angle | 0.170.04 | 28.401.21 | 0.100.01 |
| Observables | (%) | ||
|---|---|---|---|
| Optical flux (V) | 0.160.04 | 31.623.07 | 0.160.01 |
| Optical flux (R) | 0.150.04 | 28.762.94 | 0.150.01 |
| Radio (15 GHz) | 0.070.01 | 8.915.4 | 0.050.01 |
| Linear Polarization | 0.170.03 | 41.192.26 | 0.230.04 |
| Polarization Angle | 0.160.03 | 33.231.62 | 0.170.01 |
| Epoch | Time Interval (MJD) | |||
|---|---|---|---|---|
| Excluding Flare | January 1 -March 31, 2010 (55197–55286) | 4.2 | 6.4 | 0.28 |
| During Flare | February 13-19, 2010 (55240–55246) | 2.2 | 3.4 | 0.20 |
| Near Flare | February 16-17, 2010 (55243–55244) | 1.6 | 2.4 | 0.17 |