Optimal neutron-star mass ranges to constrain the equation of state of nuclear matter with electromagnetic and gravitational-wave observations
Abstract
Exploiting a very large library of physically plausible equations of state (EOSs) containing more than members and yielding more than stellar models, we conduct a survey of the impact that a neutron-star radius measurement via electromagnetic observations can have on the EOS of nuclear matter. Such measurements are soon to be expected from the ongoing Neutron Star Interior Composition Explorer mission and will complement the constraints on the EOS from gravitational-wave detections. Thanks to the large statistical range of our EOS library, we can obtain a first quantitative estimate of the commonly made assumption that the high-density part of the EOS is best constrained when measuring the radius of the most massive, albeit rare, neutron stars with masses . At the same time, we find that radius measurements of neutron stars with masses can provide the strongest constraints on the low-density part of the EOS. Finally, we quantify how radius measurements by future missions can further improve our understanding of the EOS of matter at nuclear densities.
=3
1 Introduction
The recent detection of gravitational waves (GW) from the inspiral of two neutron stars, i.e., GW170817 (Abbott et al., 2017), in combination with the observation of its electromagnetic counterpart (The LIGO Scientific Collaboration et al., 2017) has already led to a number of astrophysical constraints on the nuclear equation of state (EOS; Bauswein et al., 2017; Margalit & Metzger, 2017; Paschalidis et al., 2017; Shibata et al., 2017; Abbott et al., 2018; Annala et al., 2018; Burgio et al., 2018; De et al., 2018; Fattoyev et al., 2018; Lim & Holt, 2018; Malik et al., 2018; Montana et al., 2018; Most et al., 2018; Radice et al., 2018; Raithel et al., 2018; Rezzolla et al., 2018; Ruiz et al., 2018; Tews et al., 2018; Gill et al., 2019; Köppel et al., 2019; Lim & Holt, 2019; Tews et al., 2019). In the near future, these constraints are expected to be complemented by precise measurements of neutron-star masses and radii via electromagnetic observations yielding constraints similar to that of a distant GW event (McNeil Forbes et al., 2019). The Neutron Star Interior Composition Explorer (NICER) (Arzoumanian et al., 2014; Gendreau et al., 2016) is set to deliver these constraints via X-ray modeling (see Watts et al., 2016, for a review). Anticipating these results, considerable work has been dedicated toward inferring the EOS from electromagnetic observations via Bayesian inference and different parametrizations for the EOS (Özel & Psaltis, 2009; Read et al., 2009; Steiner et al., 2010; Raithel et al., 2017; Miller et al., 2019).
In this work we combine the GW constraints with possible mass and radius observations as those expected from NICER. A similar study that combines constraints has recently been undertaken by Fasano et al. (2019), who, in addition to the GW constraints, also used in their Bayesian analysis radius measurements from thermonuclear bursts in accreting neutron stars (see also Guillot et al., 2013; Lattimer & Steiner, 2014; Özel et al., 2016, for earlier studies).
We here assess how much the already constrained EOS will be further restricted by precise measurements of the neutron-star radius. Greif et al. (2018) have recently shown that inferring properties of dense matter via Bayesian analysis from any astrophysical observations, i.e., from GW constraints or constraints on the neutron-star mass and radius, depends sensitively on the prior assumptions of the underlying EOS parameterization. In view of this, we do so not by relying on a Bayesian analysis or any approach involving probabilities. Rather, we consider a very large sample of EOSs whose completeness allows us to span the whole range of physically plausible EOSs given a generic and conservative parameterization. Using much smaller samples, similar approaches have already been employed in the past, (e.g., Hebeler et al., 2013; Kurkela et al., 2014; Annala et al., 2018), and allow for general statements that are valid independently of prior assumptions. This is true as long as the EOS sample is sufficiently large to provided convergent results as in the case of our EOS library (see also the Appendix). In this way, by considering a large set of possible outcomes of the NICER mission, we are able to assess the impact of future radius observations on our ability to further constrain the EOS and to specify the most promising mass ranges to be targeted for deriving the tightest constraints.
2 Methods
In order to relate possible neutron-star radius measurements to the EOS, we consider equilibrium neutron-star models that are solutions to the Tolman-Oppenheimer-Volkoff (TOV) equations constructed from a comprehensive set of different EOSs obeying recent constraints from GW and kilonova observations (Most et al., 2018). These EOSs are constructed following the approach of Most et al. (2018) (see also Kurkela et al., 2014, for a similar approach), by combining state-of-the art calculations from chiral effective field theory (CEFT) (Drischler et al., 2016, 2017), describing the behavior of nuclear matter accurately close to nuclear-saturation density, together with results from perturbative QCD (pQCD) calculations (Kurkela et al., 2010; Fraga et al., 2014) for the high-density regime. We model the remaining region typically found in the core of neutron stars by parameterizing the EOS with piecewise polytropes. We only allow for EOSs that are causal, i.e., for which the speed of sound, , is smaller than the speed of light, and are able to support a mass of at least (Antoniadis et al., 2013). By matching to the pQCD limit, all of our EOSs automatically fulfill the criterion that asymptotically the sound speed is given by .
In this way, we have constructed a set of physically plausible EOSs from which we have computed stellar models. All of our EOSs are purely hadronic and hence do not account for a first-order phase transition. While this is a limitation that we will address in a future work, stellar models with phase transitions have been found to represent a small fraction of the physically plausible EOSs (Most et al., 2018). To this set, which we refer to as the “complete” set, we apply the constraints derived from the GW event GW170817 (Abbott et al., 2017, 2018). These constraints have been derived in several works and can be summarized as follows:
(i) The maximum mass reached by a sequence of nonrotating neutron stars does not exceed (Margalit & Metzger, 2017; Shibata et al., 2017; Rezzolla et al., 2018; Ruiz et al., 2018). This is a conservative value for the maximum mass that agrees with the error bounds of the four papers listed above. We also compare our results to the case of a higher value for this upper limit, i.e., , as suggested in Shibata et al. (2019) and in agreement with the upper bound of Rezzolla et al. (2018). A discussion in the Appendix will illustrate how a different choice of the maximum mass impacts our results only marginally.
(ii) The tidal deformability of a star, , is constrained to be in the range , where the upper limit is the observational constraint from GW170817 (Abbott et al., 2018), while the lower limit is deduced from the analysis of Most et al. (2018) and is consistent with a number of other studies (Abbott et al., 2018; Coughlin et al., 2018; De et al., 2018; Kiuchi et al., 2019).
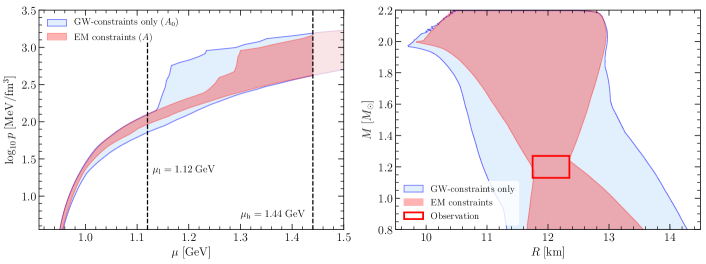
Imposing these constraints reduces our set of EOSs considerably, leaving us with of the complete set. We refer to this reduced library as the “constraint-satisfying” set and it is marked with the light blue area in Fig. 1, whose left panel provides a representation in the pressure-chemical potential plane, , while the right panel in the mass-radius plane .
A number of remarks are useful at this point. First, it is essential that the sample of EOSs considered is sufficiently large so as to provide a robust statistical representation after the GW constraints are imposed. We have verified that this is the case by considering sets of , , and EOSs, which all provide the same statistical results. Second, the evidence that the GW constraints remove about of the physically plausible EOSs, underlines the importance of a sufficiently large sample of EOSs that allows for convergent results (see the discussion in the Appendix). Third, several works have also derived constraints on the radius of a star (Annala et al., 2018; Burgio et al., 2018; De et al., 2018; Malik et al., 2018; Most et al., 2018; Raithel et al., 2018; Tews et al., 2018); these constraints are compatible with our range of admissible tidal deformabilities. Fourth, the range for is also in agreement with constraints stemming from the threshold mass to prompt collapse (Bauswein et al., 2017; Köppel et al., 2019). Finally, Gamba et al. (2019) have recently shown that while the constraints on the radius might sensitively depend on the description of the EOS for the neutron-star crust, the constraints on are more robust.
To quantify how well potential observations of neutron-star radii can further constrain the EOS in addition to the constraints already imposed, we need to define a measure of the degree to which an EOS is constrained. More specifically, because the pressure is a thermodynamical potential that fully describes the EOS at , we consider as a reference measure of the properties of our EOS library the area spanned by the constraint-satisfying set of EOSs in our sample, i.e.,
| (1) |
where the maximum and minimum in the integral is taken at each point and over the set of constraint-satisfying EOSs. We choose which is the largest chemical potential found in our constraint-satisfying sample and reflects the fact that neutron stars cannot probe the EOS beyond the largest densities found in their cores (the highest number density in our sample is , where is the nuclear-saturation density). Note that by varying the range in the chemical potential over which the integral in Eq. (1) is performed we can probe in a differential manner the low-density and the high-density regimes of the EOS. In particular, we will define the low (high)-density reference areas () if the integral (1) is instead performed in the range (), where 111This value corresponds roughly to where we match the EOS from CEFT. Since the matching is done at a fixed number density, it corresponds to different values of for each EOS. (see black dashed lines in Fig. 1).
Having defined a reference area , we can ask how it changes when we impose an additional constraint from a hypothetical mass and radius measurement. For simplicity we represent such an observation in terms of a square box in the plane whose boundaries are determined by the errors of the measurement. Any EOS not passing through this box can then be discarded as being in disagreement with the observation. An illustration of this logic is shown in Fig. 1, where the new area is represented by the red-shaded area and where a hypothetical measurement has been made of a neutron star with mass and radius (red box in Fig. 1). In this way, we can measure the “degree of constraint” (DOC) of the observation simply as
| (2) |
where refers to a measurement that is not constraining the EOS appreciably, while would indicate a measurement that can set significant constraints on the EOS, as when the red-shaded area in Fig. 1 shrinks to a line. In logical analogy with the definition of (2), we can measure the DOCs for the low (high)-density region of the EOS, (, by simply replacing and with the corresponding areas computed when ().
Using these definitions, we can now assess how well a given mass/radius measurement would constrain the EOS and, more importantly, which part of the EOS is actually constrained. Before doing that, however, we underline that the DOC, , depends on the prior with which the EOSs are constructed. As long as the EOS sample size is large enough, however, all DOCs computed with any prior will converge to the same value. This is an important added value of our approach compared with other works.
3 Results
Hereafter, we will consider three main cases that are believed to be possible outcomes of the NICER mission (Arzoumanian et al., 2014; Watts et al., 2016), namely (see also Greif et al., 2018, for similar choices):
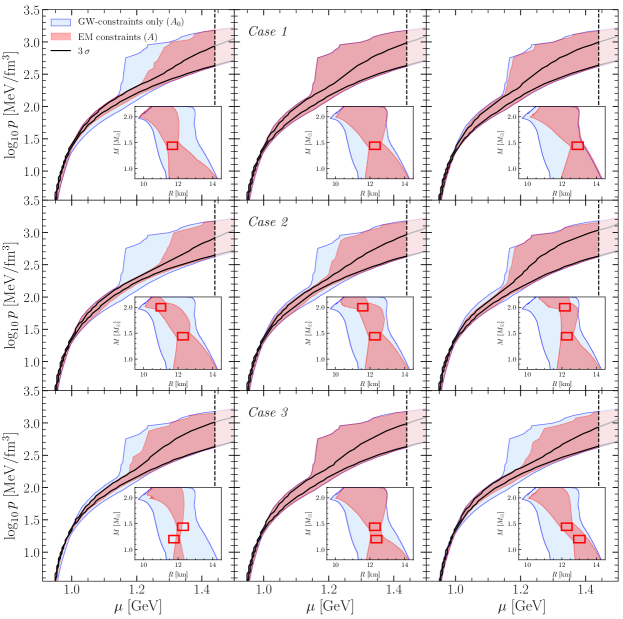
Case 1: Only one of the primary targets, i.e., PSR J0437-4715, with a mass of will be successfully measured yielding a radius of .
Case 2: Both primary targets, i.e., PSR J0437-4715 and PSR J0030+0451 will be successfully measured. For the latter the mass is unknown and we here consider a massive star with with the same error as for PSR J0437-4715. For the radius we assume .
Case 3: The same as Case 2, but with for PSR J0030+0451 and a radius of .
The radii in the cases above are taken as the most likely values reported by Most et al. (2018), together with a relative error on the radius (Arzoumanian et al., 2014) and a fixed uncertainty of for the mass222For a larger error of , or uncertainty in the radius measurement, we obtain essentially the same results, with slightly smaller values for the DOCs., where the latter is motivated by the typical accuracy of known neutron-star masses (Özel & Freire, 2016).
Shown in the middle panel of the first row of Fig. 2 is a graphical representation of how the DOC is defined, i.e., as the ratio of the red to the blue area. This panel shows these areas for Case 1 (shown in the inset are the corresponding areas in the plane). Note that in this case as the blue- and red-shaded areas essentially coincide, thus indicating that a measurement of this type would constrain the EOS only marginally. Similar considerations apply also when examining a measured radius that is larger, as indicated in the top right panel of Fig. 2. On the other hand, the top left panel, which refers to a measured radius that is smaller, shows that , thus indicating that measuring a compact star would provide important constraints on the EOS. Stated differently, given a star, the most significant constraints on the EOS would be obtained if the star had a radius .
Similar conclusions follow also for Cases 2 and 3, which are reported, respectively, in the central panel of rows two and three of Fig. 2, while the corresponding left/right panels refer to the same cases, but assuming a smaller/larger radius for PSR J0030+0451. As a reference, we also show with black solid lines the confidence levels obtained by computing the probability distribution function (PDF) via a Bayesian analysis where we use the maximum of a bivariate Gaussian distribution within the red box in the plane for the likelihoods (as done in, e.g., Raithel et al., 2017), and the PDF obtained by Most et al. (2018) as prior. The area encompassed by these lines shows that even when , constraints on the EOS may still be obtained within a given confidence level. In particular, for the high-density part of the EOS the confidence intervals remain unchanged under various radius measurements. Because the precise measure of these constraints will depend upon the choice of prior used for the Bayesian analysis (Greif et al., 2018), we will here use the DOC defined in Eq. (2), which is free of this bias as it only compares the outer limits of the EOS space covered, for which we can show convergence irrespective of the prior.
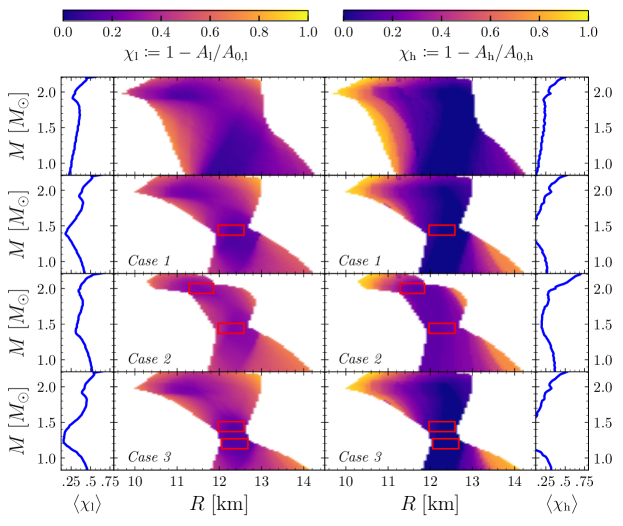
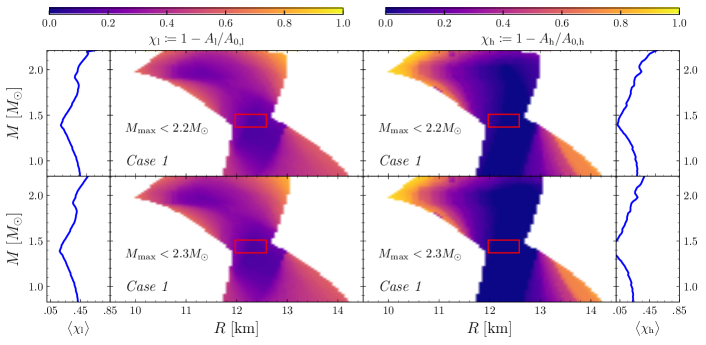
The first row of Fig. 3 shows with a colorcode for each point in the plane the DOC when an observational box is centered around that point. In other words, we consider the DOC for all possible mass/radius measurements. Note that we now distinguish the DOCs relative to the low- (left panel) and high-density (right panel) regions of the EOS. Obviously, an observation providing a box at the edges of the area spanned in the plane would provide the best constraints as the underlying EOSs there are the scarcest. The left and right side columns of Fig. 3 show with blue lines the averaged DOCs , namely, the radial averages of and taken at a fixed mass. It is then evident that the best constraints on the EOS can be expected from measuring the radius of a neutron star that is as massive as possible, because these stars have densities in their cores for which the EOS is least known. Interestingly, Fig. 3 also shows that there is a local maximum for around , thus suggesting that – apart from very massive and rare stars with – a radius measurement in the range of would yield the best constraints on the low-density regime of the EOS. While this is true only on average and the DOC will depend on the exact measured value, this is the first time that such an evidence is found. We also remark that if going to higher masses yields smaller DOCs, this is most likely due to the presence of a lower limit on the maximum mass .
The last three rows of Fig. 3 show the same DOCs for Case 1-3 and hence describe the degree to which the EOS is constrained for an additional radius measurement beyond NICER. In all three cases, the local maximum around is again present for , underlining the importance that a star in this mass range would have on constraining the low-density regime of the EOS.
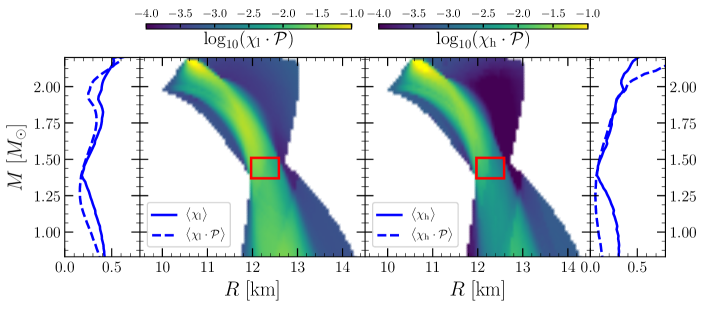
The averaged DOCs seem to suggest that the EOS would be considerably constrained also for a radius measurement of a star with , thus making low-mass stars almost as promising as the high-mass ones. Such large averaged DOCs are the results of the increase in following the measurement of a low-mass star with a large radius (i.e., ; see the orange part of the right panels for in Fig. 3). In practice, however, such large DOCs do not take into account that in our library a large radius for such low-mass stars is rare and hence unlikely to be observed. This can be countered by convolving the DOC with the PDF of encountering a star with a given mass and radius. While a trivial step to take given that we already have this information (Most et al., 2018), it also introduces a new direct dependency on the prior used in building the set of EOSs, and would sacrifice the general validity of our results.
Notwithstanding this, we report in Fig. 4 the result of such weighting and show the PDF-weighted DOCs, , and the averaged PDF-weighted DOCs, , for Case 1, with the PDF here being the same as that used for the computation of the lines in Fig. 2. In this way, we learn that while large DOCs for a star are robust, this is not the case for a low-mass star with mass . This is particularly evident for the high-density part of the EOS, for which . We find this behavior in all scenarios: while a large is robust and indicative of a genuine high DOC, a large at low masses may need to be weighted by the probability of finding stars in this mass range with such extreme radii.
4 Conclusions
We have presented an extensive survey of how electromagnetic measurements of masses and radii of neutron stars, when combined with the constraints from GW170817, will provide information on the EOS of nuclear matter. Our findings confirm the expectation that radius measurements of stars with masses represent the most effective manner of setting constraints on the highest-density regimes of the EOS. At the same time, our analysis reveals the existence of an optimal mass range of , which would yield the best constraints on the low-density regime of the EOS with observations beyond those made by the NICER mission. Finally, low-mass stars with , could also provide significant constraints on the low-density regime of the EOS.
The library of EOSs and stellar models presented here and providing a convergent and complete coverage of physically plausible EOSs, is publicly available online 33310.5281/zenodo.3260991 (Weih et al., 2019) and can be used as new GW detections of merging neutron-star binaries or mass/radius measurements become available. Such detections can be employed to provide even more stringent constraints on the properties of the EOS of nuclear matter. The library will also be updated to incorporate phase transitions and new observational constraints, such as those on the maximum mass via the binary system PSR J0740+6620 (Thankful Cromartie et al., 2019).
Acknowledgements
It is a pleasure to thank Cole Miller, Cecilia Chirenti and Anna Watts for useful discussions. Support comes also in part from HGS-HIRe for FAIR; the LOEWE-Program in HIC for FAIR; “PHAROS”, COST Action CA16214 European Union’s Horizon 2020 Research and Innovation Programme (grant 671698) (call FETHPC-1-2014, project ExaHyPE); the ERC Synergy Grant “BlackHoleCam: Imaging the Event Horizon of Black Holes” (grant No. 610058).The calculations were performed on the GOETHE cluster at CSC in Frankfurt.
In this Appendix we provide additional information on some of the issues discussed in the main text.
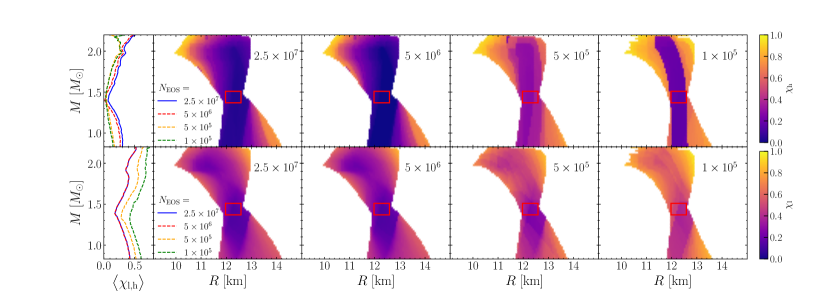
We start with providing convincing evidence that our results have been obtained with a sufficiently large sample of EOSs to be statistically robust and significant. In particular, the convergence of our results is reported in Fig. 5, which highlights the importance of having a large enough sample of EOSs for reaching convergent results. With smaller samples it is of course still possible to obtain statistical results via, e.g., Bayesian analysis. For results over the whole range of physically plausible EOSs, however, we find that at least EOSs are necessary for our parameterization to populate also the rare EOSs at the very stiff and soft ends of the spectrum. This is mostly necessary because the largest part of our sample, i.e., of it, is excluded after applying the GW constraints and it is further reduced when applying the constraints from a hypothetical radius measurement.
Next, we show that our results are robust with respect to the precise value chosen for the upper limit on the maximum mass . Although the value of is in agreement with a number of studies each using different methods (Margalit & Metzger, 2017; Shibata et al., 2017; Rezzolla et al., 2018; Ruiz et al., 2018), it has recently been argued that this upper limit might be higher and that it is weakly constrained to be (Shibata et al., 2019) which is consistent with the upper uncertainty bound provided by Rezzolla et al. (2018), namely, . To assess the validity of our results we report in Fig. 6 the changes in the DOCs when considering this higher value. As it can be deduced clearly when comparing the results in the top () and bottom panels () of Fig. 6, the impact of considering a larger maximum mass is only marginal. More importantly, the evidence that the mass range around provides the optimal constraint for remains unchanged.
References
- (1)
- Abbott et al. (2017) Abbott, B. P., et al. 2017, Phys. Rev. Lett., 119, 161101, doi: 10.1103/PhysRevLett.119.161101
- Abbott et al. (2018) Abbott, B. P., Abbott, R., Abbott, T. D., et al. 2018, Physical Review Letters, 121, 161101, doi: 10.1103/PhysRevLett.121.161101
- Annala et al. (2018) Annala, E., Gorda, T., Kurkela, A., & Vuorinen, A. 2018, Phys. Rev. Lett., 120, 172703, doi: 10.1103/PhysRevLett.120.172703
- Antoniadis et al. (2013) Antoniadis, J., Freire, P. C. C., Wex, N., et al. 2013, Science, 340, 448, doi: 10.1126/science.1233232
- Arzoumanian et al. (2014) Arzoumanian, Z., Gendreau, K. C., Baker, C. L., et al. 2014, in Proc. SPIE, Vol. 9144, Space Telescopes and Instrumentation 2014: Ultraviolet to Gamma Ray, 914420, doi: 10.1117/12.2056811
- Bauswein et al. (2017) Bauswein, A., Just, O., Janka, H.-T., & Stergioulas, N. 2017, Astrophys. J. Lett., 850, L34, doi: 10.3847/2041-8213/aa9994
- Burgio et al. (2018) Burgio, G. F., Drago, A., Pagliara, G., Schulze, H.-J., & Wei, J.-B. 2018, Astrophys. J., 860, 139, doi: 10.3847/1538-4357/aac6ee
- Coughlin et al. (2018) Coughlin, M. W., Dietrich, T., Margalit, B., & Metzger, B. D. 2018, arXiv e-prints. https://arxiv.org/abs/1812.04803
- De et al. (2018) De, S., Finstad, D., Lattimer, J. M., et al. 2018, ArXiv e-prints. https://arxiv.org/abs/1804.08583
- Drischler et al. (2016) Drischler, C., Carbone, A., Hebeler, K., & Schwenk, A. 2016, Phys. Rev. C, 94, 054307, doi: 10.1103/PhysRevC.94.054307
- Drischler et al. (2017) Drischler, C., Hebeler, K., & Schwenk, A. 2017, ArXiv e-prints. https://arxiv.org/abs/1710.08220
- Fasano et al. (2019) Fasano, M., Abdelsalhin, T., Maselli, A., & Ferrari, V. 2019, arXiv e-prints. https://arxiv.org/abs/1902.05078
- Fattoyev et al. (2018) Fattoyev, F. J., Piekarewicz, J., & Horowitz, C. J. 2018, Physical Review Letters, 120, 172702, doi: 10.1103/PhysRevLett.120.172702
- Fraga et al. (2014) Fraga, E. S., Kurkela, A., & Vuorinen, A. 2014, Astrophys. J. Lett., 781, L25, doi: 10.1088/2041-8205/781/2/L25
- Gamba et al. (2019) Gamba, R., Read, J. S., & Wade, L. E. 2019, arXiv e-prints. https://arxiv.org/abs/1902.04616
- Gendreau et al. (2016) Gendreau, K. C., Arzoumanian, Z., Adkins, P. W., et al. 2016, in Proc. SPIE, Vol. 9905, Space Telescopes and Instrumentation 2016: Ultraviolet to Gamma Ray, 99051H, doi: 10.1117/12.2231304
- Gill et al. (2019) Gill, R., Nathanail, A., & Rezzolla, L. 2019, Astrophys. J., in press. https://arxiv.org/abs/1901.04138
- Greif et al. (2018) Greif, S. K., Raaijmakers, G., Hebeler, K., Schwenk, A., & Watts, A. L. 2018, arXiv e-prints. https://arxiv.org/abs/1812.08188
- Guillot et al. (2013) Guillot, S., Servillat, M., Webb, N. A., & Rutledge, R. E. 2013, Astrophys. J., 772, 7, doi: 10.1088/0004-637X/772/1/7
- Hebeler et al. (2013) Hebeler, K., Lattimer, J. M., Pethick, C. J., & Schwenk, A. 2013, Astrophys. J., 773, 11, doi: 10.1088/0004-637X/773/1/11
- Kiuchi et al. (2019) Kiuchi, K., Kyutoku, K., Shibata, M., & Taniguchi, K. 2019, arXiv e-prints, arXiv:1903.01466. https://arxiv.org/abs/1903.01466
- Köppel et al. (2019) Köppel, S., Bovard, L., & Rezzolla, L. 2019, Astrophys. J. Lett., 872, L16, doi: 10.3847/2041-8213/ab0210
- Kurkela et al. (2014) Kurkela, A., Fraga, E. S., Schaffner-Bielich, J., & Vuorinen, A. 2014, Astrophys. J., 789, 127, doi: 10.1088/0004-637X/789/2/127
- Kurkela et al. (2010) Kurkela, A., Romatschke, P., & Vuorinen, A. 2010, Phys. Rev. D, 81, 105021, doi: 10.1103/PhysRevD.81.105021
- Lattimer & Steiner (2014) Lattimer, J. M., & Steiner, A. W. 2014, Astrophys. J., 784, 123, doi: 10.1088/0004-637X/784/2/123
- Lim & Holt (2018) Lim, Y., & Holt, J. W. 2018, Physical Review Letters, 121, 062701, doi: 10.1103/PhysRevLett.121.062701
- Lim & Holt (2019) —. 2019, arXiv e-prints. https://arxiv.org/abs/1902.05502
- Malik et al. (2018) Malik, T., Alam, N., Fortin, M., et al. 2018, Phys. Rev. C, 98, 035804, doi: 10.1103/PhysRevC.98.035804
- Margalit & Metzger (2017) Margalit, B., & Metzger, B. D. 2017, Astrophys. J. Lett., 850, L19, doi: 10.3847/2041-8213/aa991c
- McNeil Forbes et al. (2019) McNeil Forbes, M., Bose, S., Reddy, S., et al. 2019, arXiv e-prints. https://arxiv.org/abs/1904.04233
- Miller et al. (2019) Miller, M. C., Chirenti, C., & Lamb, F. K. 2019, arXiv e-prints, arXiv:1904.08907. https://arxiv.org/abs/1904.08907
- Montana et al. (2018) Montana, G., Tolos, L., Hanauske, M., & Rezzolla, L. 2018. https://arxiv.org/abs/1811.10929
- Most et al. (2018) Most, E. R., Weih, L. R., Rezzolla, L., & Schaffner-Bielich, J. 2018, Phys. Rev. Lett., 120, 261103, doi: 10.1103/PhysRevLett.120.261103
- Özel & Freire (2016) Özel, F., & Freire, P. 2016, Annual Review of Astronomy and Astrophysics, 54, 401, doi: 10.1146/annurev-astro-081915-023322
- Özel & Psaltis (2009) Özel, F., & Psaltis, D. 2009, Phys. Rev. D, 80, 103003, doi: 10.1103/PhysRevD.80.103003
- Özel et al. (2016) Özel, F., Psaltis, D., Güver, T., et al. 2016, Astrophys. J., 820, 28, doi: 10.3847/0004-637X/820/1/28
- Paschalidis et al. (2017) Paschalidis, V., Yagi, K., Alvarez-Castillo, D., Blaschke, D. B., & Sedrakian, A. 2017, arXiv:1712.00451. https://arxiv.org/abs/1712.00451
- Radice et al. (2018) Radice, D., Perego, A., Zappa, F., & Bernuzzi, S. 2018, Astrophys. J. Lett., 852, L29, doi: 10.3847/2041-8213/aaa402
- Raithel et al. (2018) Raithel, C., Özel, F., & Psaltis, D. 2018, Astrophys. J., 857, L23, doi: 10.3847/2041-8213/aabcbf
- Raithel et al. (2017) Raithel, C. A., Özel, F., & Psaltis, D. 2017, Astrophys. J., 844, 156, doi: 10.3847/1538-4357/aa7a5a
- Read et al. (2009) Read, J. S., Lackey, B. D., Owen, B. J., & Friedman, J. L. 2009, Phys. Rev. D, 79, 124032, doi: 10.1103/PhysRevD.79.124032
- Rezzolla et al. (2018) Rezzolla, L., Most, E. R., & Weih, L. R. 2018, Astrophys. J. Lett., 852, L25, doi: 10.3847/2041-8213/aaa401
- Ruiz et al. (2018) Ruiz, M., Shapiro, S. L., & Tsokaros, A. 2018, Phys. Rev. D, 97, 021501, doi: 10.1103/PhysRevD.97.021501
- Shibata et al. (2017) Shibata, M., Fujibayashi, S., Hotokezaka, K., et al. 2017, Phys. Rev. D, 96, 123012, doi: 10.1103/PhysRevD.96.123012
- Shibata et al. (2019) Shibata, M., Zhou, E., Kiuchi, K., & Fujibayashi, S. 2019, arXiv e-prints, arXiv:1905.03656. https://arxiv.org/abs/1905.03656
- Steiner et al. (2010) Steiner, A. W., Lattimer, J. M., & Brown, E. F. 2010, Astrophys. Journ., 722, 33, doi: 10.1088/0004-637X/722/1/33
- Tews et al. (2018) Tews, I., Margueron, J., & Reddy, S. 2018, Physical Review C, 98, 045804, doi: 10.1103/PhysRevC.98.045804
- Tews et al. (2019) —. 2019, arXiv e-prints. https://arxiv.org/abs/1901.09874
- Thankful Cromartie et al. (2019) Thankful Cromartie, H., Fonseca, E., Ransom, S. M., et al. 2019, arXiv e-prints, arXiv:1904.06759. https://arxiv.org/abs/1904.06759
- The LIGO Scientific Collaboration et al. (2017) The LIGO Scientific Collaboration, the Virgo Collaboration, Abbott, B. P., et al. 2017, Astrophys. J. Lett., 848, L12. http://stacks.iop.org/2041-8205/848/i=2/a=L12
- Watts et al. (2016) Watts, A. L., Andersson, N., Chakrabarty, D., et al. 2016, Reviews of Modern Physics, 88, 021001, doi: 10.1103/RevModPhys.88.021001
- Weih et al. (2019) Weih, L. R., Most, E. R., & Rezzolla, L. 2019, Optimal neutron-star mass ranges to constrain the equation of state of nuclear matter with electromagnetic and gravitational-wave observations: Animated Fig. 1, 1.0, Zenodo, doi: 10.5281/zenodo.3363615
- Weih et al. (2019) Weih, L. R., Most, E. R., & Rezzolla, L. 2019, Optimal neutron-star mass ranges to constrain the equation of state of nuclear matter with electromagnetic and gravitational-wave observations: EOS library, 1.0, Zenodo, doi: 10.5281/zenodo.3260991