A Diffusive Shock Acceleration Model for Protons in Weak Quasi-parallel Intracluster Shocks
Abstract
Low sonic Mach number shocks form in the intracluster medium (ICM) during the formation of the large-scale structure of the universe. Nonthermal cosmic-ray (CR) protons are expected to be accelerated via diffusive shock acceleration (DSA) in those ICM shocks, although observational evidence for the -ray emission of hadronic origin from galaxy clusters has yet to be established. Considering the results obtained from recent plasma simulations, we improve the analytic test-particle DSA model for weak quasi-parallel () shocks, previously suggested by Kang & Ryu (2010). In the model CR spectrum, the transition from the postshock thermal to CR populations occurs at the injection momentum, , above which protons can undergo the full DSA process. As the shock energy is transferred to CR protons, the postshock gas temperature should decrease accordingly and the subshock strength weakens due to the dynamical feed of the CR pressure to the shock structure. This results in the reduction of the injection fraction, although the postshock CR pressure approaches an asymptotic value when the CR spectrum extends to the relativistic regime. Our new DSA model self-consistently accounts for such behaviors and adopts better estimations for . With our model DSA spectrum, the CR acceleration efficiency ranges for supercritical, -shocks with sonic Mach number in the ICM. Based on Ha et al. (2018b), on the other hand, we argue that proton acceleration would be negligible in subcritical shocks with .
1 Introduction
Hierarchical clustering of the large-scale structure of the universe induces supersonic flow motions of baryonic matter, which result in the formation of weak shocks with sonic Mach numbers in the hot intracluster medium (ICM) (e.g., Ryu et al., 2003; Vazza et al., 2009; Ha et al., 2018a). In particular, shocks associated with mergers of subcluster clumps have been observed in X-ray and radio (e.g., Brunetti & Jones, 2014; van Weeren et al., 2019). These ICM shocks are thought to accelerate cosmic ray (CR) protons and electrons via diffusive shock acceleration (DSA) (Bell, 1978; Drury, 1983). Although the acceleration of relativistic electrons can be inferred from the so-called giant radio relics (e.g., van Weeren et al., 2019), the presence of the CR protons produced by ICM shocks has yet to be established (e.g., Pfrommer & Enßlin, 2004; Pinzke & Pfrommer, 2010; Zandanel & Ando, 2014; Vazza et al., 2016; Kang & Ryu, 2018). The inelastic collisions of CR protons with thermal protons followed by the decay of produce diffuse -ray emission, which has not been detected so far (Ackermann et al., 2016). Previous studies using cosmological hydrodynamic simulations with some prescriptions for CR proton acceleration suggested that the non-detection of -ray emission from galaxy clusters would constrain the acceleration efficiency for ICM shocks with (e.g., Vazza et al., 2016); the acceleration efficiency is defined in terms of the shock kinetic energy flux, as (Ryu et al., 2003). Hereafter, the subscripts and denote the preshock and postshock states, respectively. And is the density, is the flow speed in the shock-rest frame, is the shock speed, and is the postshock CR proton energy density.
Proton injection is one of the key processes that govern the DSA acceleration efficiency. In the so-called thermal leakage model, suprathermal particles in the tail of the postshock thermal distribution were thought to re-cross the shock from downstream to upstream and participate in the Fermi I process (e.g. Malkov, 1997; Kang et al., 2002). Through hybrid simulations, however, Caprioli & Spitkovsky (2014a, CS14a, hereafter) showed that in quasi-parallel (, hereafter, with ) shocks, protons are injected through specular reflection off the shock potential barrier, gaining energy via shock drift acceleration (SDA), and that the self-excitation of upstream turbulent waves is essential for multiple cycles of reflection and SDA. Here, is the obliquity angle between the shock normal and the background magnetic field direction. They considered relatively strong () -shocks in plasmas with , where is the ratio of the gas to magnetic pressures. As CRs are accelerated to higher energies, the CR energy density increases in time before the acceleration saturates at for (see Figure 3 of CS14a) with the injection fraction, (see Equation [4] below). Here, is the energy density of postshock thermal protons. As a result, the postshock thermal distribution gradually shifts to lower temperatures as the CR power-law tail increases its extent (see Figure 1 of CS14a).
Moreover, CS14a found that in the immediate postshock region, the proton momentum distribution can be represented by three components: the Maxwellian distribution of thermal particles, , the CR power-law spectrum, , and the suprathermal ‘bridge’ connecting smoothly and (see Figure 2 of CS14a). This suprathermal bridge gradually disappears as the plasma moves further downstream away from the shock, because the electromagnetic turbulence and ensuing kinetic processes responsible for the generation of suprathermal particles decrease in the downstream region. Far downstream from the shock, the transition from the Maxwellian to CR distributions occurs rather sharply at the so-called injection momentum, which can be parameterized as , where is the postshock thermal proton momentum and is the injection parameter. Here, is the temperature of postshock thermal ions, is the proton mass, and is the Boltzmann constant. They suggested that the CR energy spectrum can be modeled by the DSA power-law attached to the postshock Maxwellian at , although their hybrid simulations revealed a picture that is quite different from the thermal leakage injection model. Later, Caprioli et al. (2015, CPS15, hereafter) presented a minimal model for proton injection that accounts for quasi-periodic shock reformation and multicycles of reflection/SDA energization, and predicted the CR spectrum consistent with the hybrid simulations of CS14a.
Recently, Ha et al. (2018b, HRKM18, hereafter) studied, through Particle-in-Cell (PIC) simulations, the early acceleration of CR protons in weak () -shocks in hot ICM plasmas where (e.g., Ryu et al., 2008). In the paper, they argued that only supercritical -shocks with develop overshoot/undershoot oscillations in their structures, resulting in a significant amount of incoming protons being reflected at the shock and injected into the DSA process. Subcritical -shocks with , on the other hand, have relatively smooth structures, and hence the preacceleration and injection of protons into DSA are negligible. Thus, it was suggested that ICM -shocks may accelerate CR protons only if . Although the simulations followed only to the very early stage of DSA where the maximum ion momentum reaches up to ( is the reduced ion mass111Throughout the paper, we differentiate from , because the effects of the reduced mass ratio, ( is the electron mass), in PIC simulations remain to be fully understood. In the simulations of HRKM18, for example, was used.), HRKM18 attempted to quantify proton acceleration at ICM -shocks. The simulated CR spectrum indicated the injection parameter of , which led to a rather high injection fraction, , for shocks with . If we simply extrapolate this injection fraction to the relativistic regime of , the ensuing DSA efficiency would be rather high, , which is in strong disagreement with the existing observations of -rays from galaxies clusters.
In a ‘fluid-version’ of numerical studies of DSA, on the other hand, the time-dependent diffusion-convection equation for the isotropic part of the momentum distribution function, , is solved, adopting a Bohm-type spatial diffusion coefficient () and a ‘macroscopic’ prescription for thermal leakage injection () (e.g., Kang et al., 2002). Previous studies using this approach managed to follow the evolution of CR proton spectrum into the relativistic energies of up to for shocks with a wide range of sonic Mach numbers (e.g., Kang & Jones, 2005). They showed that, as the CR pressure increases in time, the subshock weakens and decreases accordingly, resulting in the gradual reduction of the injection rate and [see Figure 5 of Kang & Jones (2005)]. This leads to the decrease of the injection fraction with time, although the postshock CR pressure reaches an approximate time-asymptotic value [see Figure 6 of Kang et al. (2002)]. These results are consistent with those of the hybrid simulations described above.
Previously, Kang & Ryu (2010) considered an analytic model for in the test-particle regime of DSA for weak ICM shocks. They suggested that the test-particle solution of could be valid only if , which results in the injection fraction and the CR pressure . In that study, however, the changes of and with the increase of were not included self-consistently, because , although a free parameter, has a fixed value, and was estimated simply from the Rankine-Hugoniot relation, relying on the test-particle assumption. Hence, the model failed to incorporate the full aspect of DSA observed in the previous simulations.
Based on the earlier studies of DSA using hybrid, PIC, and fluid simulations, we here propose an improved analytic model that is designed to approximately emulate the CR proton spectrum of DSA for given shock parameters. The basic formulation is still based on the test-particle solution with a thermal leakage injection recipe with a free parameter, , as in Kang & Ryu (2010). The main improvement is, however, the inclusion of the reduction of the postshock thermal energy density due to the transfer of the shock energy to the CR population in a self-consistent manner; also the model considers a more realistic range of that reflects the results of the hybrid simulations of CS14a and CPS15.
In the next section, we first review what has been learned about proton injection and acceleration at -shocks from recent plasma simulations. In Section 3, we describe our analytic DSA model for the CR proton spectrum produced at weak -shocks, along with the injection fraction and acceleration efficiency that characterize the DSA of CR protons. A brief summary follows in Section 4.
2 Implications from Plasma Simulations
Although the structure and time variation of collisionless shocks are primarily governed by the dynamics of reflected protons and the waves excited by them in the foreshock region, the roles of electron kinetic processes in proton injection to DSA has not yet been fully explored (e.g., Balogh & Truemann, 2013). Only PIC simulations can follow from first principles various microinstabilities and wave-particle interactions due to ion and electron kinetic processes. Owing to greatly disparate time and length scales of ion and electron processes, however, the runs of PIC simulations are limited to only several , depending on , , and the dimension of simulations. Here, , is the ion cyclotron period where is the speed of light, is the electron charge, and is the background magnetic field strength. Typically, the injection and early acceleration of protons can be followed up to the maximum momentum of () in PIC simulations (e.g., Park et al., 2015, HRKM18).
Hybrid simulations, in which electrons are modeled as a charge-neutralizing fluid, can be run to several (where ), neglecting details of electron kinetic processes. Yet they can follow proton acceleration only up to or so (e.g., CP14a).
With currently available computational resources, both PIC and hybrid simulations can only study the early development of suprathermal and nonthermal protons. Thus, it would be a rather challenging task to extrapolate what we have learned about DSA from existing plasma simulations to the relativistic regime of .
2.1 Hybrid Simulations
As discussed in the introduction, the injection and acceleration of protons at -shocks with were studied extensively through 2D hybrid simulations (CS14a and CPS15). A small fraction of incoming protons can be injected to DSA after undergoing two to three cycles of SDA, followed by reflection off the shock potential drop. In addition, at low- () shocks, the proton reflection can be facilitated by the magnetic mirror force due to the compression of locally perpendicular magnetic fields in upstream MHD turbulence, which are self-excited by back-streaming protons (e.g., Sundberg et al., 2016).
The efficiency of proton injection could be quantitatively different at weak ICM shocks with , because the shock potential drop is smaller at lower shocks and the magnetic mirror force is weaker in higher plasmas. Caprioli & Spitkovsky (2014b, CS14b, hereafter), on the other hand, showed that the magnetic field amplification due to resonant and non-resonant streaming instabilities increases with the Alfvén Mach number, . Hence, the level of upstream turbulence is expected to be higher for higher shocks at a given . Therefore, higher could have two opposite effects on the efficiency of proton injection, i.e., weaker magnetic mirror but stronger turbulence in the foreshock. Unfortunately, so far hybrid simulations for high- () shocks have not been published in the literature yet.
CPS15 suggested that the proton injection at weak shocks may be different from their findings for strong shocks in the following senses: (1) the overshoot in the shock potential is smaller at weaker shocks, leading to a smaller reflection fraction at each confrontation with the shock, (2) the fractional energy gain at each SDA cycle is smaller, so more SDA cycles are required for injection, (3) the levels of turbulence and magnetic field amplification are weaker. As a result, the proton injection and acceleration efficiencies should be smaller at weaker shocks. According to Figure 3 of CS14a, for the shock ( in their definition), the DSA efficiency is , so a smaller is expected for ICM shocks with .
Moreover, CS14b showed in their Figure 9 that the normalization (amplitude) of postshock decreases as increases with time. We interpret that this trend is caused by the increase in the number of SDA cycles required for injection to DSA, because the subshock weakens gradually due to the CR feedback, and so the energy gain per SDA cycle is reduced. Considering that the ratio of reaches only to in these hybrid simulations, the normalization of may continue to decrease as the CR spectrum extends to the relativistic region with .
2.2 Particle-in-cell Simulations
HRKM18 explored for the first time the criticality of high- shocks and showed that protons can be injected to DSA and accelerated to become CRs only at supercritical shocks with . Figure 7 of HRKM18 showed that the shock criticality does not sensitively depend on and numerical resolution, but the acceleration rate depends slightly on . As mentioned before, turbulence is excited more strongly for higher cases due to higher . But the reflection fraction is smaller for higher due to weaker magnetic mirror forces, leading to lower reflection fraction and lower amplitude of near .
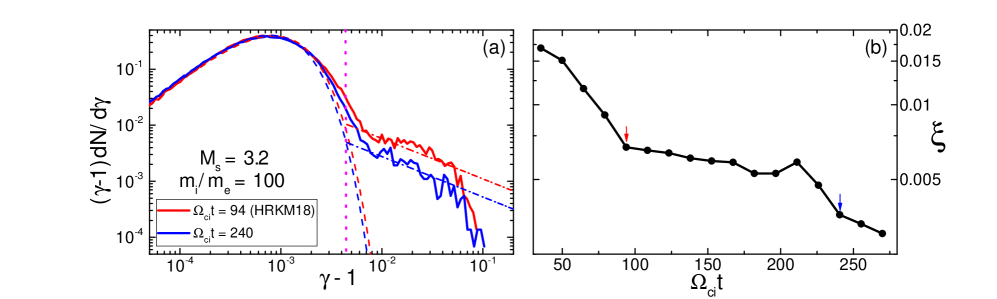
In order to get a glimpse of the long-term evolution of the CR proton spectrum, we extend the 1D PIC simulation reported in HRKM18 from to 270 for the model of , , , , and keV ( K). Details of numerical and model setups can be found in HRKM18 (see their Table 1). The main change is that a different computation domain, , is adopted here in order to accommodate the longer simulation time. Because of severe computational requirements, in practice, it is difficult to extend this kind of PIC simulations to a much larger box for a much longer duration. In this simulation the average velocity of ions is times higher than that of real protons for the given temperature.
Figure 1 shows the time evolution of the postshock energy spectra of ions, (where is the Lorentz factor), and the injection fraction, [see Eq. (11) of HRKM18]. We adopt the simulation data of HRKM18 for (red), while the data from the new extended simulation is used for (blue). The region of behind the shock is included, where is the ion Larmor radius defined with the incoming flow speed. Note that the spectrum near the energy cutoff might not be correctly reproduced due to the limited size of the simulation domain.
We notice the following features in Figure 1(a) : (1) the postshock temperature decreases slightly with time, (2) the injection parameter, , increases from to as the time increases from to 240, and (3) the amplitude of decreases gradually.
Figure 1(b) shows the resulting gradual decrease of , which may continue further in time. As in HRKM18, a somewhat arbitrary value of is adopted (see the next section for a further discussion). We interpret the bump in the evolution of near as a consequence of shock reformation.
3 Analytic Model for CR Proton Spectrum
The analytic model presented here inherits the test-particle DSA model with a thermal leakage injection recipe, which was suggested by Kang & Ryu (2010). It describes the downstream CR proton spectrum, , for weak shocks. For the preshock gas with the density, , and the temperature, , the postshock vales, , and 222Here, denotes the temperature of the thermal gas when the postshock CR energy density, , is negligible, reserving for the cases of non-negligible ., can be calculated from the Rankine–Hugoniot jump condition. For example, the shock compression ratio is given as , where is the gas adiabatic index.
Following Kang & Ryu (2010), we parameterize the model as follows: (1) The CR proton spectrum follows the test-particle DSA power-law, as , where . (2) The transition from the postshock thermal to CR spectra occurs at the injection momentum
| (1) |
where is the injection parameter. The main improvement here is that the postshock temperature, , decreases slightly from , and hence does too, as the fraction of the shock energy transferred to CRs increases.
Our model leads to the following form of the CR proton spectrum,
| (2) |
Here, the maximum momentum of CR protons, , increases with the shock age (e.g., Kang & Ryu, 2010). The normalization factor can be approximated as
| (3) |
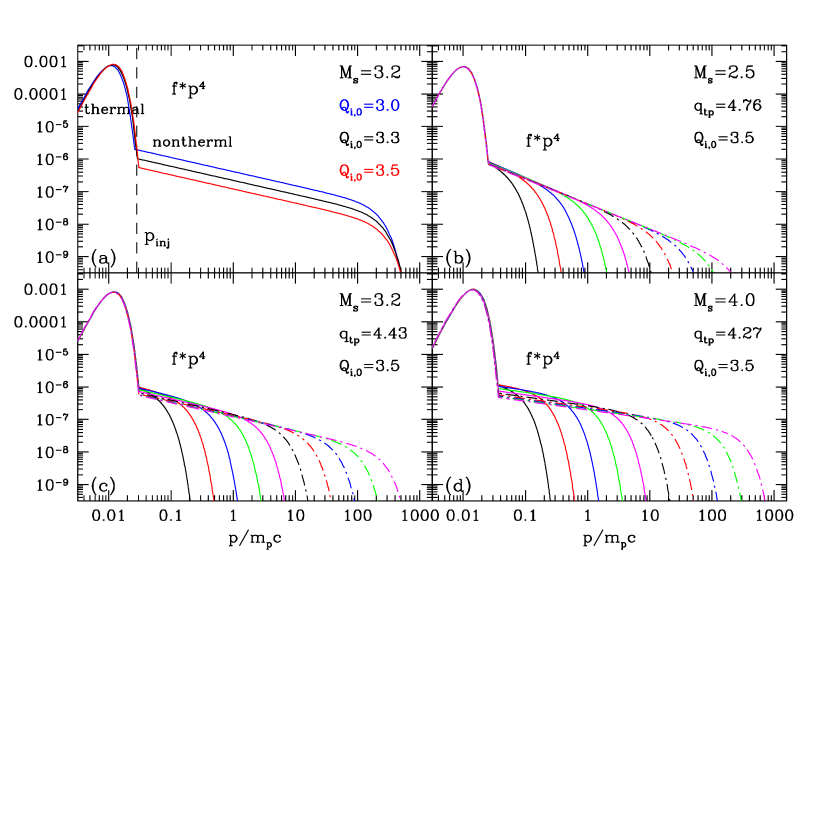
assuming the CR power-law spectrum is hinged to the postshock Maxwell distribution at . Therefore, in our model, is the key parameter that controls . In addition, we introduce an additional parameter, , to accommodate any uncertainties in determining the value of and the resulting amplitude, . Throughout this paper, however, is used. Figure 2(a) shows the model spectrum, , calculated with Equations (2)-(3), which illustrates the transition from the thermal to nonthermal CR spectra at .
The PIC simulation described in section 2.2 indicates when , but may further increase for , as noted above. On the other hand, hybrid simulations for strong shocks of (CS14a, CPS15) showed that it is expected to range as . As discussed in section 2.1, higher could have two opposite effects on proton reflection, weaker magnetic mirror but stronger upstream turbulence. So it is difficult to make quantitative predictions on the long-term evolution of in high- shocks without performing plasma simulations of very long duration. Here, we will consider the range of as an educated guess from the previous plasma simulation. Moreover, in our analytic model, would give the DSA efficiency of for (see Figure 4 below), which would be incompatible with the non-detection of -ray emission from galaxy clusters (Vazza et al., 2016).
From the model in Equation (2), we calculate the injection fraction of CR protons by
| (4) |
as in HRKM18. The postshock CR energy density is estimated by
| (5) |
In the case of very weak shocks, where the CR spectrum is dominated by low energy particles, both and depend sensitively on the lower bound of the integrals, (e.g., Pfrommer & Enßlin, 2004). We here adopt for fiducial models, while , the threshold energy of -production reaction, will be considered as well for comparison.
As mentioned above, may increase, as extends to higher , resulting in the decrease of the postshock gas temperature from to (see Figure 5 of Kang & Jones (2005) and Figure 1 of CS14a). Thus, we introduce the temperature reduction factor,
| (6) |
Then, is the reduced postshock temperature.333The fraction of thermal particles that becomes CR protons is assumed to be small, i.e., .
CPS15 suggested that when the postshock CR energy density approaches to , the subshock weakens substantially, which suppresses the proton reflection and injection. Hence, the normalization of is expected to decrease as increases. Our model is designed to mimic such a behavior by finding the self-consistent postshock thermal distribution with a lower temperature, while is assumed to be fixed. Then, the injection parameter increases as , where is the initial value, leading to smaller values of . Note that at shocks with different parameters (, , and ) is controlled by a number of complex kinetic process, and hence should be studied through long-term plasma simulations, beyond the current computational capacity. Considering that the proton injection into DSA is yet to be fully understood, fixing while slightly increasing in our model should be regarded as a reasonable assumption.
Figure 2(a) shows the model spectrum, including that of the self-consistent thermal distribution, in a shock for ; the spectrum depends on the adopted value of . Panels (b)-(d) illustrate the change of the model spectrum as increases in shocks with 3.2, and 4.0, respectively. As and also increase, the Maxwellian part shifts to slightly lower , and decreases accordingly. Because is assumed to be fixed, increases and thus the normalization factor decreases in our model.
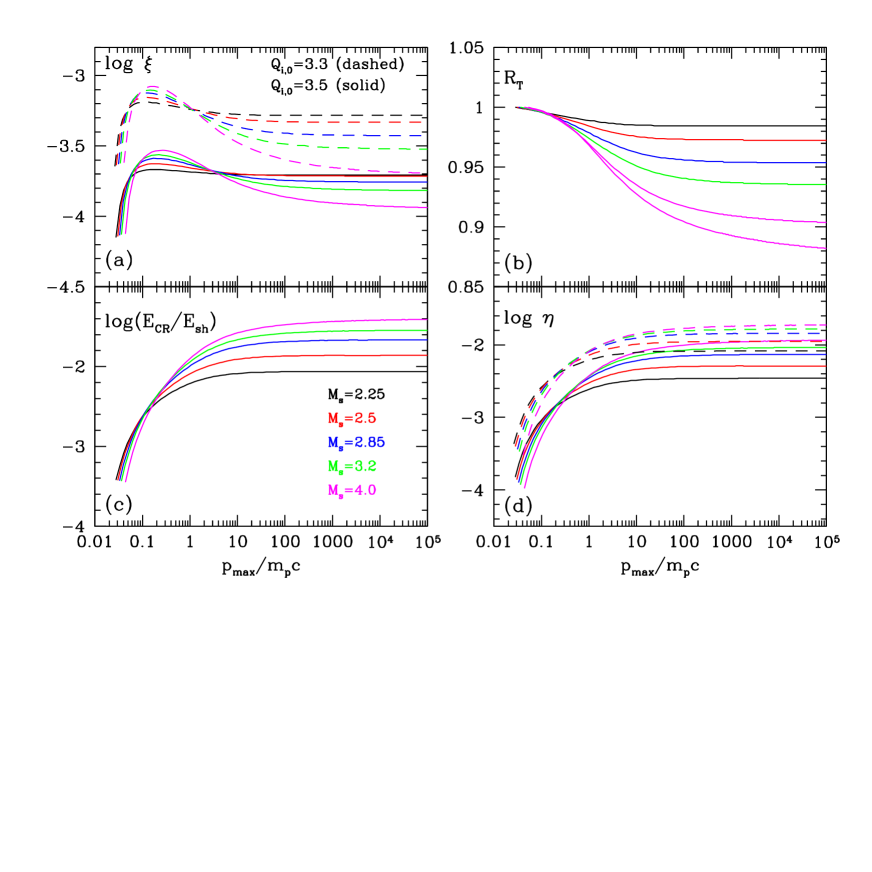
Figure 3 shows the change of , , , and , calculated with Equations (2)-(6), as increases for (dashed lines) and 3.5 (solid lines) in shocks with . The CR acceleration efficiency is related to the postshock CR energy density, as . Figure 3(b) plots how decreases, as increases. The injection fraction, , increases with increasing during the early acceleration phase, but decreases for . The latter behavior results from the gradual reduction of , which is caused by the self-adjustment of the shock structure, that is, the cooling of the postshock thermal protons, the growing of the precursor, and the weakening of the subshock due to the dynamical feedback of the CR pressure. and , on the other hand, monotonically increase and approach to asymptotic values for .
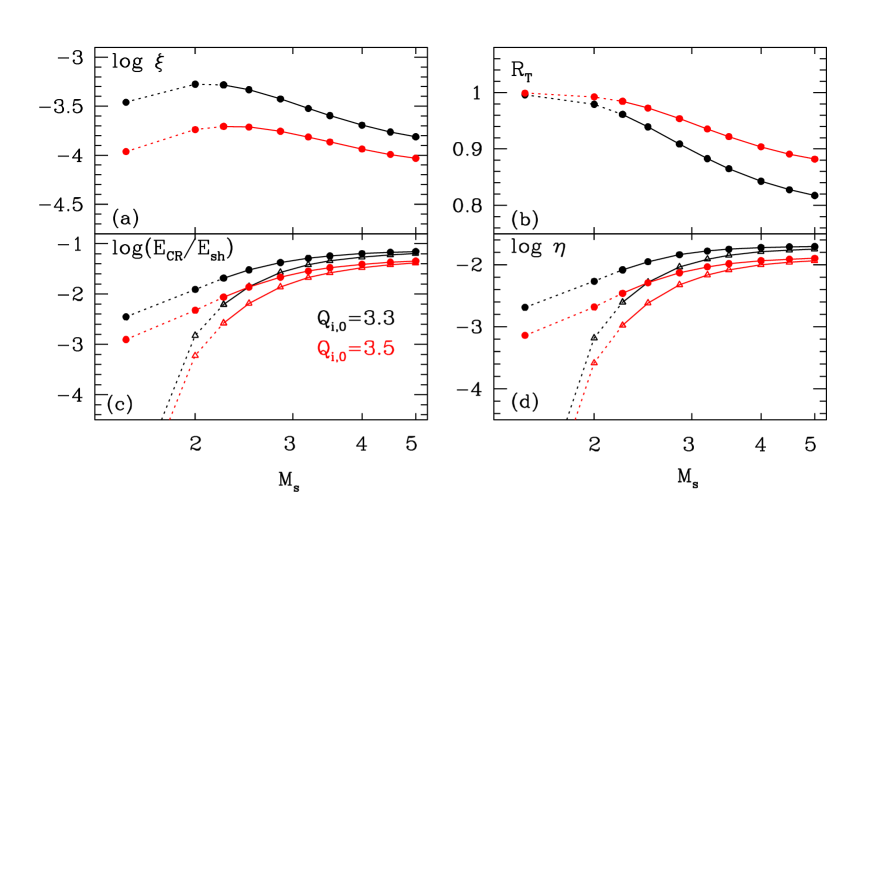
Figure 4 shows the asymptotic values of those quantities as a function of (filled circles and lines) for (black) and 3.5 (red), which would cover the most realistic range for ICM shocks (CS14a). As mentioned in the introduction, HRKM18 showed that ICM -shocks with may not inject protons into the DSA process, resulting in inefficient CR proton acceleration. We here include the and cases (connected with dotted lines) for illustrative purposes, showing the values estimated with our model.
Note that the asymptotic value of decreases with increasing for supercritical shocks with . This behavior is opposite to the relation, , during the very early acceleration stage of the PIC simulations reported in HRKM18. In those PIC simulations, , so the CR feedback effect is not very significant. However, our analytic model is designed to take account for the dynamic feedback of the CR pressure to the shock structure when , so could be smaller at higher .
With the adopted value of , , so the test-particle assumption should be valid. The acceleration efficiency increases with and is close to in the range of . Obviously, if the injection parameter is larger than what the hybrid simulations of CS14a indicated, that is, , then DSA would be even less efficient.
In the studies of -ray emission from simulated galaxy clusters, the lower bound of is often taken as , as noted above. The open triangles in Figure 4 show and calculated with this , otherwise adopting the same analytic spectrum given in Equations (2)-(3). For , the acceleration efficiency with is smaller by a factor of 3.3 than that with . But the two estimations are similar for . The efficiency with is in the range of , while for . If this result is extended to the case of , would be still close to 0.01, which is about three times smaller than the efficiency reported by CS14a (i.e., at ). Note that this estimate is somewhat larger than the upper limit of , quoted to be consistent with the non-detection of -ray emission from galaxy clusters by Vazza et al. (2016). On the other hand, as HRKM18 shown, may be very small and negligible for shocks with , for which the fraction of the total shock dissipation in the ICM was shown to be substantial (e.g., Ryu et al., 2003). Hence, the consistency of our model for proton acceleration with the non-detection of cluster -rays should be further examined by considering the details of the characteristics of shocks in simulated galaxy clusters.
4 Summary
The DSA efficiency for CR protons at low -shocks in the high- plasmas of the ICM has yet to be investigated through kinetic plasma simulations. HRKM18 studied the injection and the early acceleration of protons up to at such shocks through 1D PIC simulations, adopting reduced mass ratios of . On the other hand, CS14a, CS14b, and CPS15 carried out hybrid simulations to study the DSA of protons, but considered only high shocks in plasmas. Here, we revisited the test-particle DSA model for low shocks with a thermal leakage injection recipe that was previously presented in Kang & Ryu (2010). Reflecting new findings of recent plasma simulations, we improved the analytic DSA model by accounting for the transfer of the postshock thermal energy to the CR energy and the weakening of the subshock due to the dynamical feedback of the CR pressure to the shock structure.
We first set up an approximate analytic solution, , for CR protons in weak -shocks. We then calculated the injection fraction, , the postshock CR energy fraction, , and the acceleration efficiency, , of CR protons. The main aspects of our model and the main results are summarized as follows.
1. In weak shocks with , above the injection momentum, , follows the test-particle DSA power-law, whose slope is determined by the shock compression ratio.
2. According to plasma simulations such as CS14a, CPS15, and HRKM18, as CR protons are accelerated to higher energies, the postshock gas temperature and the normalization of decreases (see Figure 2). Thus, in our model, while the injection momentum, , is assumed to be fixed, the injection parameter increases as , where is the reduction factor of the postshock temperature. Then determines the CR spectrum according to Equations (2)-(6). We adopt , extrapolating the results of previous hybrid simulations.
3. In our model, as extends to higher , first increases and then decreases due to the reduction of and the increase of , although monotonically increases and approaches a time-asymptotic value. Such a behavior was previously seen in fluid DSA simulations (e.g., Kang et al., 2002).
4. Both and depend on and also the lower bound of the integrals, , especially in the case of very weak shocks (see Figure 4). For and , the CR acceleration efficiency ranges as for . If is adopted, it decreases to for the same Mach number range. If is adopted, becomes larger by a factor of , compared to the case with .
5. In subcritical shocks with , protons may not be efficiently injected into DSA, so we expect that would be negligible at these very weak shocks (HRKM18).
In a parallel paper (Ha et al., 2019), we will investigate the -ray emission as well as the neutrino emission from simulated galaxy clusters due to the inelastic collisions of CR protons and ICM thermal protons, based on the analytic CR proton spectrum proposed in this paper. In particular, we will check whether the prediction for -ray emission complies with the upper limits imposed by Fermi LAT observations.
References
- Ackermann et al. (2016) Ackermann, M., Ajello, M., Allafort, A., et al. 2016, ApJ, 819, 149
- Balogh & Truemann (2013) Balogh, A. & Truemann, R. A., 2013, Physics of Collisionless Shocks: Space Plasma Shock Waves, ISSI Scientific Report 12 (New York: Springer)
- Brunetti & Jones (2014) Brunetti, G. & Jones, T. W. 2014, IJMPD, 23, 30007
- Bell (1978) Bell, A. R. 1978, MNRAS, 182, 147
- Caprioli et al. (2015) Caprioli, D., Pop, A., & Spitkovsky, A. 2015, ApJ, 798, L28 (CPS15)
- Caprioli & Spitkovsky (2014a) Caprioli, D. & Spitkovsky, A. 2014a, ApJ, 783, 91 (CS14a)
- Caprioli & Spitkovsky (2014b) Caprioli, D. & Spitkovsky, A. 2014b, ApJ, 794, 46 (CS14b)
- Drury (1983) Drury, L. O’C. 1983, RPPh, 46, 973
- Ha et al. (2018a) Ha, J.-H., Ryu, D., & Kang, H. 2018a, ApJ, 857, 26
- Ha et al. (2019) Ha, J.-H., Ryu, D., & Kang, H. 2019, in preparation
- Ha et al. (2018b) Ha, J.-H., Ryu, D., Kang, H., & van Marle, A. J. 2018b, ApJ, 864, 105 (HRKM18)
- Kang & Jones (2005) Kang, H., Jones, T. W. 2005, ApJ, 620, 44
- Kang et al. (2002) Kang, H., Jones, T. W., & Gieseler, U. D. J. 2002, ApJ, 579, 337
- Kang & Ryu (2010) Kang, H. & Ryu, D. 2010, ApJ, 721, 886
- Kang & Ryu (2018) Kang, H. & Ryu, D. 2018, ApJ, 856, 33
- Malkov (1997) Malkov, M. A. 1997, ApJ, 485, 638
- Markevitch & Vikhlinin (2007) Markevitch, M. & Vikhlinin, A. 2007, Phys. Rep., 443, 1
- Park et al. (2015) Park, J., Caprioli, D., & Spitkovsky, A. 2015, Phys. Rev. Lett., 114, 085003
- Pinzke & Pfrommer (2010) Pinzke, A. & Pfrommer, C. 2010, MNRAS, 409, 449
- Pfrommer & Enßlin (2004) Pfrommer, C. & Enßlin, T. A. 2004, A&A, 413,17
- Ryu et al. (2008) Ryu, D., Kang, H., Cho, J., & Das, S. 2008, Science, 320, 909
- Ryu et al. (2003) Ryu, D., Kang, H., Hallman, E., & Jones, T. W. 2003, ApJ, 593, 599
- Sundberg et al. (2016) Sundberg, T., Haynes, C. T., Burgess, D., & Mazelle, C. X. 2016, ApJ, 820, 21
- van Weeren et al. (2019) van Weeren, R. J., de Gasperin, F., Akamatsu, H., et al. 2019, SSRv, 215, 16
- Vazza et al. (2009) Vazza, F., Brunetti, G., & Gheller, C. 2009, MNRAS, 395, 1333
- Vazza et al. (2016) Vazza, F., Brüggen, M., Wittor, D., et al. 2016, MNRAS, 459, 70
- Zandanel & Ando (2014) Zandanel, F. & Ando, S. 2014, MNRAS, 440, 663