Hot Dust-Obscured Galaxies with Excess Blue Light
Abstract
Hot Dust-Obscured Galaxies (Hot DOGs) are among the most luminous galaxies in the Universe. Powered by highly obscured, possibly Compton-thick, active galactic nuclei (AGNs), Hot DOGs are characterized by SEDs that are very red in the mid-IR yet dominated by the host galaxy stellar emission in the UV and optical. An earlier study identified a sub-sample of Hot DOGs with significantly enhanced UV emission. One target, W0204–0506, was studied in detail and, based on Chandra observations, it was concluded that the enhanced emission was most likely due to either extreme unobscured star-formation () or to light from the highly obscured AGN scattered by gas or dust into our line of sight. Here, we present a follow-up study of W0204–0506 as well as two more Hot DOGs with excess UV emission. For the two new objects we obtained Chandra/ACIS-S observations, and for all three targets we obtained HST/WFC3 F555W and F160W imaging. The analysis of these observations, combined with multi-wavelength photometry and UV/optical spectroscopy suggest that UV emission is most likely dominated by light from the central highly obscured, hyper-luminous AGN that has been scattered into our line of sight, by either gas or dust. We cannot decisively rule out, however, that star-formation or a second AGN in the system may significantly contribute to the UV excess of these targets.
1 Introduction
Hot Dust-Obscured Galaxies (Hot DOGs; Eisenhardt et al., 2012; Wu et al., 2012) are some of the most luminous galaxies in the Universe, with bolometric luminosities and a significant fraction with (Wu et al., 2012; Tsai et al., 2015). Discovered by the Wide-field Infrared Survey Explorer (WISE; Wright et al., 2010), Hot DOGs are characterized by very red mid-IR colors and spectral energy distributions (SEDs) that peak at rest-frame . This implies that Hot DOGs are powered by highly obscured, hyper-luminous AGN that dominate the SED from the mid- to the far-IR (Eisenhardt et al., 2012; Wu et al., 2012, 2014; Fan et al., 2016a; Díaz-Santos et al., 2016; Tsai et al., 2018). As expected from their luminosities, Hot DOGs are rare, with one object every 314 deg2. Yet their number density is comparable to that of similarly luminous unobscured quasars (Assef et al., 2015) and of heavily reddened type 1 quasars (Banerji et al., 2015).
X-ray studies have shown that the obscuration of the central engine in Hot DOGs is very high, with column densities ranging from somewhat below to above the Compton-thick limit (i.e., Stern et al., 2014; Piconcelli et al., 2015; Assef et al., 2016; Ricci et al., 2017; Vito et al., 2018). As the AGN emission is highly obscured, the host galaxy is observable at rest-frame UV, optical and near-IR wavelengths. A study of their SEDs by Assef et al. (2015) showed that their stellar masses, as derived from their rest-frame near-IR luminosities, imply that either the super-massive black holes (SMBHs) are accreting well above the Eddington limit, or that their SMBH masses () are well above the local relations between and the mass of the spheroidal component of the host galaxy (see, e.g., Magorrian et al., 1998; Bennert et al., 2011). Indeed, recent results by Wu et al. (2018) and Tsai et al. (2018) suggest that Hot DOGs are radiating at or above the Eddington limit, which in turn suggests that Hot DOGs are likely experiencing strong AGN feedback that could easily affect the whole host galaxy and its immediate environment. Indeed, Díaz-Santos et al. (2016) presented a study of the [C ii] 157.7m emission line in the highest luminosity Hot DOG, and possibly the most luminous galaxy known, WISEA J224607.56–052634.9 (W2246–0526; Tsai et al., 2015), and determined based on the emission-line kinematics that the central gas of the host galaxy is likely undergoing an isotropic outflow event. Further ionized gas outflow signatures have been observed in the optical narrow emission lines of some other Hot DOGs (Wu et al., 2018; Jun et al., 2020), supporting the presence of strong AGN feedback in the ISM of these targets.
Assef et al. (2015, also see ) showed that the UV through mid-IR SED of the majority of Hot DOGs (specifically “W12–drops” with ) can be well modeled as a combination of a star-forming galaxy that dominates the optical/UV emission, and a luminous, obscured AGN that dominates the mid-IR SED and the bolometric luminosity of the system. However, this is not the case for all Hot DOGs. In a later work, Assef et al. (2016, A16 hereafter) presented a small sample of eight Hot DOGs whose optical/UV emission is not well modeled by a star-forming galaxy, but instead needs a second, unobscured AGN component that is only 1% as luminous as the obscured component. A16 posited that the SED could be explained by three different scenarios: i) that the UV/optical emission is dominated by leaked or scattered light from the hyper-luminous, highly obscured AGN; ii) that the system is a dual quasar, with a more luminous, highly obscured quasar and a less luminous, unobscured one; and iii) that the system is undergoing an extreme star-formation event with little dust obscuration such that the broad-band UV/optical SED is similar to that of an AGN.
One of these objects, WISEA J020446.13–050640.8 (W0204–0506 hereafter), was serendipitously observed by the Chandra X-ray Observatory as part of the Large-Area Lyman Alpha survey (LALA; Rhodes et al., 2000). A16 studied this object in detail using these observations along with broad-band SED and optical spectroscopic observations. A16 determined that the X-ray spectrum of W0204–0506 is consistent with a single, hyper-luminous, highly absorbed AGN ( ), and highly inconsistent with a secondary, unobscured AGN with the luminosity necessary to explain the optical/UV emission. Instead, A16 found that the UV/optical continuum was better explained by a starburst with a star-formation rate , or by scattered light from the hyper-luminous, highly obscured central engine. While star-formation rates (SFRs) are routinely found through far-IR/sub-mm observations of highly obscured systems such as SMGs and ULIRGs, rates above have never been observed through UV/optical wavelengths in Lyman break galaxies, which have the strongest UV/optical star-formations measured (Barger et al., 2014). Due to the large SFR needed to explain the optical/UV SED of this object as a starburst, A16 favored the scattered AGN-light scenario.
In this paper we present Hubble Space Telescope (HST) observations of W0204–0506 to further explore its nature, and we explore in detail two more Blue-Excess Hot DOGs (BHDs), WISE J022052.12+013711.6 (W0220+0137 hereafter) and WISE J011601.41-050504.0 (W0116–0505 hereafter), using HST and Chandra observations as well as optical spectroscopy and broad-band UV through mid-IR SEDs. In §2 we present the sample studied here as well as the different observations available for each target, and describe the SED modeling done by A16 to identify these unusual objects. In §3 we discuss the modeling of the Chandra X-ray observations. In §4 we present a detailed discussion of the source of the excess blue emission, analyzing each possible scenario in light of the available observations. Our conclusions are summarized in §5. Throughout the article all magnitudes are presented in their natural system unless otherwise stated, namely AB for and Vega for all the rest. We assume a concordance flat CDM cosmology with , and . For all quantities derived from X-ray spectra, we quote 90% confidence interval, while for all other quantities we quote 68.3% confidence intervals instead.
2 Sample and Observations
2.1 Blue-Excess Hot DOGs
A16 identified 8 BHDs from a sample of 36 Hot DOGs with W47.2 mag, spectroscopic redshifts and ugriz modelMag111http://www.sdss.org/dr12/algorithms/magnitudes/#mag_model photometry in the SDSS DR12 database with in at least one of the SDSS bands. This spectroscopic sample is biased towards optical emission, and after considering the selection effects, A16 estimated BHDs could comprise as much as 8% of the Hot DOG population with W47.2 mag, although most likely a smaller fraction when considering fainter W4 fluxes.
To select this sample, A16 started by modeling the SEDs of the aforementioned 36 Hot DOGs using the galaxy and AGN SED templates and modeling algorithm of Assef et al. (2010), following the prescription presented by Assef et al. (2015). In short, the broad-band SED of any given object was modeled as a linear, non-negative combination of four empirically derived SED templates: an “E” template, which resembles the SED of an old stellar population, an “Sbc” template, which resembles the SED of an intermediately star-forming galaxy, an “Im” template, which resembles a local starburst galaxy, and a type 1 AGN template. The reddening of the AGN template, parametrized by , was also fit for, assuming and a reddening law that follows that of the SMC at short wavelengths but that of the Milky Way at longer wavelengths. A single IGM absorption strength was also fit for all templates when needed (see Assef et al., 2010, 2015, A16 for details). Using this approach A16 modeled the SED of each object in the following broad bands: the ugriz SDSS DR12 modelMag photometry, Spitzer/IRAC [3.6] and [4.5] photometry from Griffith et al. (2012), and the WISE W3 and W4 photometry from the WISE All-Sky Data Release (Cutri et al., 2012). Additionally, whenever possible, A16 used the J, Ks and deeper -band imaging presented by Assef et al. (2015). For the three sources considered in this article, the deeper -band imaging was obtained using the 4.1m Southern Astrophysical Research Telescope (SOAR) with the SOAR Optical Imager (SOI). For W0116–0505, images were obtained with an exposure time of 3600 s on the night of UT 2013 August 28. For the other two sources, the images were obtained on UT 2011 November 20, with exposure times of 3500 s for W0204–0506 and of 2500 s for W0220+0137. In all cases the images were reduced following standard procedures, and the photometric calibration was performed by comparing bright stars in each field with their respective SDSS magnitudes. The details of the NIR imaging can be found in Assef et al. (2015). All magnitudes are shown in Table 1.
| WISE ID | J011601.41–050504.0 | J020446.13–050640.8 | J022052.12+013711.6 |
|---|---|---|---|
| SDSS | 23.5710.685 | 23.0040.600 | 23.4700.587 |
| SDSS | 21.4640.054 | 22.6600.166 | 21.7790.059 |
| F555W | 21.6790.019 | 22.4410.047 | 21.7720.018 |
| SDSS | 21.3830.054 | 22.4880.234 | 21.8410.086 |
| SOI | 21.5150.078 | 22.3570.166 | 21.8030.047 |
| SDSS | 21.7400.094 | 21.7970.175 | 22.0600.132 |
| SDSS | 21.3680.257 | 22.0260.667 | 21.6070.273 |
| 20.7680.216 | 20.7900.149 | ||
| F160W | 20.6480.007 | 20.3900.007 | 21.0770.010 |
| 18.6040.117 | |||
| W1 | 17.1300.184 | 17.3430.115 | 17.8750.225 |
| 3.6 | 16.8000.040 | 17.1820.056 | 17.7220.091 |
| 4.5 | 15.7250.021 | 16.3400.033 | 16.8060.051 |
| W2 | 15.5640.156 | 16.1030.158 | 16.5750.253 |
| W3 | 10.2130.059 | 10.2450.056 | 10.5120.075 |
| W4 | 7.0140.084 | 7.0620.090 | 7.0760.092 |
A16 found that the approach described above was not able to accurately model the UV/optical emission for a fraction of their sample, which were significantly bluer than allowed by the SED templates. They identified eight objects for which an additional, secondary AGN component with independent normalization and reddening provided a significant improvement in to the best-fit SED model. A16 presented a detailed study of the properties of one of these targets: W0204–0506. Here we study an additional one of these eight targets, W0220+0137, as well as another very similar target, W0116–0505. The W117.130.18 mag of W0116–0505 is slightly brighter than the formal Hot DOG selection limit (W117.4; Eisenhardt et al., 2012) and hence it was excluded from the final list presented by A16 despite meeting all other selection criteria. We find there is only a 2.7% probability that the improvement in by the secondary AGN component is spurious for this source. A16 argued that these probabilities are likely overestimated and hence conservative, as the F-test used to estimate them does not take into account the constraints provided by the non-negative requirement of the linear combination of templates for the best-fit model.
The broad band SEDs as well as best-fit SED models of the three targets are shown in Figure 1. We note that the SED of W0204–0506 differs slightly from that presented by A16 as, for consistency with the other two sources, the SED presented here only uses the SDSS DR12 bands in the UV/optical instead of the deeper imaging of Finkelstein et al. (2007). Table 2 shows, for each target, the best-fit to both the primary and secondary AGN components and Figure 1 shows the best-fit SED models. The table also shows the reddening-corrected monochromatic luminosities at 6m, , calculated from the template fit to each AGN component. The uncertainties for the parameters shown in Table 2 have been estimated using a Monte-Carlo method following a similar prescription to that used by A16. For each object we first apply a scaling factor to the photometric uncertainties such that the best-fit SED model has a reduced () of 1. We then create 1,000 realizations of the observed SED of each object by re-sampling its photometry according to these scaled uncertainties and assuming a Gaussian distribution. We fit each of the 1,000 simulated SEDs and compile the distribution of each parameter. We assign the uncertainties to the 68.3% intervals of these distributions around the values of the best-fit model.
| Primary AGN | Secondary AGN | ||||||||
|---|---|---|---|---|---|---|---|---|---|
| Object | Redshift | ||||||||
| () | (mag) | () | (mag) | () | |||||
| W01160505 | 3.173 | 47.24 | 4.24 | 45.18 | 0.00 | 2.7 | |||
| W02040506 | 2.100 | 46.87 | 10.00 | 44.98 | 0.10 | 4.5 | |||
| W02200137 | 3.122 | 47.33 | 7.33 | 44.96 | 0.00 | 0.2 | |||
Note. — The uncertainties have been derived through a Monte Carlo process, as described in the text, and hence do not capture the possible systematic uncertainties described at the end of §2.1.
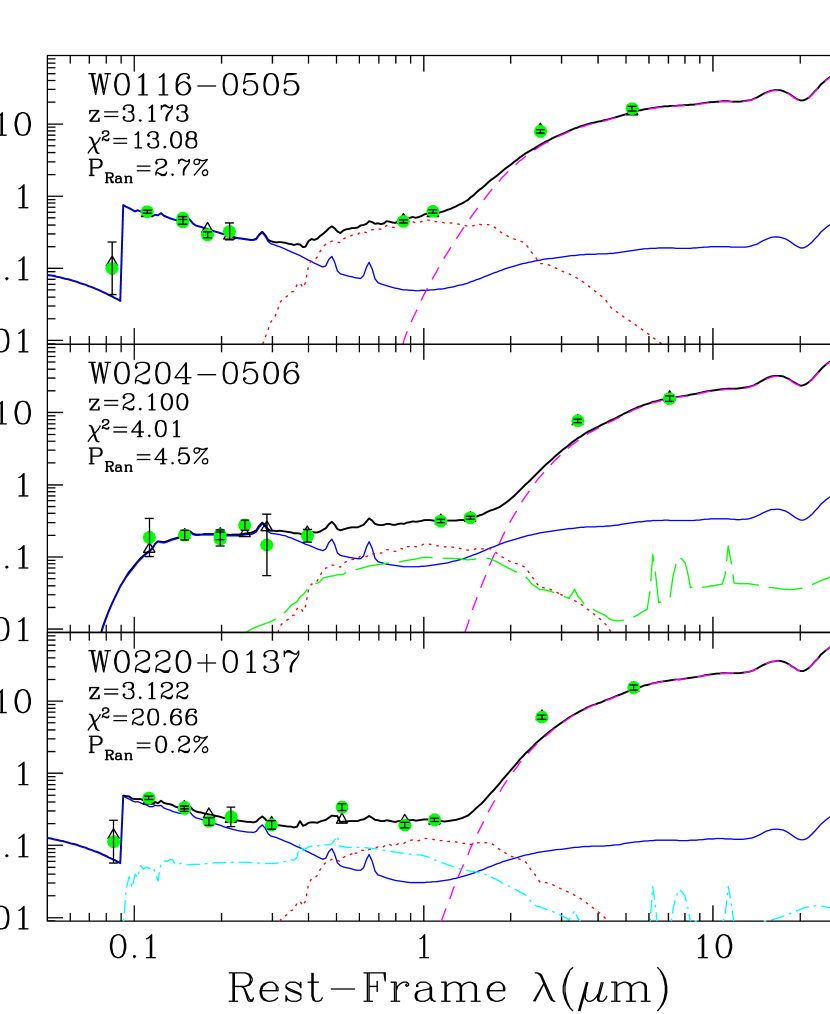
As the set of templates used is limited, we warn the reader that we may have neglected significant systematic uncertainties. For example, Figure 1 shows that the best-fit SED models have significant contribution from the old stellar population template, which could be at odds with the young age of the Universe at the redshift of these objects. However, it should be noted that since in the Assef et al. (2010) algorithm SEDs are modeled by linear combinations of three empirical templates, stellar population ages should not be associated to any specific template, but rather to the combination of them. Furthermore, the host emission is only being constrained by the rest-frame NIR and hence is insensitive to star-formation history of the underlying stellar population. This will naturally lead to a significant degeneracy in the host galaxy SED modeling. As a test, we re-fit the SEDs without allowing old stellar populations. The best-fit parameters listed in Table 2 are all within the estimated uncertainties, and the values all become somewhat smaller (by factors of 3), indicating that our results are qualitatively unaffected. Similarly, systematics in determining the AGN luminosities may also have been neglected. A detailed analysis of the dust emission SED of Hot DOGs, including data from Herschel, will be presented elsewhere and will elucidate this issue further (Tsai et al., in prep.).
2.2 Optical Spectra
The optical spectra of W0116–0505, W0204–0506 and W0220+0137 are presented in Figures 2, 3 and 4, respectively. For W0116–0505 and W0220+0137, the spectra were obtained from SDSS. The optical spectrum of W0204–0506 was obtained using the GMOS-S spectrograph on the Gemini South telescope on UT 2011 November 27 using a longslit with a width of 1.5″ as well. These observations have been previously presented by A16, and we refer the reader to that study for further details on these observations. The spectra of W01160505 and W0220+0137 show broad high ionization emission lines typically observed in luminous quasars. W0204–0506, on the other hand, has a spectrum more similar to obscured, or type 2, quasars such as high-redshift radio galaxies (e.g., Stern et al., 1999; De Breuck et al., 2001) and other radio-quiet (or non-radio-selected) quasars at high redshift (e.g., Stern et al., 2002; Hainline et al., 2012; Alexandroff et al., 2013). Single Gaussian fits to the C iv emission line, following the prescription of Assef et al. (2011, and references therein) to fit the continuum and define the spectral region on which to fit the emission line, have FWHM of approximately 2800 and 3500 respectively for W0116–0505 and W0220+0137. Based on these emission lines we measure a redshift of for W0116–0505, and for W0220+0137. In particular both spectra show blended Ly and O vi emission features. W0204–0506 is at a significantly lower redshift of , and hence we cannot determine if these emission lines are present in the spectrum, as they fall shortwards of the atmospheric UV cut-off.


2.3 HST Observations
A joint program between Chandra and HST was approved during Chandra Cycle 17 (PID 17700696) to obtain HST imaging in two bands of all three targets and obtain Chandra/ACIS-S observations of W0116–0505 and W0220+0137. These targets were selected for having some of the clearest blue excess emission in terms of the improvement, and for having some of the highest expected count rates in ACIS-S. The archival Chandra/ACIS-I observations for W0204–0506 presented by A16 are sufficient to accomplish our science goals, so no further observations were requested. In this section we focus on the HST observations, while the Chandra observations are described in the next section.
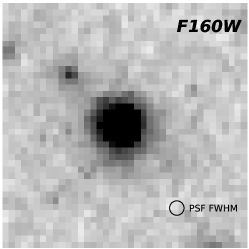
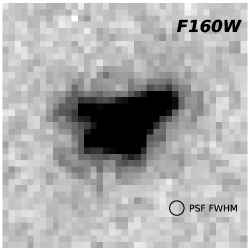
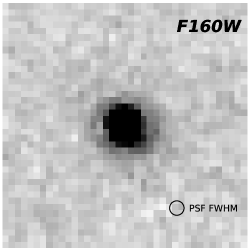
Imaging observations were obtained using the WFC3 camera onboard HST of all three BHD targets in both the F555W and the F160W bands. Each target was observed during one orbit, with two exposures in the F555W band followed by three exposures in the F160W band. The exposure times in the F555W band were 738 s and 626 s for each image for W0116–0505 and W0204–0506, and 735 s and 625 s each for W0220+0137. All exposure times in the F160W band were 353 s. For the F160W band we use the reduced images provided by the HST archive. Cutouts of 5″5″ centered on the F160W coordinates of the target, are shown in the middle panels of Figure 5.
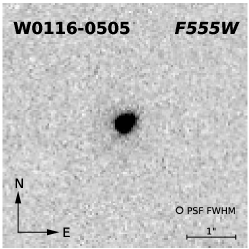
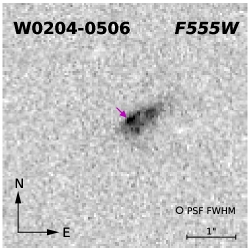

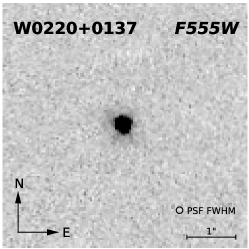
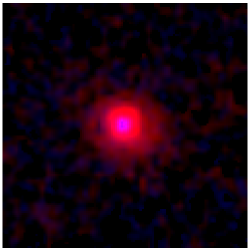
For the F555W band we do not use the archive provided reductions, as the pipeline cosmic ray rejection is significantly compromised by the acquisition of only two images. Instead, we took the fully-reduced single frames provided by the archive, including the charge transfer efficiency correction, and used the LACOSMIC algorithm (van Dokkum, 2001) to remove cosmic rays. We then used those cosmic-ray corrected images to continue with the pipeline processing and combine the frames. We aligned the F555W image to the F160W image using stars detected in both bands. The final images are shown in the left panels of Figure 5. Table 1 presents the 4″ diameter aperture magnitudes measured in each band for each object.
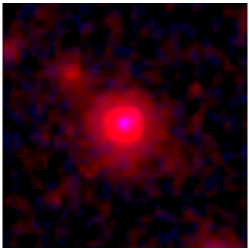
The right panel of Figure 5 show an RGB composite of the images
created using the Lupton et al. (2004) algorithm as implemented through
the astropy v2.0.1222http://www.astropy.org/
function make_lupton_rgb. We assigned the F555W image to the
blue channel and the F160W image to the red channel, while leaving the
green channel empty. Before producing the RGB composite, we convolve
the F555W image with a Gaussian kernel to match its PSF to that of the
F160W image. We assume that the PSFs of both images are well modeled
by Gaussian PSFs with the respective FWHM as provided by the WFC3
documentation333http://www.stsci.edu/hst/wfc3/ins_performance/ground/components/filters,
http://www.stsci.edu/hst/wfc3/documents/handbooks/currentIHB/c06_uvis07.html#391868,
namely 0.067″ for the F555W channel, and 0.148″ for the
F160W channel. Hence, the Gaussian kernel used on the F555W image
corresponds to a Gaussian function with .
The emission of the three objects is clearly resolved in both bands. For W0116–0505 and W0220+0137 the morphologies seem to be broadly undisturbed in both bands, with the F160W emission having a larger extent and a higher luminosity. The emission peaks in both bands are spatially co-located. W0204–0506 is, on the other hand, quite clearly disturbed, with the F160W morphology (rest-frame 5200Å) suggestive of a recent interaction. The F555W emission (rest-frame 1800Å) is patchy, reminiscent of a starburst. We discuss the implications of this UV morphology further in §4.
To more quantitatively assess the morphology of these sources, we have measured different coefficients commonly used in the literature. Specifically, we follow Lotz et al. (2004) to measure the Gini, and coefficients (Lotz et al., 2004, and references therein). The Gini coefficient (Abraham et al., 2003) measures how uniformly distributed is the light among the pixels of a galaxy in an image, such that Gini is 0 if all pixels have a uniform brightness and is 1 if all brightness is concentrated in a single pixel. The coefficient measures the second order moment of the brightest 20% of the flux of the galaxy as compared to the total second order moment, . The moments are computed around a center chosen to minimize . The coefficient measures the rotational asymmetry of a galaxy by subtracting an image of the galaxy rotated by 180 degrees. The rotational center is chosen to minimize . For further details on these coefficients, we refer the reader to Lotz et al. (2004) and Conselice (2014).
We start by subtracting the background using SExtractor (v2.19.5, Bertin & Arnouts, 1996) as well as obtaining the centroid of each object in each band. We then compute the Petrosian radius (Petrosian, 1976) and generate the segmentation map following Lotz et al. (2004), and finally proceed to measure the coefficients discussed above. The values and uncertainties of the Gini, and coefficients for each object in each band are shown in Table 3. We estimate the uncertainties in each parameter through a Monte Carlo approach. For a given object in a given band, we use the uncertainty in each pixel to generate 1,000 resampled images assuming Gaussian statistics. We then repeat the measurement in each resampled image following the procedure outlined above. We assign the measurement error to be the dispersion of the coefficient measurements in the 1,000 resampled images.
| Source | Band | Gini | ||
|---|---|---|---|---|
| W0116–0505 | F555W | 0.4990.003 | –2.000.16 | 0.1330.010 |
| F160W | 0.5270.008 | –2.080.02 | 0.1160.049 | |
| W0204–0506 | F555W | 0.5290.016 | –1.190.14 | 0.5990.027 |
| F160W | 0.6330.011 | –0.810.02 | 0.2780.010 | |
| W0220+0137 | F555W | 0.4910.004 | –1.770.09 | 0.1120.009 |
| F160W | 0.5590.016 | –2.160.04 | 0.1720.016 |
Recently, Farrah et al. (2017) measured these coefficients for 12 Hot DOGs using HST/WFC3 images in the F160W. Using the boundaries proposed by Lotz et al. (2004) in the Gini– plane and by Lotz et al. (2008) in the Gini– plane, Farrah et al. (2017) determined that while Hot DOGs have a high merger fraction (), this fraction is consistent with that found for massive galaxies at , leading them to conclude that Hot DOGs are not preferentially associated with mergers. These results are generally consistent with those of Fan et al. (2016b) who also found a high merger fraction () among Hot DOGs, as well as with those recently presented by Díaz-Santos et al. (2018), who found evidence with sub-mm ALMA imaging of a triple major merger in the the most luminous Hot DOG, W2246–0526. If we adopt the same boundaries used by Farrah et al. (2017) to classify our sources according to their F160W morphologies, and noting that all caveats identified by Farrah et al. (2017) also apply here, we find that the host galaxies of W0116–0505 and W0220+0137 are not consistent with mergers but instead are classified as undisturbed early-type galaxies. For W0204–0506, on the other hand, we find that its host galaxy morphology is best classified as an on-going merger. These results are consistent with our visual characterization of the host galaxies.
2.4 Chandra Observations
We have obtained Chandra/ACIS-S observations of two of our targets: W0116–0505 and W0220+0137 (proposal ID 17700696). Each object was observed with a total exposure time of 70 ks. W0116–0505 was observed continuously, while the observations of W0220+0137 were split into one 30 ks and two 20 ks visits spread throughout seven days. It is worth noting that these observations have previously been presented by Vito et al. (2018) in the context of a larger sample of Hot DOGs observed in X-rays. They find both sources are heavily absorbed at those wavelengths. Goulding et al. (2018) analyzed the observations for W0220+0137 as well, but in the context of a large sample of Extremely Red Quasars (ERQs), and also found the source to be heavily absorbed at X-ray energies, qualitatively consistent with the rest of the ERQ population analyzed. Here we analyze the data following the approach of A16, who analyzed the archival Chandra/ACIS-I observations of W0204–0506.
We use ciao v4.7 to analyze these data. The spectral data products, including the source and background spectra, and the response files were created using the specextract tool. Source events were extracted from circular regions with 2″ radii centered on the source, while background events were extracted from annuli with inner and outer radii of 3 and 6″, respectively. For W0220+0137, the spectral products from the three observations were combined into one using the tool combine_spectra. We confirm that combining the spectral products in this way does not systematically affect our results by fitting the spectra of each individual obsID simultaneously, linking the fit parameters between them. We find consistent results compared to fitting the combined spectral products and proceed with the combined products. We use the heasoft tool grppha to group the spectra with a minimum of one count per bin.
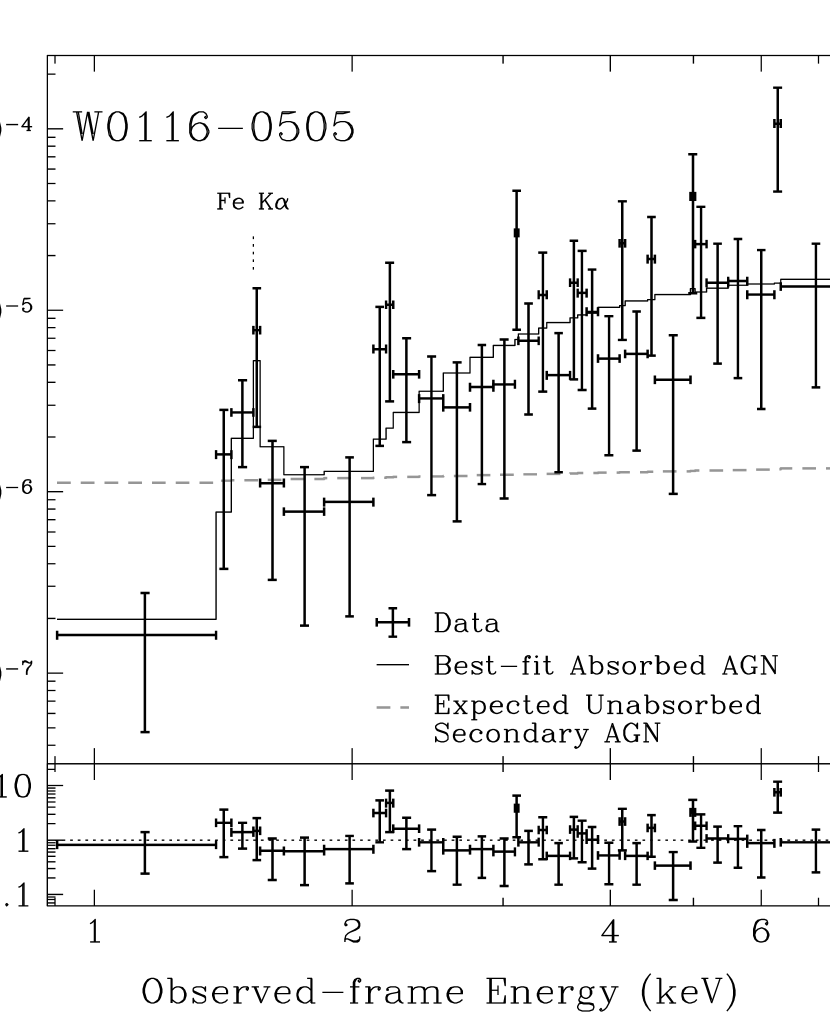
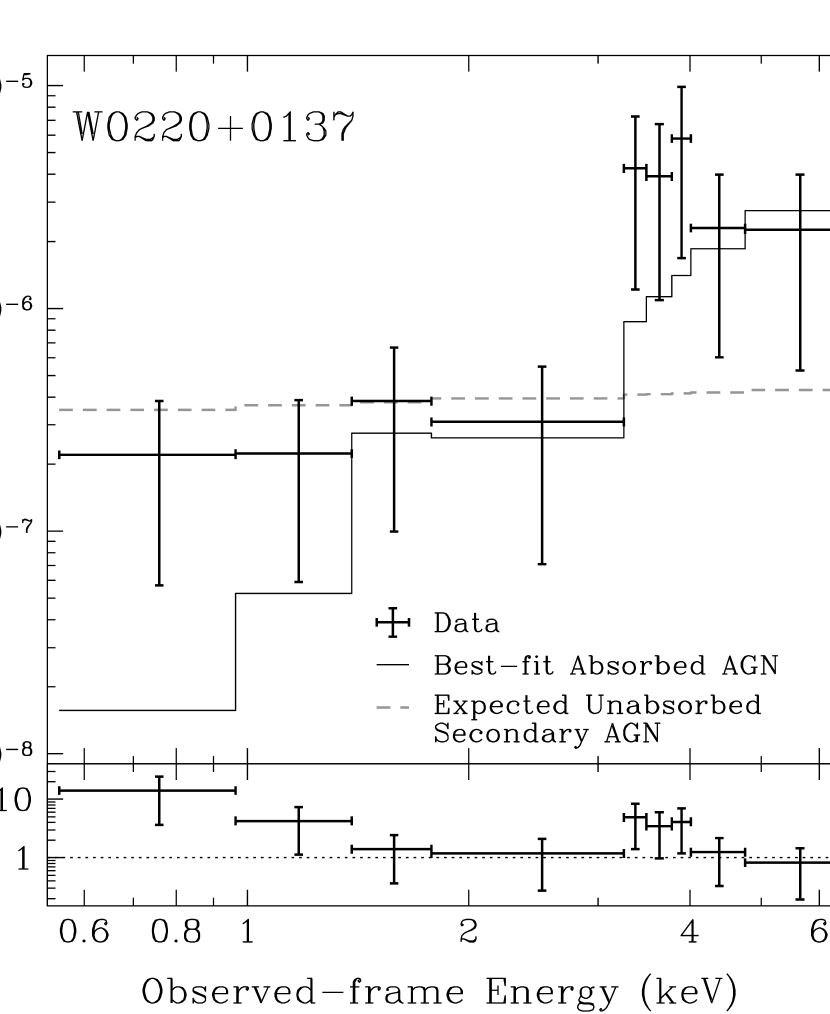
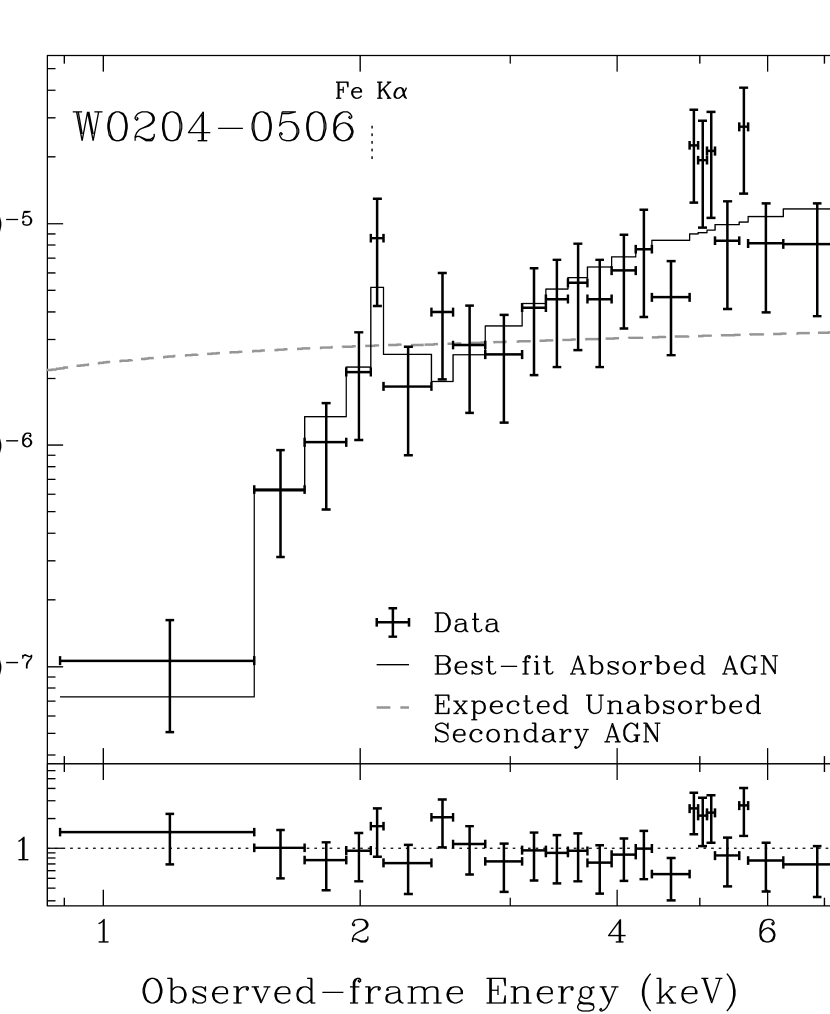
After subtracting the background, 74 counts are detected for W0116–0505, and only 18 for W0220+0137. Figures 6 and 7 show their respective unfolded spectra. Note that the spectra have only been unfolded for the benefit of their presentation. For reference, we also show the ACIS-I spectrum of W0204–0506 in Figure 8, which had a significantly longer exposure time of 160 ks. The shape of all three spectra differ significantly from that of an unabsorbed power-law, suggesting the emission is dominated by a highly obscured AGN, as expected from the SED modeling presented in §2.1. In the next section we model these spectra and discuss their implications for the nature of the BHDs.
3 X-ray Data Modeling
The X-ray spectra of W0116–0505 and W0220+0137 are clearly hard, implying the emission is most likely dominated by a highly obscured AGN. To better constrain the properties of the obscured AGN, we fit the emission of both objects using the models of Brightman & Nandra (2011), following the same approach as in A16. These models predict the X-ray spectrum as observed through an optically thick medium with a toroidal geometry, as posited by the AGN unified scheme. The models employ Monte-Carlo techniques to simulate the transfer of X-ray photons through the optically-thick neutral medium, self-consistently including the effects of photoelectric absorption, Compton scattering and fluorescence from Fe K, amongst other elements. Treating these effects self consistently rather than separately has the advantage of reducing the number of free parameters and of gaining constraints on the spectral parameters. It is therefore particularly useful for low count spectra such as those we are fitting here. We therefore carry out the parameter estimation by minimizing the Cash statistic (Cash, 1979), modified through the W-statistic provided by XSPEC444https://heasarc.gsfc.nasa.gov/xanadu/xspec/manual/XSappendixStatistics.html to account for the subtracted background. Also following the approach of A16, we require the photon index to be , as it is poorly constrained by our data and lower values are only appropriate for low Eddington ratios. In practice, the fitting procedure we used allows values of in the range 1.6–3.0, and values of in the range . However, for W0220+0137, there are too few counts to constrain all spectral parameters, therefore we fix to the canonical value of 1.9, leaving only and the normalization free.
Figures 6 and 7 show the best-fit models to the spectra of W0116–0505 and W0220+0137, respectively. The best-fit absorbed AGN model to W0116–0505 has an absorption column density of neutral hydrogen of , a photon-index of (where signifies that the parameter is bound by the minimum value allowed by the fitting procedure) and an absorption-corrected luminosity of . The best-fit model has a Cash statistic of for degrees of freedom. For W0220+0137, the best-fit model has (where signifies that the parameter is bound by the maximum value allowed by the fitting procedure) and , with and . Given the low number of counts for W0220+0137, Figure 9 shows the confidence regions for the two parameters to highlight the degeneracies between them. The best-fit values of and are consistent within the uncertainties with those found by Vito et al. (2018) for both sources. The best-fit values for W0220+0137 are also consistent within the (large) error bars with those found by Goulding et al. (2018). For W0204–0506, A16 found that the best-fit absorbed AGN has , and , with and .

The spectra of all three objects are likely dominated by a luminous AGN with very high absorption. In the case of W0116–0505 and W0220+0137, the absorption is consistent with the objects being Compton-thick (i.e., ). This is in qualitative agreement with the SED modeling presented in §2.1. From the SED model of each object we can estimate the rest-frame intrinsic (i.e., obscuration corrected) specific luminosity at 6m, , which has been shown to be well correlated with the X-ray luminosity by a number of authors (Fiore et al., 2009; Gandhi et al., 2009; Bauer et al., 2010; Mateos et al., 2015; Stern, 2015; Chen et al., 2017). We use the best-fit relation of Stern (2015) between and , which accurately traces this relation up to very high and is hence most appropriate for our targets. From the of the most luminous and obscured AGN component of W0116–0505, this relation predicts , which is in excellent agreement with the luminosity of the best-fit model to the X-ray data of . For W0220+0137 we also find excellent agreement, with and . A16 nominally found a good agreement as well for W0204–0506, as they estimated and found from the best-fit X-ray model. However, when jointly considering this with the best-fit and expected absorption, their Figure 5 suggests W0204–0506 may be somewhat X-ray weak. We remind the reader, nonetheless, that the error bars derived for our estimates could be underestimated when considering the minimalist approach used for the SED modeling in §2.1, which may make the disagreement less significant.
From the SED modeling we also have an estimate of the amount of dust that is obscuring the luminous AGN that dominates in both the mid-IR and the X-rays. Comparing to the column densities of neutral hydrogen constrained by the modeling of X-ray spectra, we find dust-to-gas ratios of for W0116–0505, where the uncertainty corresponds to the 68.3% confidence interval and has been derived, for simplicity, assuming Gaussian statistics. For W0220+0137 we find . As is not constrained at the 90% level within the model boundaries, we cannot derive a meaningful confidence interval. For W0204–0506, A16 found a larger ratio of . For comparison, the median dust-to-gas ratio in AGN found by Maiolino et al. (2001) is . This value is comparable to that found in W0204–0506, while those found in W0116–0505 and W0220+0137 are lower. Unfortunately the large uncertainties in this quantity make this result difficult to interpret, but it is worth noting that recently Yan et al. (2019) identified a very low dust-to-gas ratio of for a heavily obscured nearby quasar at with , with around coming from the ISM, which could be a better analog to our objects. If the dust-to-gas ratio is indeed significantly lower in W0116–0505 and W0220+0137 than in W0204–0506, it could either imply a low metallicity for the former systems such that there is a deficit of dust overall in the host galaxy, or that a higher than typical fraction of absorbing gas exists within the dust sublimation radius of the accretion disk. We speculate the latter could be consistent with the recent results of Wu et al. (2018) that show Hot DOGs are accreting close to the Eddington limit, perhaps as a result of higher gas densities in the vicinity of the SMBH.
Taken together, these results could imply that W0116–0505 and W0220+0137 represent a different class of object than W0204–0506, as the former are either dust-poor or gas-rich in the nuclear regions, but have normal X-ray luminosities, while the latter has a normal amount of dust but might be somewhat X-ray weak. The morphology of the HST imaging strongly differs between these objects, as discussed in §2.3, further supporting this. Goulding et al. (2018) points out that W0220+0137 is also classified as an ERQ by Hamann et al. (2017), and finds that W0116–0505 fulfills most of the criteria and hence classifies it as ERQ-like. This supports a view in which ERQs and Hot DOGs are not independent populations, but possibly related to each other with BHDs being the link between them. We speculate that Hot DOGs might correspond to the highly obscured AGN phase of galaxy evolution proposed by, e.g., Hopkins et al. (2008) or Alexander & Hickox (2012), and as the obscuration starts clearing out (see Hickox & Alexander, 2018, for a description of the different physical scales of the obscuring materials), the object transforms into a BHD and then an ERQ, before transitioning into an unobscured quasar. The significant levels of outflowing ionized gas identified by Zakamska et al. (2016) for four ERQs, by Díaz-Santos et al. (2016) for the most luminous Hot DOG, W2246–0526, and by Wu et al. (2018) for two more Hot DOGs, support the view that both types of objects are experiencing strong AGN feedback.
4 Source of the Excess Blue Emission
4.1 Dual AGN
One of the possible scenarios proposed by A16 is that BHDs could be powered by two AGNs instead of one, where a primary luminous, highly obscured AGN dominates the mid-IR emission, and a secondary fainter, unobscured or lightly obscured AGN dominates the UV/optical emission. As can be seen in Table 2, the putative secondary AGN has a much lower () best-fit monochromatic luminosity at 6m in all three targets. As discussed above, the former would be expected to dominate the hard X-ray emission of these sources, and that is exactly what is observed. However, the less luminous component would contribute significant soft X-ray emission, that can be constrained by the Chandra observations. In Table 2 we list the expected intrinsic 6m luminosity of the primary and secondary best-fit AGN components for both W0116–0505 and W0220+0137. It is important to note that for the secondary AGN components we have no useful constraints in the IR, as the rest-frame near-IR is dominated by the host galaxy and the mid-IR is dominated by the primary AGN component. Its 6m luminosity comes instead indirectly from the template fit to the rest-frame UV/optical SED. Furthermore, there could be neglected systematic uncertainties, as discussed at the end of §2.1. As we did in §3, we can estimate the expected 2–10 keV luminosity using the relation of Stern (2015). Hence, if the secondary component is a real second AGN in the system, for W0116–0505 we expect it to have an X-ray luminosity of , and for W0220+0137 we expect it to have . The gray-dashed curves in Figures 6 and 7 show the expected X-ray spectrum of these secondary components for W0116–0505 and W0220+0137 respectively. We assume power-law spectra with and no absorption, as both secondary components show no reddening in the UV/optical. Figure 8 also shows the expected X-ray spectrum of the secondary AGN, as determined from the analysis of A16.
If we add a secondary power-law component to the X-ray spectral fit, we can place 90% upper limits on the luminosity of these power-law components of in W0116–0505, and of in W0220+0137. These limits are marginally consistent with the 2–10 keV luminosities expected given the optical/UV luminosities observed. For W0204–0506 on the other hand, A16 was able to rule out this scenario with high confidence. Unlike the analysis presented here, A16 reached this conclusion by comparing the change in Cash statistic of the X-ray spectra modeling obtained by requiring or not the presence of the secondary AGN emission with the expected luminosity. Specifically, A16 found that including the secondary component resulted in an increase in the Cash statistic , which allowed to rule out the dual AGN scenario with confidence. We do not replicate this analysis for W0116–0505 and W0220+0137, as the interpretation of the change in the statistic ( and , respectively) is complicated by the lower number of counts detected, particularly in the case of W0220+0137, and hence we cannot assume Gaussian statistics.
Hence, the X-ray spectra of all three objects are better described by the single, highly absorbed AGN model, suggesting that BHDs are not dual AGN. The case is strongest for W0204–0506, while for W0116–0505 and W0220+0137 we cannot completely reject the dual AGN scenario with high confidence using the current data sets.
4.2 Extreme Star-formation
Another possibility discussed by A16 is that the UV/optical SED of BHDs is powered by unobscured extreme star-formation rather than by unobscured AGN emission. This would account for a very blue UV/optical SED without the X-ray contribution expected for a secondary AGN.
This scenario was studied in detail by A16 for W0204–0506. Modeling the UV/optical SED of this object using the Starburst99 v7.0.0 code (Leitherer et al., 1999, 2010, 2014; Vázquez & Leitherer, 2005) in combination with the EzGal package of Mancone & Gonzalez (2012), they determined that the SED could be consistent with being powered by a young starburst but only if the SFR was very high. Specifically, they assumed the latest Geneva models available for the used version of Starburst 99 (see Leitherer et al., 2014, for details), a constant SFR, and a solar metallicity, and determined that the SED could only be powered by a starburst of age 5 Myr with with 90% confidence. A lower metallicity somewhat eases these constraints, with the lowest metallicity available for the Geneva models in Starburst99 of implying and . However, A16 considered that such a low metallicity was unlikely given the large amount of dust available in the inner regions of the system that give rise to the high specific luminosities in the mid-IR. Furthermore, due to the large, unobscured SFR implied by the solar metallicity models, A16 considered that the UV/optical SED was unlikely powered by a starburst.
However, the morphology of the UV emission in the HST imaging we have obtained (see §2.3 for details) seems to imply that starburst activity is present in W0204–0506. As shown in Figure 5, the flux traced by the F555W band (rest-frame 1750Å) is distributed along the NE section of the galaxy, and concentrated in a few distinct regions. The bulk of the F555W emission is considerably offset from the emission of the older stars traced by the F160W band (rest-frame 5100Å). Furthermore, the morphology of the system is consistent with a merger (see §2.3), which can trigger significant star-formation activity.
The analysis of A16 in conjunction with the HST imaging available for W0204–0506 then imply that if its UV/optical SED is solely powered by a starburst, then the system must be in a very uncommon state. On one hand, it could be that the system has a very large metallicity gradient, such that in the outskirts, where star-formation dominates, the metallicity is close to primordial and SFR is only , yet near the SMBH the metallicity is high enough to allow for the substantial amount of dust needed to obscure the hyper-luminous AGN. The other possibility would be that W0204–0506 does not have a substantial metallicity gradient but is instead powered by the strongest unobscured starburst known with .
A third and more likely option is that while a moderate starburst is ongoing in the system, the UV/optical emission is still dominated by light leaking from the central highly obscured AGN. As shown in Table 3 (also see discussion in §2.3), the light distribution of W0204–0506 in the F555W band has a somewhat larger Gini and a significantly larger coefficient than the other two BHDs studied. While the large is consistent with the observed patchiness of the system, the high Gini coefficient implies that the light is strongly concentrated in the brightest regions. In the left panel of Figure 5 it can be appreciated that the NW UV clump (marked by the magenta circle, 0.2″ diameter) is brighter than the rest, containing approximately 10% of the total F555W flux measured in the 4″ radius aperture. This region is close to the geometrical center of the F160W light distribution, and could correspond to the position of the buried AGN. That the optical spectrum of this source (Fig. 3) shows a mixture of narrow and broad emission lines is also consistent with this picture, as A16 reported a FWHM of for C iv but of only for .
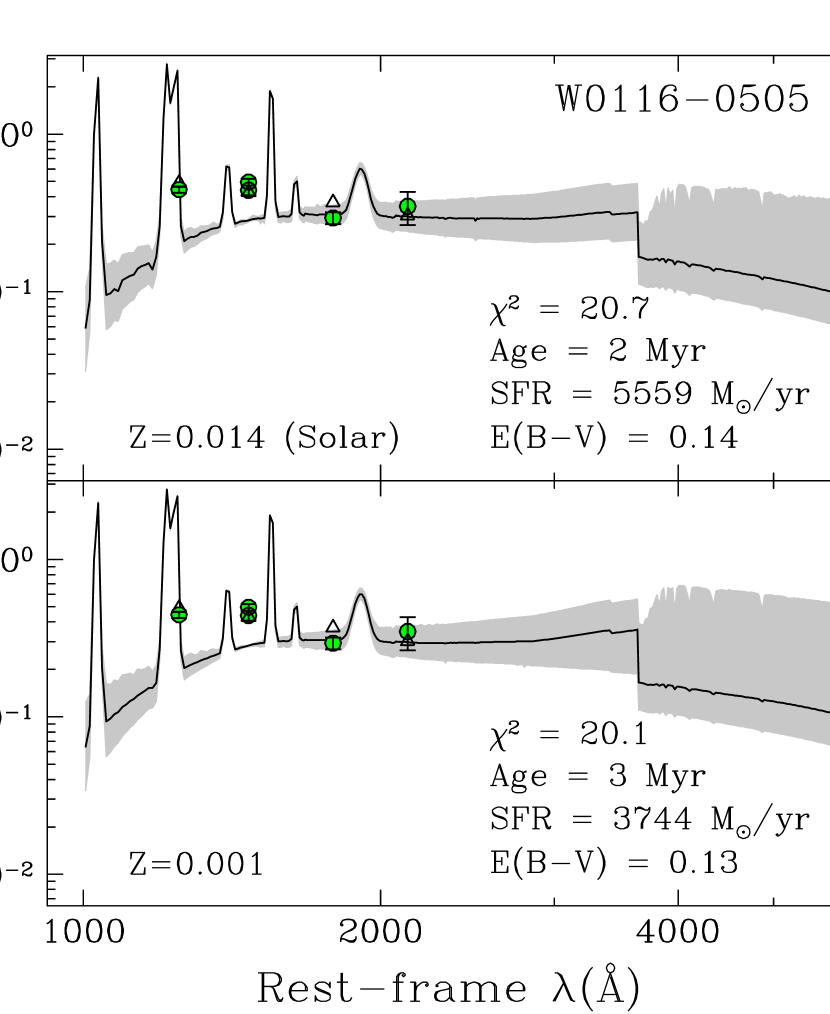
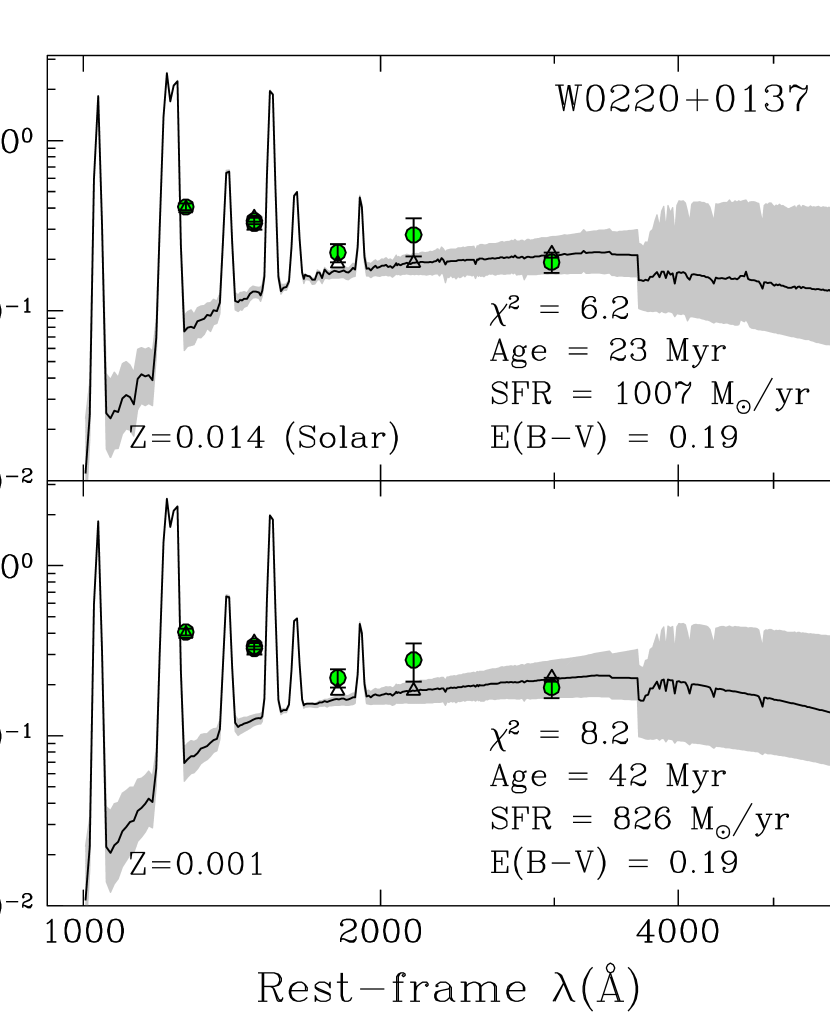
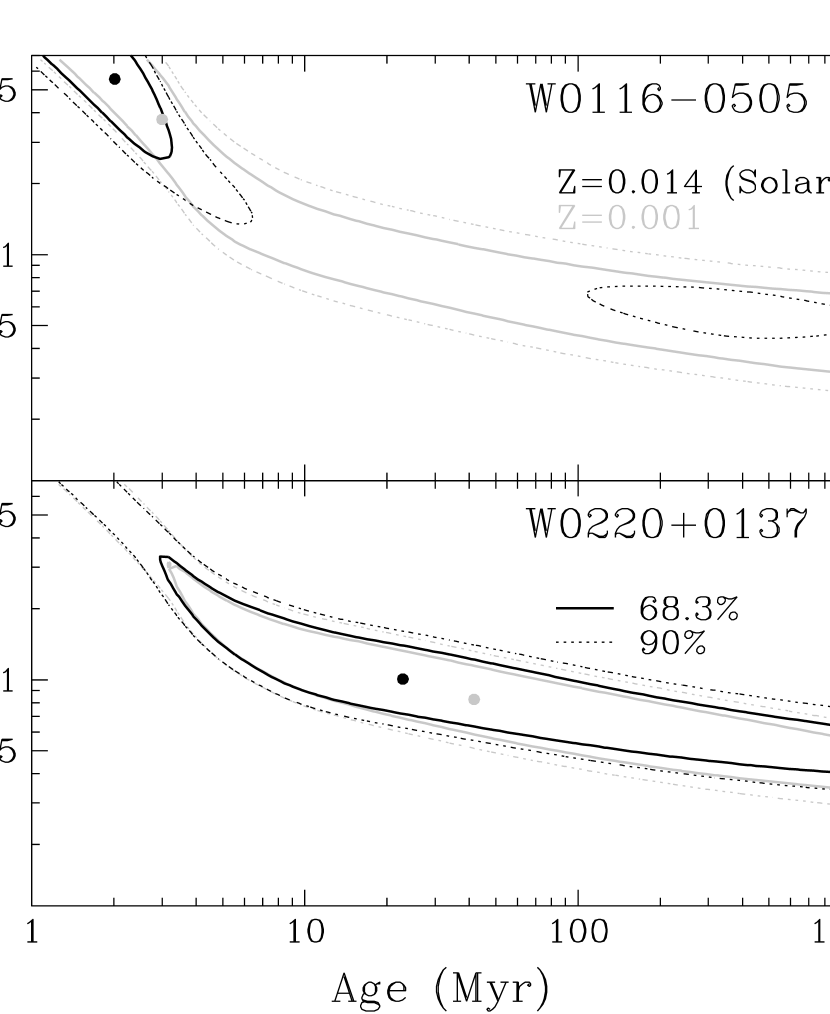
For W0116–0505 and W0220+0137 the situation is somewhat different. The optical spectra, shown in Figures 2 and 4, show clear broad, high-ionization features characteristic of quasars. The UV emission, while spatially extended, is strongly concentrated in both objects (see discussion in §2.3), which is more consistent with the expectations for the dual AGN or the leaked AGN light scenarios, instead of the star-formation scenario. We model the broad-band SEDs of these objects as starbursts as in A16, but with a small modification. As the approach of A16 only models the continuum emission, we add to the Starburst99 models the emission lines of the spectra presented in §2. Each emission line was modeled using a single Gaussian profiles after subtracting a local continuum estimated with a linear interpolation from the continuum regions immediately blue and red of the emission line in question. The only exception to this are Ly and N v, for which the continuum was only modeled using the continuum region immediately red of them as the blue continuum is affected by Ly forest absorption. A single Gaussian profile is good model of the N v, C iv, He ii and C iii] emission as well as for the S iv+O iv] line complex. For Ly we recover the majority of the flux in both objects, but the peak of the best-fit Gaussian falls somewhat short of their observed narrow peak. The best-fit models are shown in Figures 10 and 11 for W0116–0505 and W0220+0137, respectively. Each figure shows the best fit obtained assuming a solar metallicity and a metallicity of discussed above. As we do not include additional nebular emission or Ly forest absorption, we only use the bands that are redward of the Ly emission line and exclude the F160W band, which can be strongly contaminated by an older stellar population and by nebular [O ii] emission (which could be broadened and have a high equivalent width, as found by Jun et al., 2020, for a different group of Hot DOGs). Indeed, if we include the F160W band we find best-fit values a factor 3 larger. We set a minimum photometric uncertainty of 0.05 mag as systematic differences between the measurements are unlikely to be below that level. In practice, this only affects the uncertainty used for the F555W band. The best-fit SFR, age and obscuration of the stellar population are shown in the figures as well; however, the values are quite degenerate as shown in Figure 12, particularly as there are no constraints longwards of 4000Å. The only other longer wavelength broadbands that we have are in regions of the SED dominated by either an older stellar population or by the highly obscured, luminous AGN as shown in Figure 1, and hence are not useful for constraining these fits. We note, however, that the values of the best fits are quite large when it is considered that we are fitting three different parameters. This, coupled with UV/optical spectral features (i.e., the presence of broad emission lines) and the morphology in the HST imaging suggest that the UV/optical emission in these objects is unlikely dominated by unobscured starbursts.
4.3 Leaked AGN Light
The third possibility to explain the nature of BHDs is that the blue excess emission found in these objects corresponds to light coming from the highly obscured primary AGN that is leaking into our line of sight. As discussed by A16, this could happen either due to dust or gas scattering of the AGN emission into our line of sight, or due to a small gap in the dust that allows for a partial view towards the accretion disk and the broad-line region. However, the latter is unlikely, as discussed by A16, as the UV/optical SED is consistent with the emission of an unobscured accretion disk. As radiation at progressively shorter wavelengths is emitted in progressively inner regions of the accretion disk, a gap that only allows 1% of the emitted light through but does not distort the accretion disk spectrum would need to cover 99% of the effective disk size at each wavelength. While not impossible, the shape of such a gap would be exceedingly contrived, making this unlikely. Furthermore, we would not expect the UV/optical emission to be spatially extended, as found in §2.3.
This suggests that the most likely source of the blue excess emission in the three BHDs studied is scattered light. In this scenario, 99% of the emission from the accretion disk and the broad-line region would be absorbed by dust, while 1% will be scattered into our line of sight by either dust or gas, or both. Reflection nebulae are known to make the reflected SED bluer than the emitted SED in the UV (, e.g. see Draine, 2003a), suggesting that the scattering medium in BHDs is more likely the gas surrounding the AGN. However, as there is likely dust on scales larger than the torus (Díaz-Santos et al., 2016; Tsai et al., 2018), we note that our data are not sufficient to rule out an SED that has been made bluer by dust reflection and redder by dust absorption. With respect to the X-rays, we note that while they should also be scattered into our line of sight along with the UV emission, the scattering cross section by either dust or free electrons is significantly smaller at the high energy ranges probed by the Chandra observations (Draine, 2003a, b). Hence, the non-detection of a clear unabsorbed component in the X-ray spectra in §3 is consistent with this scattering scenario.
5 Summary
We have investigated the source of the blue excess emission in three BHDs, two of which were identified as such by A16, and a third one which has an SED consistent with that of a Hot DOG although it does not meet the formal selection criteria due to being slightly too bright in the W1 band. While all Hot DOGs are characterized by mid-IR emission that is most naturally explained by a highly obscured hyper-luminous AGN (Eisenhardt et al., 2012; Assef et al., 2015; Tsai et al., 2015), BHDs have a UV/optical SED that is significantly bluer than expected based on template fitting results. Using a similar approach to that of Assef et al. (2015), we find that the SEDs of BHDs are best modeled using two AGN components: a primary hyper-luminous, highly obscured AGN that dominates the mid-IR emission, and a secondary lower luminosity but unobscured AGN that dominates the UV/optical emission. The bolometric luminosity of the secondary AGN SED is 1% of that of the primary component (although, as discussed at the end of §2.1, there could be unaccounted systematic uncertainties in the luminosities due to our minimalistic SED modeling approach). A16 identified three possible scenarios to produce the excess blue emission, namely: (i) a secondary, less luminous but unobscured AGN in the system, (ii) an extreme starburst, or (iii) leaked UV/optical light from the primary, highly luminous, highly obscured AGN that dominates the mid-IR.
For one of the sources (W0204–0506), A16 ruled out a secondary AGN as the source of the blue excess emission, and instead concluded that the excess was caused by either unobscured star formation with an , or by UV/optical light from the central engine leaking into our line of sight due to scattering or through a partially obscured sight-line, with the scattered AGN light hypothesis deemed more likely. In this paper, we have presented HST/WFC3 imaging of W0204–0506 showing a morphology consistent with an on-going merger and evidence of an on-going widespread starburst. Considering, however, the very high SFR needed to explain the UV emission by star-formation alone, we conclude it is more likely that the UV emission of W0204–0505 arises from a combination of scattered AGN light and star-formation.
We also studied in detail two other BHDs, W0116–0505 and W0220+0137. We present observations obtained with Chandra/ACIS-S and interpret them using the Brightman & Nandra (2011) models. We find that the X-ray spectra are consistent with single luminous, highly absorbed AGNs dominating the X-ray emission. We find that the luminosities of these AGNs are consistent with those expected for the primary AGNs based on their estimated according to the relation of Stern (2015). We also find that the gas-to-dust ratios of the AGNs in these systems are somewhat below the median value found in AGNs by Maiolino et al. (2001) and lower than that found in W0204–0506, suggestive of a lower metallicity or of a higher fraction of absorbing gas within the dust-sublimation radius of the AGN. Based on the UV through mid-IR SED models of these sources, we estimate the expected X-ray luminosity of the putative secondary AGN components assuming it is a second, independent AGN in the system. We found that the X-ray observations are only marginally consistent with the presence of a second AGN component in both W0116–0505 and W0220+0137, suggesting the dual AGN scenario is unlikely.
We followed A16 and modeled the UV emission of W0116–0505 and W0220+0137 assuming a pure starburst scenario, and found that while the best-fit SFRs are generally high, comparable to those found by A16 for W0204–0506, they are not well constrained due to the large degeneracies between SFR, age and metallicity. We found, however, that the values of the best-fit starburst models are large ( for W0116–0506 and for W0220+0137) despite the small number of degrees of freedom (1 and 2 respectively), implying a pure starburst is not a good description of the observed UV SED. Additionally, the rest-frame UV spectra shows broad emission lines characteristic of AGN activity, further suggesting that star-formation does not dominate the observed UV emission.
Finally, we also studied the morphologies observed in the HST/WFC3 F555W and F160W images of W0116–0505 and W0220+0137 and found them to be undisturbed with the UV emission being centrally concentrated. An analysis based on the Gini, and coefficients showed that these systems are best characterized as undisturbed early type galaxies, consistent with the leaked AGN scenario. Considering all of this, we conclude that the source of the UV emission in W0116–0505 and W0220+0137 is scattered light from the hyperluminous, highly obscured AGN that powers the mid-IR SED. Given the detail of our data and SED modeling, we cannot determine whether the scattering material is primarily gas, dust, or a mixture of both. As discussed in §3, W0220+0137 is classified as an ERQ and W0116-0505 is classified as ERQ-like (Hamann et al., 2017). Recently, Alexandroff et al. (2018) found high polarization fractions in the UV spectra of 3 ERQs, implying the UV emission has a strong contribution by scattered light from the central engine for these objects. This is highly consistent with our conclusions.
That all three BHDs we have investigated are due to scattered light from the highly obscured, hyperluminous AGN highlights how powerful the central engine is in Hot DOGs: with only 1% of the emission of the accretion disk scattered into our line of sight, it is still more luminous than the entire stellar emission of the host galaxy in the UV. This is in general agreement with recent results which show that the SMBHs in Hot DOGs are accreting above the Eddington limit (Wu et al., 2018; Tsai et al., 2018) and are injecting large amounts of energy into the ISM of their host galaxies (Díaz-Santos et al., 2016), and hence are experiencing strong events of AGN feedback.
References
- Abraham et al. (2003) Abraham, R. G., van den Bergh, S., & Nair, P. 2003, ApJ, 588, 218
- Alexander & Hickox (2012) Alexander, D. M., & Hickox, R. C. 2012, New A Rev., 56, 93
- Alexandroff et al. (2018) Alexandroff, R. M., Zakamska, N. L., Barth, A. J., et al. 2018, MNRAS, 479, 4936
- Alexandroff et al. (2013) Alexandroff, R., Strauss, M. A., Greene, J. E., et al. 2013, MNRAS, 435, 3306
- Assef et al. (2010) Assef, R. J., Kochanek, C. S., Brodwin, M., et al. 2010, ApJ, 713, 970
- Assef et al. (2011) Assef, R. J., Denney, K. D., Kochanek, C. S., et al. 2011, ApJ, 742, 93
- Assef et al. (2015) Assef, R. J., Eisenhardt, P. R. M., Stern, D., et al. 2015, ApJ, 804, 27
- Assef et al. (2016) Assef, R. J., Walton, D. J., Brightman, M., et al. 2016, ApJ, 819, 111
- Banerji et al. (2015) Banerji, M., Alaghband-Zadeh, S., Hewett, P. C., & McMahon, R. G. 2015, MNRAS, 447, 3368
- Barger et al. (2014) Barger, A. J., Cowie, L. L., Chen, C.-C., et al. 2014, ApJ, 784, 9
- Bauer et al. (2010) Bauer, F. E., Yan, L., Sajina, A., & Alexander, D. M. 2010, ApJ, 710, 212
- Bennert et al. (2011) Bennert, V. N., Auger, M. W., Treu, T., Woo, J.-H., & Malkan, M. A. 2011, ApJ, 726, 59
- Bertin & Arnouts (1996) Bertin, E., & Arnouts, S. 1996, A&AS, 117, 393
- Brightman & Nandra (2011) Brightman, M., & Nandra, K. 2011, MNRAS, 413, 1206
- Cash (1979) Cash, W. 1979, ApJ, 228, 939
- Chen et al. (2017) Chen, C.-T. J., Hickox, R. C., Goulding, A. D., et al. 2017, ApJ, 837, 145
- Conselice (2014) Conselice, C. J. 2014, ARA&A, 52, 291
- Cutri et al. (2012) Cutri, R. M., Wright, E. L., Conrow, T., et al. 2012, Explanatory Supplement to the WISE All-Sky Data Release Products, Tech. rep.
- De Breuck et al. (2001) De Breuck, C., van Breugel, W., Röttgering, H., et al. 2001, AJ, 121, 1241
- Díaz-Santos et al. (2016) Díaz-Santos, T., Assef, R. J., Blain, A. W., et al. 2016, ApJ, 816, L6
- Díaz-Santos et al. (2018) —. 2018, Science, 362, 1034
- Draine (2003a) Draine, B. T. 2003a, ApJ, 598, 1017
- Draine (2003b) —. 2003b, ApJ, 598, 1026
- Eisenhardt et al. (2012) Eisenhardt, P. R. M., Wu, J., Tsai, C.-W., et al. 2012, ApJ, 755, 173
- Fan et al. (2016a) Fan, L., Han, Y., Nikutta, R., Drouart, G., & Knudsen, K. K. 2016a, ApJ, 823, 107
- Fan et al. (2016b) Fan, L., Han, Y., Fang, G., et al. 2016b, ApJ, 822, L32
- Farrah et al. (2017) Farrah, D., Petty, S., Connolly, B., et al. 2017, ApJ, 844, 106
- Finkelstein et al. (2007) Finkelstein, S. L., Rhoads, J. E., Malhotra, S., Pirzkal, N., & Wang, J. 2007, ApJ, 660, 1023
- Fiore et al. (2009) Fiore, F., Puccetti, S., Brusa, M., et al. 2009, ApJ, 693, 447
- Gandhi et al. (2009) Gandhi, P., Horst, H., Smette, A., et al. 2009, A&A, 502, 457
- Goulding et al. (2018) Goulding, A. D., Zakamska, N. L., Alexandroff, R. M., et al. 2018, ApJ, 856, 4
- Griffith et al. (2012) Griffith, R. L., Kirkpatrick, J. D., Eisenhardt, P. R. M., et al. 2012, AJ, 144, 148
- Hamann et al. (2017) Hamann, F., Zakamska, N. L., Ross, N., et al. 2017, MNRAS, 464, 3431
- Hainline et al. (2012) Hainline, K. N., Shapley, A. E., Greene, J. E., et al. 2012, ApJ, 760, 74
- Hickox & Alexander (2018) Hickox, R. C., & Alexander, D. M. 2018, ARA&A, 56, 625
- Hopkins et al. (2008) Hopkins, P. F., Hernquist, L., Cox, T. J., & Kereš, D. 2008, ApJS, 175, 356
- Jun et al. (2020) Jun, H. D., Assef, R. J., Bauer, F. E., et al. 2020, ApJ, accepted (arXiv:1911.09828)
- Leitherer et al. (2014) Leitherer, C., Ekström, S., Meynet, G., et al. 2014, ApJS, 212, 14
- Leitherer et al. (2010) Leitherer, C., Ortiz Otálvaro, P. A., Bresolin, F., et al. 2010, ApJS, 189, 309
- Leitherer et al. (1999) Leitherer, C., Schaerer, D., Goldader, J. D., et al. 1999, ApJS, 123, 3
- Lotz et al. (2004) Lotz, J. M., Primack, J., & Madau, P. 2004, AJ, 128, 163
- Lotz et al. (2008) Lotz, J. M., Davis, M., Faber, S. M., et al. 2008, ApJ, 672, 177
- Lupton et al. (2004) Lupton, R., Blanton, M. R., Fekete, G., et al. 2004, PASP, 116, 133
- Magorrian et al. (1998) Magorrian, J., Tremaine, S., Richstone, D., et al. 1998, AJ, 115, 2285
- Maiolino et al. (2001) Maiolino, R., Marconi, A., Salvati, M., et al. 2001, A&A, 365, 28
- Mancone & Gonzalez (2012) Mancone, C. L., & Gonzalez, A. H. 2012, PASP, 124, 606
- Mateos et al. (2015) Mateos, S., Carrera, F. J., Alonso-Herrero, A., et al. 2015, MNRAS, 449, 1422
- Petrosian (1976) Petrosian, V. 1976, ApJ, 209, L1
- Piconcelli et al. (2015) Piconcelli, E., Vignali, C., Bianchi, S., et al. 2015, A&A, 574, L9
- Rhodes et al. (2000) Rhodes, J., Refregier, A., & Groth, E. J. 2000, ApJ, 536, 79
- Ricci et al. (2017) Ricci, C., Assef, R. J., Stern, D., et al. 2017, ApJ, 835, 105
- Stern (2015) Stern, D. 2015, ApJ, 807, 129
- Stern et al. (2014) Stern, D., Lansbury, G. B., Assef, R. J., et al. 2014, ApJ, 794, 102
- Stern et al. (2002) Stern, D., Moran, E. C., Coil, A. L., et al. 2002, ApJ, 568, 71
- Stern et al. (1999) Stern, D., Dey, A., Spinrad, H., et al. 1999, AJ, 117, 1122
- Tsai et al. (2015) Tsai, C.-W., Eisenhardt, P. R. M., Wu, J., et al. 2015, ApJ, 805, 90
- Tsai et al. (2018) Tsai, C.-W., Eisenhardt, P. R. M., Jun, H. D., et al. 2018, ApJ, 868, 15
- Tsai et al. (in prep.) Tsai, C.-W., et al. in prep.
- van Dokkum (2001) van Dokkum, P. G. 2001, PASP, 113, 1420
- Vázquez & Leitherer (2005) Vázquez, G. A., & Leitherer, C. 2005, ApJ, 621, 695
- Vito et al. (2018) Vito, F., Brandt, W. N., Stern, D., et al. 2018, MNRAS, 474, 4528
- Wright et al. (2010) Wright, E. L., Eisenhardt, P. R. M., Mainzer, A. K., et al. 2010, AJ, 140, 1868
- Wu et al. (2012) Wu, J., Tsai, C.-W., Sayers, J., et al. 2012, ApJ, 756, 96
- Wu et al. (2014) Wu, J., Bussmann, R. S., Tsai, C.-W., et al. 2014, ApJ, 793, 8
- Wu et al. (2018) Wu, J., Jun, H. D., Assef, R. J., et al. 2018, ApJ, 852, 96
- Yan et al. (2019) Yan, W., Hickox, R. C., Hainline, K. N., et al. 2019, ApJ, 870, 33
- Zakamska et al. (2016) Zakamska, N. L., Hamann, F., Pâris, I., et al. 2016, MNRAS, 459, 3144