Electrically pumped semiconductor laser with low spatial coherence and directional emission
Abstract
We design and fabricate an on-chip laser source that produces a directional beam with low spatial coherence. The lasing modes are based on the axial orbit in a stable cavity and have good directionality. To reduce the spatial coherence of emission, the number of transverse lasing modes is maximized by fine-tuning the cavity geometry. Decoherence is reached in a few nanoseconds. Such rapid decoherence will facilitate applications in ultrafast speckle-free full-field imaging.
The high spatial coherence of conventional lasers can introduce coherent artifacts due to uncontrolled diffraction, reflection and optical aberration. A common example is the speckle formed by the interference of coherent waves with random phase differences goodman2007speckle ; dainty2013laser . Speckle noise is detrimental to full-field imaging applications such as displays chellappan2010laser , microscopy, optical coherence tomography, and holography bianco2018strategies . It also poses as a problem for laser-based applications like material processing, photolithography noordman2009speckle , and optical trapping of particles neuman2004optical .
Various approaches to mitigate speckle artifacts have been developed. A traditional method is to average over many independent speckle patterns generated by a moving diffuser lowenthal1971speckle ; kubota2010very , colloidal solution redding2013low , or fast scanning micromirrors akram2010laser . However, the generation of a series of uncorrelated speckle patterns is time-consuming and limited by the mechanical speed. A more efficient approach is to design a multimode laser that generates spatially incoherent emission, thus directly suppressing speckle formation cao2019complex . Low spatial coherence necessitates lasing in numerous distinct spatial modes with independent oscillation phases. For example, a degenerate cavity nixon2013efficient ; chriki2015manipulating ; knitter2016coherence allows a large number of transverse modes to lase, but the setup is bulky and hard to align. Complex lasers with compact size such as random lasers gouedard1993generation ; redding2011spatial ; redding2012speckle ; hokr2016narrow have low spatial coherence and high photon degeneracy, but are mostly on optically pumped. For speckle-free imaging applications, wave-chaotic semiconductor microlasers redding2015low have the advantages of electrical pumping and high internal quantum efficiency. However, disordered or wave-chaotic cavity lasers typically have no preferential emission direction, and the poor collection efficiency greatly reduces their external quantum efficiency. Our goal is creating an electrically pumped multimode semiconductor microlaser without disordered or wave-chaotic cavity to combine low spatial coherence and directional emission.
Moreover, the speed of speckle suppression is crucial for imaging applications. For instance, time-resolved optical imaging to observe fast dynamics requires speckle-free image acquisition with a short integration time, so the oscillation phases of different spatial lasing modes must completely decorrelate during the integration time to attain decoherence. The finite linewidth of individual lasing modes leads to their decoherence on a time scale of . The frequency difference between different lasing modes can lead to even faster decoherence. For example, the emission from many random lasing modes with distinct frequencies exhibits low spatial coherence already within ten nanoseconds mermillod2013time . The decoherence time was measured for a solid-state degenerate cavity laser chriki2018spatiotemporal . The intensity contrast of laser speckle is reduced by the dephasing between different longitudinal mode groups in tens of nanoseconds, but complete decoherence requires a few microseconds due to the small frequency spacing between transverse modes. We aim to further shorten the decoherence time by utilizing the larger mode spacings in a semiconductor microlaser.
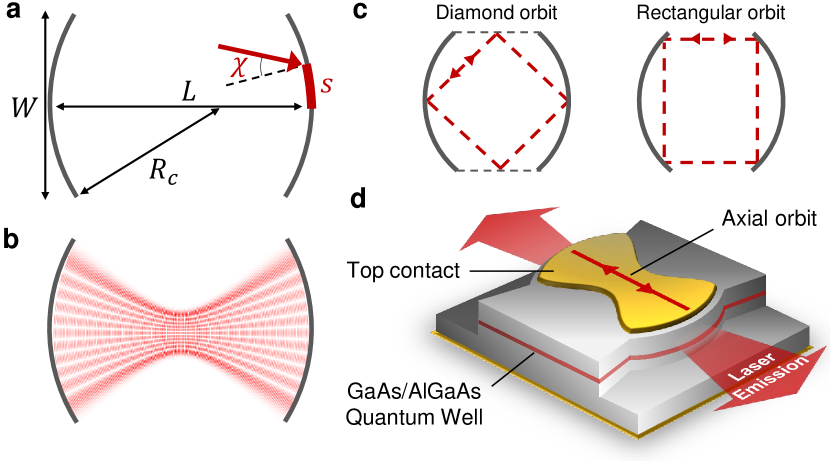
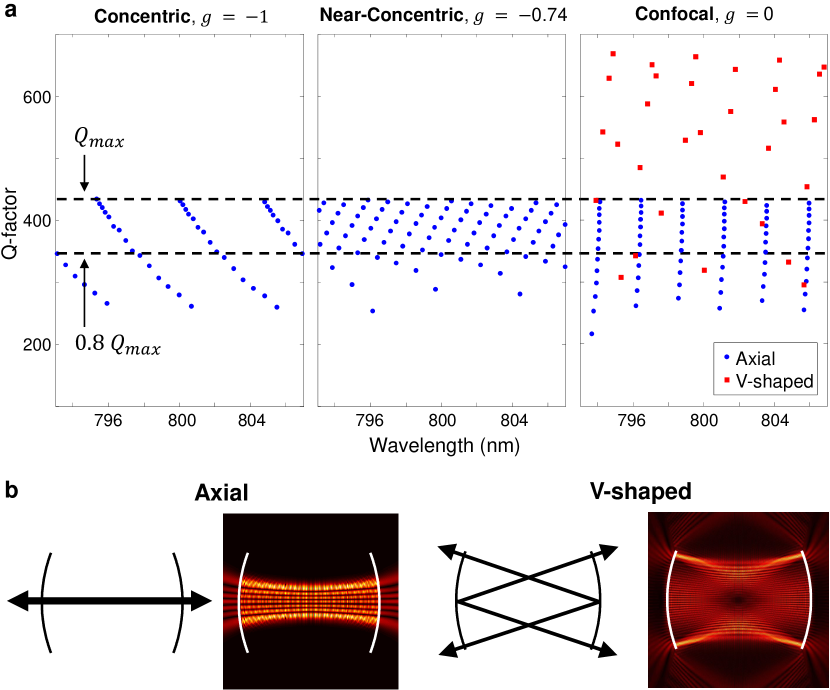
Here we design an electrically-pumped chip-scale semiconductor laser with spatially incoherent and directional emission. The emission from conventional broad-area semiconductor lasers with flat end mirrors exhibits a good directionality. However, lasing occurs only in a few transverse modes since the high-order transverse modes have large divergence angles and hence experience severe losses Lang1991 ; Hartmann2017 . To lower the spatial coherence, we need to increase the number of transverse lasing modes. With curved end mirrors, the losses of high-order transverse modes can be reduced. We consider two-dimensional (2D) symmetric cavities with two circular concave mirrors with radius of curvature as shown in Fig. 1a. The mirrors are separated by the cavity length . The geometry of the cavity is determined by the parameter , which is known as cavity stability parameter. If is larger than , or is within the range , the cavity is called stable in the sense that rays starting near the axial orbit stay close to it and will remain inside the cavity siegman1986lasers . In the paraxial limit, the resonances in the stable cavity are described by Hermite-Gaussian modes, which have different transverse profiles depending on the transverse mode number . Figure 1b shows the spatial intensity profile of a high-order transverse modes with .
Reducing the speckle contrast to below the level of human perception requires 1000 transverse modes to lase simultaneously and independently roelandt2014human ; geri2012perceptual . Previous designs of stable cavity semiconductor lasers with curved facets biellak1995lateral ; fukushima2002ring ; fukushima2012lowest exhibited less than transverse lasing modes. The challenge is to increase the number of transverse lasing modes by two orders of magnitude. To accommodate higher order transverse modes, we increase the cavity width . However, modes based on non-axial orbits like those in Fig. 1c can appear in wide cavities, yielding non-directional emission. To ensure directional emission, all lasing modes must be based on the axial orbit. We eliminate the reflecting surfaces at the lateral sides, to suppress the non-axial modes based on the periodic orbits with bounces from the sidewalls, such as the diamond orbit fukushima2002ring ; fukushima2012lowest . In addition, we set to avoid the rectangle orbits in the stable cavity. A schematic of our design is shown in Fig. 1d. The top metal contact for current injection is shaped to match the profile of high-order transverse modes, to ensure their spatial overlap with the gain.
To maximize the number of high- transverse modes, we optimize the cavity shape by fine tuning while keeping and fixed. We numerically calculate the passive cavity modes using the finite element method (COMSOL). A 2D cavity with m is simulated. The refractive index of the cavity corresponds to the effective refractive index of the vertically guided mode in the GaAs wafer used in the experiment. Transverse-electric (TE) polarization (electric field parallel to the cavity plane) is considered since GaAs quantum wells have higher gain for this polarization and the lasing modes are TE polarized.
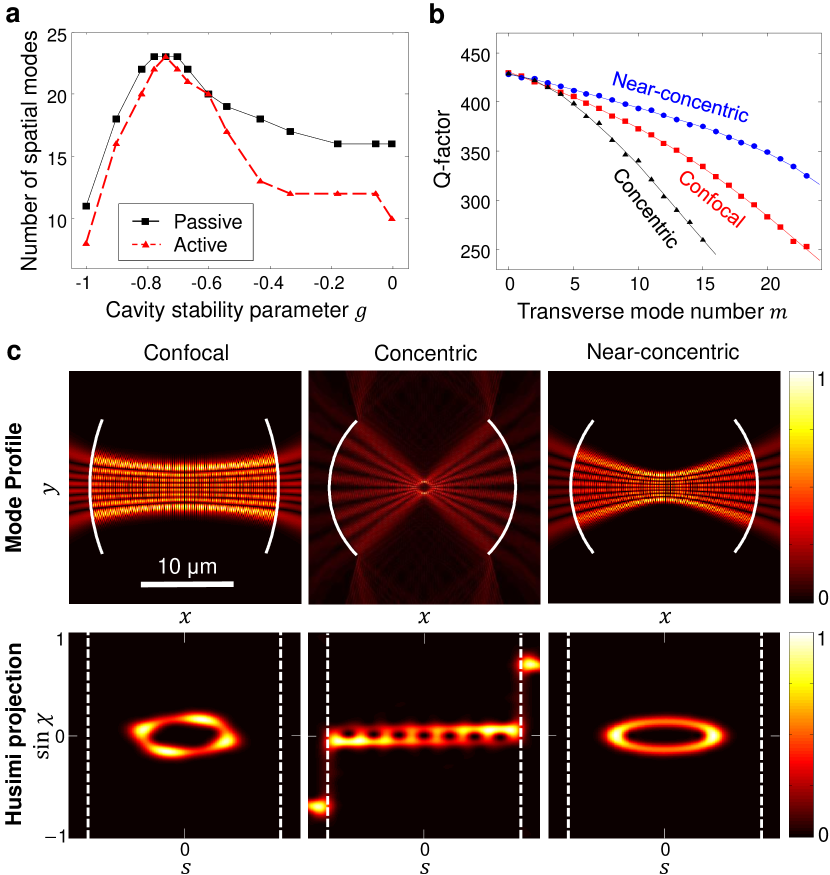
Degenerate cavities with conventional mirrors can support transverse modes with nearly-degenerate -factors thanks to their self-imaging property arnaud1969degenerate ; gigan2005image . As an example of a degenerate cavity we consider the confocal geometry (). For the on-chip design with dielectric interfaces as mirrors, however, the -factor decreases significantly as the transverse mode number increases as shown in Fig. 2b. Figure 2c shows a typical mode laterally confined to the cavity axis, resulting in negligible diffraction loss. However, its Husimi projection hentschel2003husimi , which visualizes the angle of incidence of wave components on different parts of the cavity boundary, features high-intensity spots at nonzero incident angle . As increases, wave components with increasingly higher incident angles appear. Thus high-order transverse modes in the confocal cavity experience higher loss since the reflectivity at a dielectric-air interface decreases with increasing for TE-polarized light, making the confocal cavity unsuitable for multimode lasing.
To solve this problem we consider the concentric cavity (). Since the concentric mirrors are part of a circle, any ray passing through the cavity center hits the boundaries perpendicularly. Indeed the Husimi projection in Fig. 2c is strongly localized at and thus the angle-dependent reflectance is an insignificant loss mechanism. However, as the mode profile exhibits a large divergence, light leaks out via diffraction from the endpoints of the facets. These losses are evident in the Husimi projection from the high-intensity spots just outside the cavity facet. Since the higher order transverse modes experience stronger diffraction loss, the -factor decreases even more quickly with than for the confocal case as seen in Fig. 2b.
We gradually vary from -1 to 0 in search for the optimal geometry that supports the largest number of high- transverse modes. Fig. 2a shows the number of transverse modes, that are based on the axial orbit and have -factors exceeding times the maximal -factor, as a function of . The optimal geometry is near concentric. A slight deviation from the concentric shape makes the mode profiles laterally localized to the cavity axis (see Fig. 2c). Moreover, the Husimi projection shows high-intensity spots centered at , which indicates most wave components have almost normal incidence on the cavity facet. Therefore, the near-concentric geometry minimizes both losses from angle-dependent reflectance and diffraction, resulting in the slowest decrease of with . As the number of transverse modes scales linearly with the width of the cavity when keeping the ratio fixed, we can apply this optimization result to the larger cavities used in experiments (see Supplementary).
The above optimization is based on the passive cavity modes. Gain competition can limit the number of lasing modes additionally. In order to quantify the effect of gain competition, we calculate the number of lasing modes at steady state ge2010steady ; cerjan2016controlling (see Materials and Methods). The red curve in Fig. 2a represents the number of different transverse lasing modes at a pump level of two times above the lasing threshold. In the confocal cavity, the number of lasing modes based on axial orbit is notably smaller than the number of high- passive modes due to the existence of non-axial modes with higher that lase first and saturate the gain for the axial modes (see Supplementary). For the optimized near-concentric cavity, most of the passive transverse modes with high can lase, indicating gain competition is insignificant.
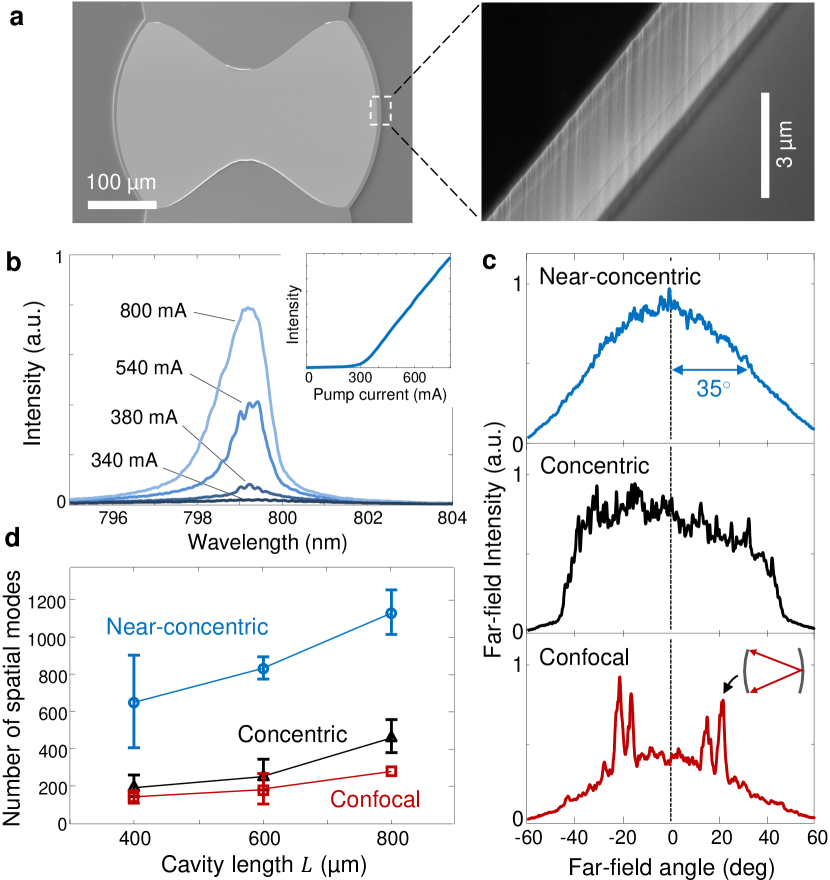
The experimental results for the on-chip stable cavity lasers are presented in Fig. 3. The cavities are fabricated with photolithography followed by reactive ion etching from a commercial GaAs/AlGaAs quantum well epiwafer. The scanning electron microscope (SEM) images in Fig. 3a show that the etched facets, which serve as curved end mirrors, are smooth and vertical. The fabricated sample is mounted on a copper block and a tungsten needle is placed on the top gold contact for current injection. Lasing is observed at room temperature with electrical pumping for all the tested cavities with different sizes and shapes. To reduce heating, the current pulses are s-long with Hz repetition rate. The emission is collected by an objective lens (NA = 0.4) and coupled into a spectrometer. Figure 3b shows the emission spectra from an optimized near-concentric cavity () at different pump currents. A typical spectrum consists of many closely-spaced narrow peaks, indicating simultaneous lasing of many modes. More lasing peaks appear at higher pump currents, and they merge to a smooth, broad spectrum. The L-I curve for a m-long cavity (inset of Fig. 3b) shows the lasing threshold is mA. The threshold current density is inversely proportional to the cavity length (not shown), as expected since the -factors increase linearly with . There was no significant difference between the lasing thresholds for cavities with the same but different .
To investigate the emission directionality, we measure the far-field emission patterns at a pump current two times above the lasing threshold. Figure 3c shows the far-field patterns for three cavity shapes. For a near-concentric cavity (), a directional output beam with a divergence angle (half width at half maximum) of 35∘ is observed. The concentric cavity () shows a flat-top far-field pattern with sharp edges. This pattern is attributed to the broad angular divergence of modes in the concentric cavity. In contrast, the far-field pattern of the confocal cavity features sharp peaks on top of a broad background. The sharp peaks originate from lasing modes based on a V-shaped, non-axial orbit (see inset and Supplementary).
We characterize the spatial coherence of the laser emission from the cavities of different shapes. The emission is coherent in the direction normal to the wafer since the sample has only one index-guided mode in the vertical direction. To measure the coherence of emission in the horizontal direction (parallel to the wafer), we create speckle patterns with a line diffuser that scatters light only in the horizontal direction. A CCD camera records the far-field speckle intensity pattern generated by laser emission from a single s-long pump pulse (see Fig. 4a). In order to quantify the spatial coherence, we calculate the speckle contrast defined as , where and are the standard deviation and mean of the speckle intensity, respectively. gives the effective number of distinct transverse lasing modes goodman2007speckle . Figure 3d gives the values of for cavities with different and , measured at two times of the lasing threshold. The number of transverse lasing modes is the largest for the near-concentric cavity (). With the ratio fixed, the number of transverse modes increases with since a wider cavity supports more transverse modes. For the m near-concentric cavity (), about different transverse modes lase, and their combined emission reduces the speckle contrast to about which is the level of below human perception roelandt2014human ; geri2012perceptual .
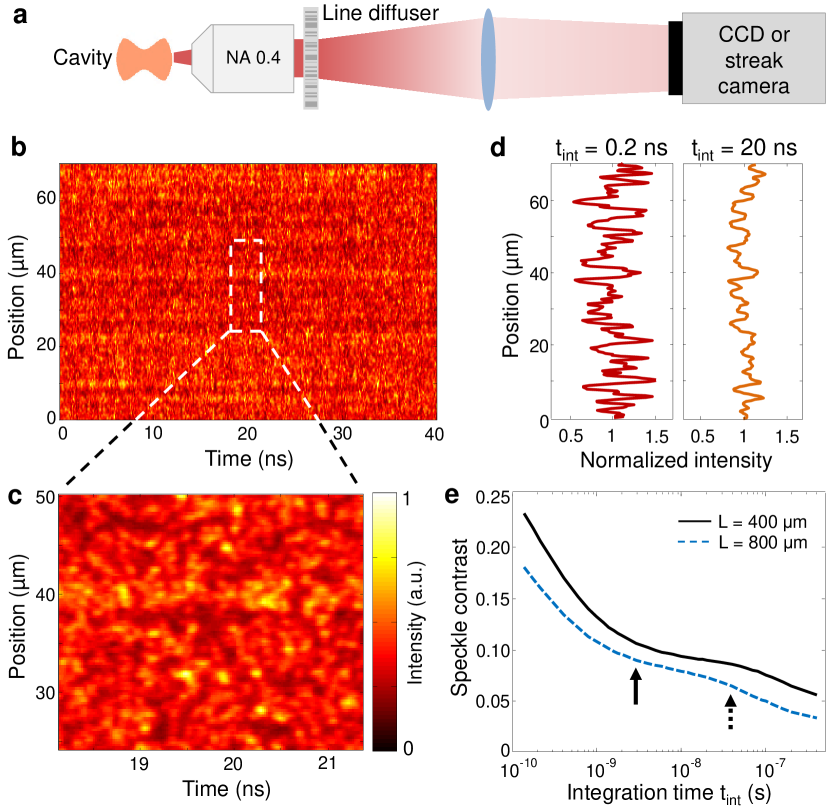
To examine the applicability of the optimized laser for ultrafast speckle-free imaging, we determine how fast decoherence of the emission occurs. We use a streak camera to measure the time-resolved speckle patterns with a temporal resolution of about ps in a setup sketched in Fig. 4a. Figure 4b shows the spatio-temporal evolution of the measured far-field speckle pattern of a near-concentric cavity laser (). The magnification in Fig. 4c reveals rapid spatial and temporal variations of the intensity pattern. To quantify the coherence time of the emission, we calculate the contrast of speckle patterns as a function of the integration time. As shown in Fig. 4d, for a short integration time of ns, the speckle has a notable contrast of . As the integration time increases, the speckle contrast drops quickly. Figure 4e summarizes the reduction of the speckle contrast for from ps to ns. The m-long cavity laser features lower speckle contrast than the m-long cavity laser for all integration times. After a rapid drop, the contrast starts to saturate, exhibiting a kink at a few nanoseconds (indicated by the solid arrow). A second kink (indicated by a dotted arrow) follows at several tens of nanoseconds after which the speckle contrast further declines.
The time scale of the speckle contrast reduction is related to the frequency differences of lasing modes when their linewidths are smaller than their frequency spacings. When the integration time is shorter than the inverse frequency spacing of two modes, their temporal beating results in a visible interference pattern that oscillates in time. For an integration time longer than their beating period, the time-varying interference pattern is averaged out, hence the intensity contrast of the speckle pattern created by these two modes is reduced. With increasing integration time, more and more lasing modes become incoherent, as their frequency spacings exceed , and the speckle contrast continues dropping. Once is long enough to average out the beating of even the closest pairs of lasing modes, the speckle contrast cannot reduce further. The average frequency spacing between adjacent modes is estimated as several hundred MHz in our cavities (See supplementary), whereas the typical linewidth of semiconductor lasers (– MHz) is smaller than the frequency spacing. Thus the integration time needed for contrast reduction is determined by the mode spacing and estimated to be a few nanoseconds, which matches the experimental observations. The additional reduction of the speckle contrast at a few ten nanoseconds is attributed to a thermally-induced change of lasing modes bittner2018suppressing (See supplementary). When the lasing modes change, the output emission patterns change as well and their superposition further reduces the speckle contrast.
In summary, we demonstrate directional emission, low spatial coherence and ultrashort decoherence time in a compact electrically-pumped semiconductor laser. By optimizing the shape of an on-chip near-concentric cavity, we maximize the number of transverse lasing modes and thus greatly suppress speckle formation. Low speckle contrast is obtained even with an integration time of a few nanoseconds. Such short decoherence time enables ultrafast speckle-free full-field imaging. Finally, we compare this work to the previous demonstration of spatially-incoherent non-modal emission from a broad-area vertical-cavity surface-emitting laser peeters2005spatial . By carefully adjusting the pump conditions, the cavity is constantly modified by thermal effects, which disrupts the formation of lasing modes, leading to spatially incoherent emission mandre2008evolution ; craggs2009thermally . Our approach does not rely on thermal effects, and the decoherence time is two orders of magnitude shorter. Furthermore, our method does not utilize any transient process, thus it is applicable to steady-state lasing. With better thermal management, our laser may operate under constant pumping, emitting a continuous wave of low spatial coherence.
Acknowledgments
We thank N. Davidson, R. Chriki, and A. D. Stone for fruitful discussions. This work conducted at Yale University is supported by the Air Force Office of Scientific Research (AFOSR) under grant FA9550-16-1-0416, and by the Office of Naval Research (ONR) with MURI grant N00014-13-1-0649. For the work at Nanyang Technological University, funding support is acknowledged from the the Ministry of Education, Singapore grant (MOE2016-T2-1-128, MOE2016-T2-2-159) and National Research Foundation, Competitive Research Program (NRF-CRP18-2017-02).
SUPPLEMENTARY MATERIAL
Materials and methods
Passive cavity modes. We calculate the cavity resonances with the COMSOL eigenfrequency solver module. The cavity resonances are the solutions of the scalar Helmholtz equation
| (1) |
with outgoing wave boundary conditions where is the free-space wave number and is the z-component of the magnetic field. The cavity length is m and the transverse width m, which is the maximum width for that the rectangle orbit is avoided (see Fig. 1c of the main text). For the fine-tuning of the cavity geometry, only the radius of curvature of the end mirrors is adjusted from m (concentric, ) to m (confocal, ), while and are kept constant. The resonant modes are obtained in a spectral range centered at nm, which is the approximate lasing emission wavelength in the experiments.
Figure 5 shows the quality factors and wavelengths of high- modes in concentric (), near-concentric (), and confocal () cavities. The numerically calculated mode wavelengths agree well with the analytic expression for the frequencies of Hermite-Gaussian modes siegman1986lasers ,
| (2) |
where is the frequency, is the speed of light, is the refractive index, is the cavity length, is the cavity stability parameter, and are the longitudinal and transverse mode numbers, respectively. The deviations between numerical and analytic mode wavelengths gradually grow as increases and reach for the highest-order high- transverse mode () in the near-concentric cavity. The deviations are larger for the concentric cavity (), since it is at the border of the stability region where Eq. (2) no longer holds. The fundamental transverse Hermite-Gaussian modes () have the highest -factors , which is equal to the -factor of a Fabry-Perot cavity with length ,
| (3) |
where is the vacuum frequency and is the reflectivity of the cavity facet for normal incidence. The number of high- modes shown in Fig. 2a is given by the number of modes whose -factor is above (this range is marked by the horizontal dashed lines in Fig. 5).
In addition to the usual Hermite-Gaussian modes based on the axial orbit, modes based on V-shaped orbits (see Fig. 5) exist in confocal () and near-confocal ( close to ) geometries. These modes are indicated as red squares in Fig. 5a, and in most cases exhibit higher -factors than the axial modes since the V-shaped orbit experiences total internal reflection at one mirror facet. The number of high- modes in Fig. 2a refers only to the axial modes, excluding the non-axial orbits which are undesirable due to their non-directional output.
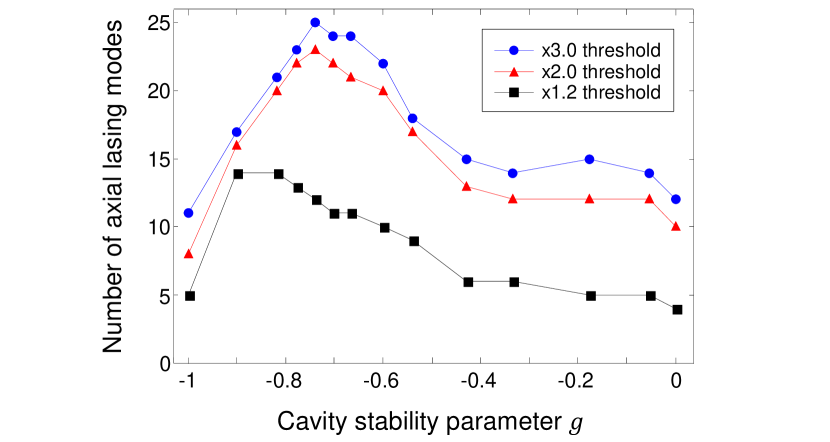
Gain competition. We use the SALT (steady-state ab-initio laser theory) to investigate the effect of mode competition in an active cavity cerjan2016controlling . We assume a spatially uniform distribution of pump and a flat gain spectrum. Both axial and non-axial modes are included in the simulations, and the presence of non-axial modes in the (near-) confocal cavities reduces the number of axial lasing modes, since the former have higher -factors than the latter. Figure 6 shows the number of distinct transverse lasing modes at different pump levels, where only axial modes are counted. The pump level is defined with respect to the first lasing threshold of the axial modes. The maximum number of axial lasing modes is reached in the near-concentric regime of close to . The optimal value depends slightly on the pump level, but it remains at when the pump exceeds twice of the lasing threshold.
Sample fabrication. We use a commercial diode laser wafer (Q-Photonics QEWLD-808). The gain medium is a nm-thick GaAs quantum well, embedded in the middle of an undoped nm-thick Al0.37Ga0.63As guiding layer, which itself is between p-doped and n-doped Al0.55Ga0.45As cladding layers (each is m thick).
The laser cavities are fabricated by the following procedure. First the back contact made of Ni/Ge/Au/Ni/Au layers (thicknesses are nm, respectively) is deposited and thermally annealed at for s. Then a nm-thick SiO2layer is deposited on the front side. The cavity shapes are defined by photolithography and transferred to the SiO2 layer by reactive ion etching (RIE) with a CF4 (30 sccm) and CHF3 (30 sccm) mixture. After the removal of the photoresist, the remaining SiO2 is used as mask for an inductively coupled plasma (ICP) dry etching with an Ar (5 sccm), Cl2 (4 sccm), and BCl3 (4.5 sccm) plasma mixture to create the cavities. The etch depth is about m to etch all the way through the guiding layer and partially into the bottom cladding layer. After the ICP dry etching, the SiO2 mask is removed by RIE and a buffered oxide etch (BOE).
The top metal contacts are defined by negative photolithography, followed by Ti/Au (thicknesses nm) deposition. The boundaries of the top contacts are m away from the cavity edges to prevent the top contacts from hanging down and blocking the emission from the facets. The last process is the lift-off and the sample is cleaned by O2 plasma afterwards.
Electrical pumping. The fabricated samples are mounted on a copper plate and a tungsten needle (Quater Research, H-20242) is placed on the top contact for electric current injection. The lasers are pumped electrically by a diode driver (DEI Scientific, PCX-7401) which generates a series of rectangular current pulses. We use a pulse length of s and a low repetition rate of Hz in order to reduce heating.
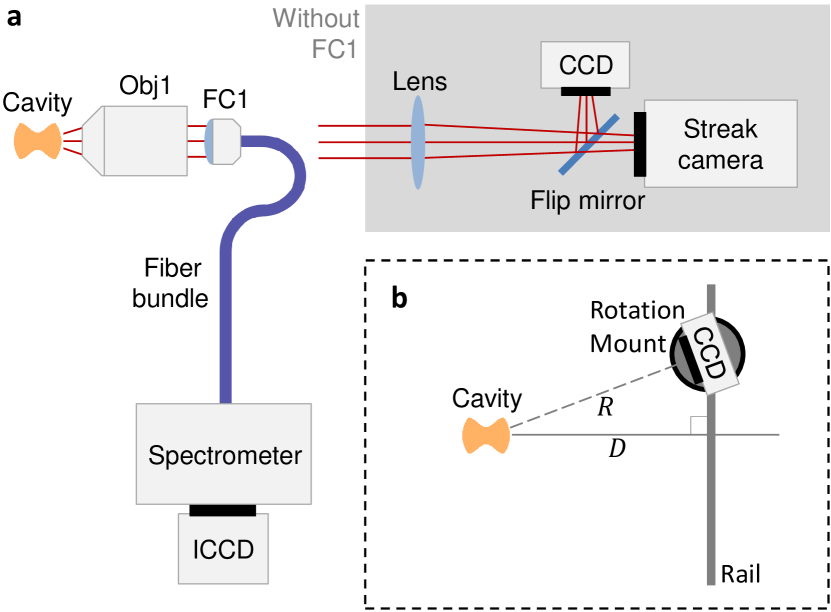
Laser testing. The optical setups used for laser characterization are sketched in Fig. 7a. For spectral measurements, the laser emission is collected by a microscope objective (NA = 0.40). It is then coupled into a fiber bundle with a fiber collimator (NA = 0.50) behind the objective lens. Its spectrum is measured by an imaging monochromator (Acton SP300i) equipped with an intensified CCD camera (Andor iStar DH312T-18U-73).
To test the laser directionality, we measure the far-field emission patterns with the setup in Fig. 7b. The objective lens is removed and the laser emission is measured after free-space propagation. A CCD camera (Allied Vision, Manta G-235B) is placed at a distance cm away from the cavity. A large angular range is covered by moving the CCD camera on a rail while rotating the camera to face the cavity at every position. Since the distance from the cavity to the camera varies with the position, the measured intensity is rescaled by accordingly. The recorded images are stitched together in the horizontal direction and vertically integrated to obtain the far-field patterns shown in Fig. 3c.
Measurement of spatial coherence. The spatial coherence of laser emission is measured using speckle patterns generated by a line diffuser. The microscopic structure of the line diffuser (RPC Photonics, EDL-20) consists of fine random elongated grains of about m width on top of a quasi-periodic structure of m scale.
The optical setup (Fig. 4a) consists of an objective lens that collects the laser emission and a line diffuser that is placed in the pupil plane of the objective ( mm diameter). The laser emission fills the entire aperture of the objective and thus covers hundreds of random elongated grains of the line diffuser. A plano-convex lens in configuration between the diffuser and the CCD camera (Allied Vision, Mako G-125B) allows to measure the far-field speckle patterns.
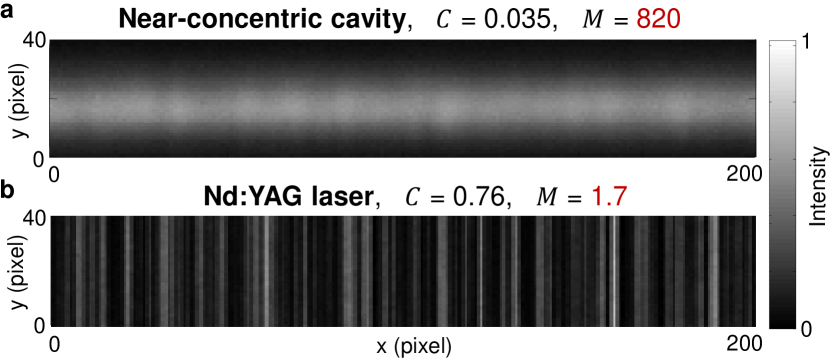
Figure 8a is the measured speckle pattern from a near-concentric cavity laser. For comparison, the speckle pattern from a source with high spatial coherence, a frequency-doubled Nd:YAG laser (Continuum, Minilite), is also measured with the same optical configuration (Fig. 8b). The typical speckle size on the CCD camera is pixel calculated from the intensity autocorrelation function, so that the speckle contrast reduction due to undersampling is negligible goodman2007speckle . For each speckle contrast measurement, speckle patterns are repeatedly measured for different lateral positions of the line diffuser, and the speckle contrasts for these different disorder realizations are averaged.
In order to measure time-resolved speckle patterns, the CCD camera is replaced by a streak camera (Hamamatsu C5680) with a fast sweep unit (M5676). The streak camera is operated with ns-long time windows and the temporal resolution is about ps. The time-resolved speckle patterns in longer time windows are obtained by putting together multiple ns-long streak images for consecutive time intervals.
Scaling of the number of modes with the cavity size
When comparing different cavity geometries, we simulate small cavities with length m and width m to keep the computation time reasonably short. However, the cavities used in experiments are much larger with –m and –m, in order to increase the total number of transverse modes and lower the pump current density to reduce heating. To verify that the optimal value of the stability parameter found in simulations holds for larger cavities, we perform simulations with a m-long cavity.
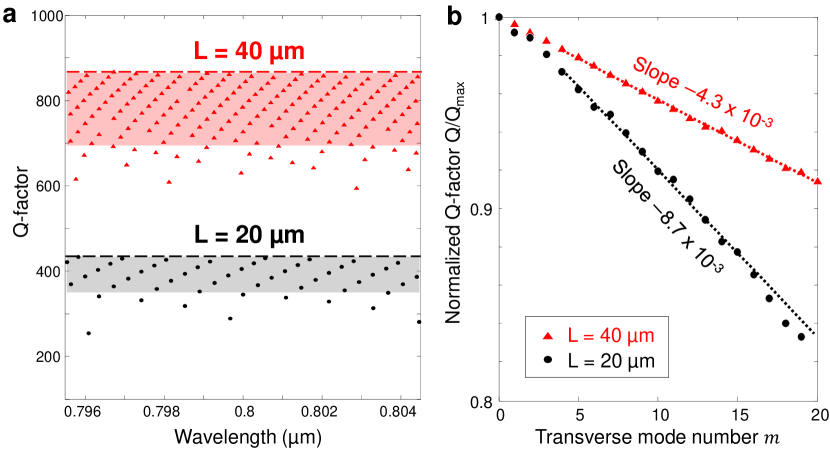
Figure 9 shows the high- modes in two near-concentric cavities () with m and m. The ratio is the same for both cavities. The wavelengths and quality factors of the modes with relatively high are shown in Fig. 9a. The maximum -factor of the m and m cavities are and , respectively, as expected from Eq. (3). The shaded regions in Fig. 9a indicate the high- regions of . The high- resonances of the m-long cavity are more closely spaced than those of the m-long cavity since the total number of resonances is proportional to the area of the cavity.
Figure 9b shows the dependence of the -factors on the transverse mode number for the near-concentric cavities () for m and m. The -factors decrease approximately linearly with , where the slope of the decrease for the m-long cavity is about one half of that for the m-long cavity. This indicates that the number of different transverse modes with high- is about twice as large for the m-long cavity as for the m-long cavity. This linear scaling is verified for another cavity geometry, , where the slopes are and for m and m-long cavities, respectively. Due to this linear scaling, the optimal value of , at which the number of high- transverse modes is maximal, is independent of the cavity size.
Frequency spacing of cavity resonances
The first kink in Fig. 4e of the main text indicates that the speckle contrast saturates at the integration time of a few nanoseconds. This time scale is related to the average frequency spacing between neighboring modes. We estimate the average mode spacing using the simulation results for a small cavity and apply linear scaling with the cavity size as explained in the previous section. For the near-concentric cavity () with m, the number of high- transverse modes is as given in Fig. 2a. The free-spectral-range (FSR) is given by the longitudinal mode spacing, THz. Within one FSR, there is a series of transverse modes with –. Thus the average frequency spacing between adjacent transverse modes is about GHz.
In the experiments, the laser cavities with m have both and increased by a factor of compared to the simulated ones. Consequently, the FSR is reduced by a factor of 20, and the number of transverse modes within one FSR increases by 20. Therefore, the average mode spacing is reduced by a factor of , which yields MHz. The beating of two modes is averaged out when the integration time is longer than the inverse mode spacing, which is about ns. This estimation gives the correct order of magnitude for the integration time at which the speckle contrast stops dropping in Fig. 4e.
Thermally-induced mode instability
In Fig. 4e of the main text, the speckle contrast displays a second kink at several tens of nanoseconds after which the contrast further decreases. This behavior is caused by thermal effects that cause the lasing modes to change in time. We conduct time-resolved measurements of the lasing spectrum to observe the spectro-temporal dynamics. The gating function of the intensified CCD camera is used to acquire the lasing spectra with ns time resolution. The spectra from multiple measurements with consecutive time intervals during the pump pulse are combined to obtain the spectrochronogram of a whole pulse. Figure 10a is the measured spectrochronogram of a near-concentric cavity laser with m. Since thermal equilibrium is not reached, the emission spectrum red-shifts during the pulse due to sample heating. Figure 10b is the spectrochronogram in a ns-long interval with a finer temporal resolution of ns.
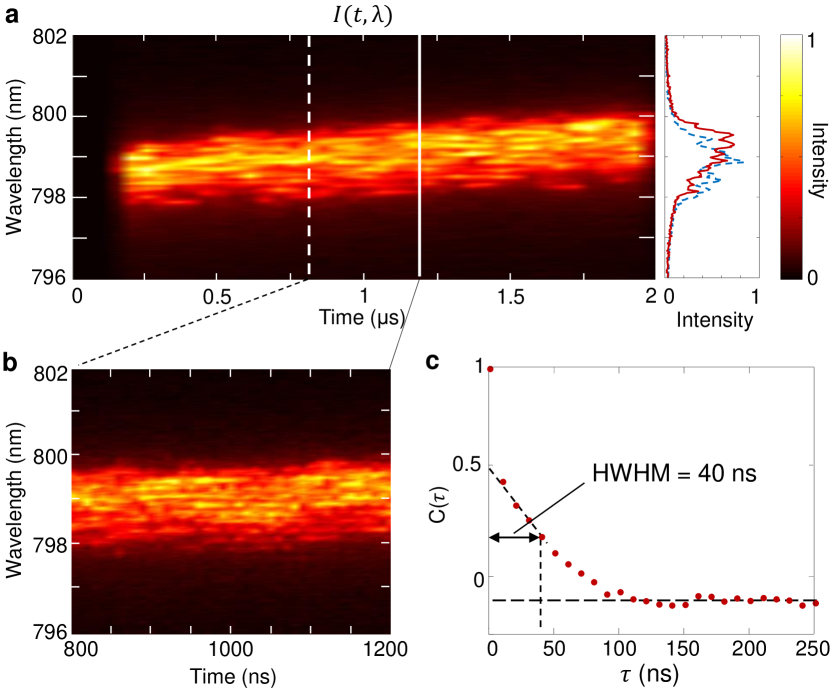
The measured spectrochronogram reveals changes of the lasing spectrum during the pulse. Lasing peaks appear or disappear over the course of the pump pulse as different lasing modes turn on or off. In order to quantify the time scale of these changes, we calculate the temporal correlation function of the spectral changes defined as bittner2018suppressing
| (4) |
where is the normalized change of the emission intensity and is the standard deviation. The half width at half maximum (HWHM) of the temporal correlation function gives the time scale of the spectral dynamics. In Fig. 10c, the sharp drop of at is caused by the measurement noise. The HWHM of is about ns, extrapolated from the more gradual decrease of after the initial drop. This is approximately the integration time in Fig. 4e where the second kink occurs, thus the further reduction of the speckle contrast is caused by the switching of lasing modes. The new lasing modes generate distinct speckle patterns that are superposed to the ones created by the old lasing modes, reducing the intensity contrast of the time-integrated speckle patterns.
References
- (1) Goodman, J. W. Speckle phenomena in optics: theory, applications, (Roberts, Company Publishers, 2007)
- (2) Dainty, J. C. Laser speckle, related phenomena, (Springer Science & Business Media, 2013)
- (3) Chellappan, K. V., Erden, E., Urey, H. Laser-based displays: a review. Appl. Opt., 49, F79–F98 (2010).
- (4) Bianco, V., Memmolo, P., Leo, M., Montresor, S., Distante, C., Paturzo, M., Picart, P., Javidi, B., Ferraro, P. Strategies for reducing speckle noise in digital holography. Light: Sci. & Appl., 7, 48 (2018).
- (5) Noordman, O., Tychkov, A., Baselmans, J., Tsacoyeanes, J. G., Politi, G., Patra, M., Blahnik, V., Maul, M. Speckle in optical lithography, its influence on linewidth roughness. J. Micro/Nanolith. MEMS MOEMS, 8, 043002 (2009).
- (6) Neuman, K. C., Block, S. M. Optical trapping. Rev. Sci. Instrum., 75, 2787–2809 (2004).
- (7) Lowenthal, S., Joyeux, D. Speckle removal by a slowly moving diffuser associated with a motionless diffuser. J. Opt. Soc. Am., 61, 847–851 (1971).
- (8) Kubota, S., Goodman, J. W. Very efficient speckle contrast reduction realized by moving diffuser device. Appl. Opt., 49, 4385–4391 (2010).
- (9) Redding, B., Allen, G., Dufresne, E. R., Cao, H. Low-loss high-speed speckle reduction using a colloidal dispersion. Appl. Opt., 52, 1168–1172 (2013).
- (10) Akram, M. N., Tong, Z., Ouyang, G., Chen, X., Kartashov, V. Laser speckle reduction due to spatial, angular diversity introduced by fast scanning micromirror. Appl. Opt., 49, 3297–3304 (2010).
- (11) Cao, H., Chriki, R., Bittner, S., Friesem, A. A., Davidson, N. Complex lasers with controllable coherence. Nat. Rev. Phys., 1, 156–168 (2019).
- (12) Nixon, M., Redding, B., Friesem, A. A., Cao, H., Davidson, N. Efficient method for controlling the spatial coherence of a laser. Opt. Lett., 38, 3858–3861 (2013).
- (13) Knitter, S., Liu, C., Redding, B., Khokha, M. K., Choma, M. A., Cao, H. Coherence switching of a degenerate VECSEL for multimodality imaging. Optica, 3, 403–406 (2016).
- (14) Chriki, R., Nixon, M., Pal, V., Tradonsky, C., Barach, G., Friesem, A. A., Davidson, N. Manipulating the spatial coherence of a laser source. Opt. Express, 23, 12989–12997 (2015).
- (15) Gouedard, C., Husson, D., Sauteret, C., Auzel, F., Migus, A. Generation of spatially incoherent short pulses in laser-pumped neodymium stoichiometric crystals, powders. J. Opt. Soc. Am. B, 10, 2358–2363 (1993).
- (16) Redding, B., Choma, M. A., Cao, H. Spatial coherence of random laser emission. Opt. Lett., 36, 3404–3406 (2011).
- (17) Redding, B., Choma, M. A., Cao, H. Speckle-free laser imaging using random laser illumination. Nat. Photonics, 6, 355 (2012).
- (18) Hokr, B. H., Schmidt, M. S., Bixler, J. N., Dyer, P. N., Noojin, G. D., Redding, B., Thomas, R. J., Rockwell, B. A., Cao, H., Yakovlev, V. V. A narrow-band speckle-free light source via random Raman lasing. J. Mod. Opt., 63, 46–49 (2016).
- (19) Redding, B., Cerjan, A., Huang, X., Lee, M. L., Stone, A. D., Choma, M. A., Cao, H. Low spatial coherence electrically pumped semiconductor laser for speckle-free full-field imaging. Proc. Natl. Acad. Sci. USA, 112, 1304–1309 (2015).
- (20) Mermillod-Blondin, A., Mentzel, H., Rosenfeld, A. Time-resolved microscopy with random lasers. Opt. Lett., 38, 4112–4115 (2013).
- (21) Chriki, R., Mahler, S., Tradonsky, C., Pal, V., Friesem, A. A., Davidson, N. Spatiotemporal supermodes: Rapid reduction of spatial coherence in highly multimode lasers. Phys. Rev. A, 98, 023812 (2018).
- (22) Lang, R. J., Larsson, A. G., Cody, J. G. Lateral modes of broad area semiconductor lasers: theory, experiment. IEEE J. Quantum Electron., 27, 312 (1991).
- (23) Hartmann, S., Elsäßer, W. A novel semiconductor-based, fully incoherent amplified spontaneous emission light source for ghost imaging. Sci. Rep., 7, 41866 (2017).
- (24) Siegman, A. E. Lasers, (University Science Books, 1986)
- (25) Roelandt, S., Meuret, Y., Jacobs, A., Willaert, K., Janssens, P., Thienpont, H., Verschaffelt, G. Human speckle perception threshold for still images from a laser projection system. Opt. Express, 22, 23965–23979 (2014).
- (26) Geri, G. A., Williams, L. A. Perceptual assessment of laser-speckle contrast. J. Soc. Inf. Display, 20, 22–27 (2012).
- (27) Biellak, S. A., Sun, Y., Wong, S. S., Siegman, A. E. Lateral mode behavior of reactive-ion-etched stable-resonator semiconductor lasers. J. Appl. Phys., 78, 4294–4296 (1995).
- (28) Fukushima, T., Harayama, T., Davis, P., Vaccaro, P. O., Nishimura, T., Aida, T. Ring, axis mode lasing in quasi-stadium laser diodes with concentric end mirrors. Opt. Lett., 27, 1430–1432 (2002).
- (29) Fukushima, T., Sunada, S., Harayama, T., Sakaguchi, K., Tokuda, Y. Lowest-order axial, ring mode lasing in confocal quasi-stadium laser diodes. Appl. Opt., 51, 2515–2520 (2012).
- (30) Gigan, S., Lopez, L., Treps, N., Maître, A., Fabre, C. Image transmission through a stable paraxial cavity. Phys. Rev. A, 72, 023804 (2005).
- (31) Arnaud, J. A. Degenerate optical cavities. Appl. Opt., 8, 189–196 (1969).
- (32) Hentschel, M., Schomerus, H., Schubert, R. Husimi functions at dielectric interfaces: Inside-outside duality for optical systems, beyond. Europhys. Lett., 62, 636 (2003).
- (33) Ge, L., Chong, Y. D., Stone, A. D. Steady-state ab initio laser theory: generalizations, analytic results. Phys. Rev. A, 82, 063824 (2010).
- (34) Cerjan, A., Redding, B., Ge, L., Liew, S. F., Cao, H., Stone, A. D. Controlling mode competition by tailoring the spatial pump distribution in a laser: a resonance-based approach. Opt. Express, 24, 26006–26015 (2016).
- (35) Bittner, S., Guazzotti, S., Zeng, Y., Hu, X., Yılmaz, H., Kim, K., Oh, S., Wang, Q., Hess, O., Cao, H. Suppressing spatiotemporal lasing instabilities with wave-chaotic microcavities. Science, 361, 1225–1231 (2018).
- (36) Peeters, M., Verschaffelt, G., Thienpont, H., Mandre, S. K., Fischer, I., Grabherr, M. Spatial decoherence of pulsed broad-area vertical-cavity surface-emitting lasers. Opt. Express, 13, 9337–9345 (2005).
- (37) Mandre, S. K., Elsäßer, W., Fischer, I., Peeters, M., Verschaffelt, G. Evolution from modal to spatially incoherent emission of a broad-area VCSEL. Opt. Express, 16, 4452–4464 (2008).
- (38) Craggs, G., Verschaffelt, G., Mandre, S. K., Thienpont, H., Fischer, I. Thermally controlled onset of spatially incoherent emission in a broad-area vertical-cavity surface-emitting laser. IEEE J. Sel. Top. Quantum Electron., 15, 555–562 (2009).