Gradient-enhanced statistical analysis of cleavage fracture
Abstract
We present a probabilistic framework for brittle fracture that builds upon Weibull statistics and strain gradient plasticity. The constitutive response is given by the mechanism-based strain gradient plasticity theory, aiming to accurately characterize crack tip stresses by accounting for the role of plastic strain gradients in elevating local strengthening ahead of cracks. It is shown that gradients of plastic strain elevate the Weibull stress and the probability of failure for a given choice of the threshold stress and the Weibull parameters. The statistical framework presented is used to estimate failure probabilities across temperatures in ferritic steels. The framework has the capability to estimate the three statistical parameters present in the Weibull-type model without any prior assumptions. The calibration against experimental data shows important differences in the values obtained for strain gradient plasticity and conventional J2 plasticity. Moreover, local probability maps show that potential damage initiation sites are much closer to the crack tip in the case of gradient-enhanced plasticity. Finally, the fracture response across the ductile-to-brittle regime is investigated by computing the cleavage resistance curves with increasing temperature. Gradient plasticity predictions appear to show a better agreement with the experiments.
keywords:
Strain gradient plasticity , Weibull , Cleavage , Finite element analysis , Fracture1 Introduction
Macroscopic fracturing in metallic materials depends sensitively on properties that pertain to the micro and atomic scales. Not surprisingly, a considerable effort has been made to link scales in fracture mechanics, with the ultimate goal of quantitatively predicting the strength, durability, and reliability of structural components (Suo et al., 1993; Hutchinson, 1997). These
endeavours aim at spanning the wide range of scales at stake by enriching continuum theories to properly characterize behaviour at the small scales involved in crack tip deformation.
The deficiencies intrinsic to conventional plasticity theory provide a strong motivation for developing mechanistically-based models. Namely, unrealistically low stresses are predicted ahead of the crack tip, with toughness being unbounded for cohesive strengths of approximately 3 times the yield stress in a perfectly plastic material ( in a mild hardened solid, see Tvergaard and Hutchinson, 1992). Opening stresses on the order of 3-5 times the initial tensile yield stress fail to explain decohesion at the atomic scale. Cleavage fracture in the presence of significant plastic flow has been experimentally observed in numerous material systems (Elssner et al., 1994; Bagchi and Evans, 1996; Korn et al., 2002). Since atomic separation requires traction levels on the order of the theoretical lattice strength (10 or larger), classic continuum theories would appear to rule out a fracture mechanism based on atomic decohesion whenever plasticity develops in the vicinity of the crack. Moreover, conventional plasticity predictions reveal important discrepancies with separation strengths calculated from first principles (Raynolds et al., 1996), and toughness bounds attained by discrete dislocation dynamics (Cleveringa et al., 2000; Irani et al., 2017), highlighting the need to bridge the gap between macroscopic modelling of cracking and the microstructural and atomistic mechanisms of fracture.
Small scale experiments have consistently shown that conventional plasticity theory is unable to characterize the material response of metals at the micro level. Fostered by growing interest in microtechnology, a wide range of mechanical tests on micro-sized specimens have revealed that metallic materials display strong size effects when deformed non-uniformly into the plastic range. Experiments such as indentation (Nix and Gao, 1998), torsion (Fleck et al., 1994), or bending (Stölken and Evans, 1998) predict a 3-fold increase in the effective flow stress by reducing specimen size (smaller is stronger). This size effect is attributed to gradients of plastic strain that require a definite density of dislocations to accommodate lattice curvature (Ashby, 1970). These geometrically necessary dislocations (GNDs) are not accounted for in conventional theories of plasticity, neglecting the length scale dependency intrinsically associated with plastic flow. A large theoretical literature has appeared seeking to extend plasticity theory to small scales by the development of isotropic strain gradient plasticity (SGP) formulations (Aifantis, 1984; Gao et al., 1999; Fleck and Hutchinson, 2001; Anand et al., 2005). Using SGP theories to provide an implicit multi-scale characterization of the mechanical response ahead of a crack appears imperative as, independently of the size of the specimen, the plastic zone adjacent to the crack tip is physically small and contains strong spatial gradients of deformation (Martínez-Pañeda and Betegón, 2015). The investigation of stationary crack tip fields has shown that plastic strain gradients promote local strain hardening and lead to much higher stresses relative to classic plasticity predictions (Jiang et al., 2001; Wei, 2006; Komaragiri et al., 2008; Martínez-Pañeda
et al., 2017b). Accurately capturing crack tip stresses has proven to be fundamental in predicting fatigue damage (Gil-Sevillano, 2001; Brinckmann and Siegmund, 2008; Pribe et al., 2019), notch fracture mechanics (Martínez-Pañeda
et al., 2017a), microvoid cracking (Tvergaard and Niordson, 2008), and hydrogen assisted failure (Martínez-Pañeda
et al., 2016a, b). Since plastic strain gradients can alter crack tip stresses over several tens of m, it is expected that strain gradient plasticity models will also play an important role in the modelling of cleavage fracture and the ductile-to-brittle transition (Qian et al., 2011; Martínez-Pañeda et al., 2019).
Cleavage fracture models are grounded on the concept of microcracks nucleating from defects, such as inclusions or second-phase particles (Pineau et al., 2016). The location of these defects is statistical by nature and, consequently, modelling efforts rely mainly on probabilistic analysis. The seminal work by the Beremin group (Beremin, 1983) established the fundamental framework on which most cleavage models stand; Weibull statistics and the weakest link model are employed to estimate the probability of failure , where equals the probability of sampling (at least) one critical fracture-triggering particle. In these models the stress level is the driving force for fracture and, consequently, local strengthening due to plastic strain gradients will influence failure probability predictions.
In this work we make use of a mechanism-based strain gradient plasticity formulation to accurately characterize crack tip stresses. The constitutive description is coupled with a probabilistic framework capable of obtaining all the statistical parameters of the model without any prior assumptions. The capabilities of the present mechanism-based scheme for probabilistic analysis of brittle fracture are benchmarked against experimental data from the Euro toughness project (Heerens and Hellmann, 2002). Experiments are reproduced over a wide range of temperatures, so as to span the ductile-to-brittle regime. Strain gradient plasticity predictions are compared with results from conventional plasticity and insight is gained into the role of the stress elevation due to strain gradients in assessing cleavage.
2 Numerical model
The implicitly multi-scale statistical framework for brittle fracture presented stands on a Taylor-based strain gradient plasticity formulation (Section 2.1), and a three-parametric Weibull type statistical model (Section 2.2). The implementation is carried out by coupling a general purpose finite element program with the statistical tools of Matlab, see Section 2.3. A experimental campaign employing Compact Tension specimens will be reproduced to highlight the capabilities of the model (Section 2.4).
2.1 Mechanism-based Strain Gradient Plasticity
We model strain gradient effects by means of the so-called mechanism-based strain gradient (MSG) plasticity theory (Gao et al., 1999; Qiu et al., 2003). MSG plasticity is grounded on Taylor’s dislocation model. Accordingly, the shear flow stress is formulated in terms of the dislocation density as
| (1) |
where is the shear modulus, is the magnitude of the Burgers vector and is an empirical coefficient that is taken to be equal to 0.5. The dislocation density is additively composed of the density for statistically stored dislocations (SSDs) and the density for geometrically necessary dislocations (GNDs),
| (2) |
The GND density is related to the effective plastic strain gradient by
| (3) |
where is the Nye-factor which is assumed to be 1.90 for face-centered-cubic (fcc) polycrystals. Gao et al. (1999) used three quadratic invariants of the plastic strain gradient tensor to represent the effective plastic strain gradient as
| (4) |
The coefficients were determined to be equal to , and from three dislocation models for bending, torsion and void growth. Accordingly,
| (5) |
where the components of the strain gradient tensor are obtained from
| (6) |
The tensile flow stress is related to the shear flow stress by
| (7) |
with denoting the Taylor factor, which equals 3.06 for fcc metals. Rearranging (1-3) and substituting into (7) renders
| (8) |
The SSD density can be readily determined from (8) knowing the relation in uniaxial tension between the flow stress and the material stress-strain curve,
| (9) |
Here, is a reference stress and is a non-dimensional function of the plastic strain , as given by the uniaxial stress-strain curve. Substituting into (8), the flow stress reads
| (10) |
where is the intrinsic material length parameter that enters the constitutive equation for dimensional consistency. The value of can be obtained by fitting micro-scale experiments and typically ranges between 1 and 10 m. The model recovers the conventional plasticity solution when .
2.2 Weibull three-parametric
We present a statistical framework that has the capability of predicting brittle and ductile failure and requires no prior assumptions (Muñiz-Calvente et al., 2015; Papazafeiropoulos et al., 2017). First, for a given Weibull stress and a threshold stress for crack growth , the cumulative probability of failure is given by
| (11) |
where and respectively denote the scaling parameter and the modulus. Equation (11) is defined in (Beremin, 1983) without but stresses smaller than the yield stress were considered innocuous, implying the assumption of . A global Weibull stress is defined based on weakest link considerations
| (12) |
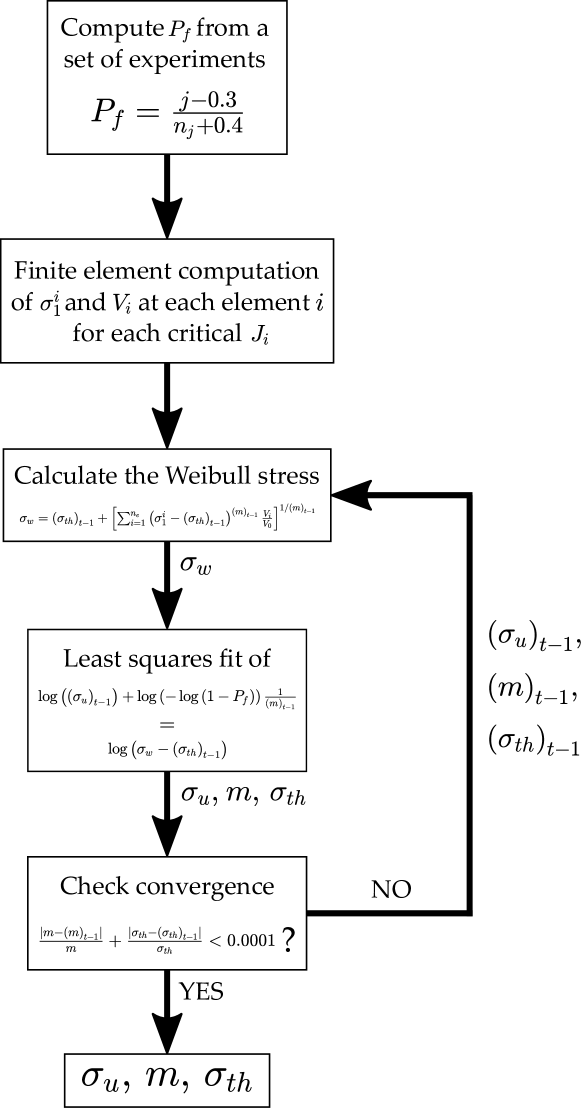
Here is a reference volume, is the volume of the ith material unit in the fracture process zone experiencing a maximum principal stress , and is the number of finite elements/material units in the fracture process zone. The parameter is needed due to the fact that cracks do not propagate below a certain threshold energy value. However, the concurrent estimation of the threshold, modulus and shape parameters remains a complicated task; a common approach lies in assuming a value for and estimating and from a set of experiments by means of the maximum likelihood method (Muniz-Calvente et al., 2016). Here, all three parameters (, and ) will be obtained by means of the following procedure: (see Fig. 1)
1) First, the probability of failure is computed for all the experiments conducted at a given temperature. The versus load curve, where the load is expressed in terms of the -integral, is computed by means of
| (13) |
where denotes the number of experiments for a given temperature and is the rank number.
2) A finite element analysis is conducted, and the values of and are computed at each element for the set of critical at which failure has been reported in the experiments. The domain integral method is used to compute the value of in each load increment.
3) The least squares method is employed to fit the Weibull distribution by using cumulative probabilities. Since the threshold parameter is also an unknown, the procedure requires iterating over the following steps:
3.1) The Weibull stress is first computed according to (12) from the information provided by the finite element model (Step 2). In (12), and correspond to the values of the previous iteration (or an initial estimate, in the case of the first iteration).
3.2) The Weibull stress is introduced in (11) and the values of , and in the current iteration are computed by fitting a univariate distribution using least squares estimates of the cumulative distribution functions. Namely, the cumulative probability of failure (11) is written as,
| (14) |
introducing a linear relationship between and . From the assigned to each load (Step 1) and the Weibull stress computed for each of those loads (Step 2), we make use of least squares to fit this straight line on the transformed scale. The slope and intercept of the line provide with the values of and for a given . The quality of the fit will be given by the choice of ; we find the optimum by maximizing the coefficient of determination over all possible threshold values. The optimum value of is specific to the current iteration and associated values of and .
3.3) The procedure is repeated until convergence is achieved. We assume that the solution has converged when the following criterion has been met
| (15) |
where denotes the value of in the current increment while the subscript represents its value in the previous increment. Consequently, the outcome of the analysis is the threshold value below which cracking will not occur , along with the two Weibull parameters and . A stress level of will denote a 63% failure probability in a given material unit element.
2.3 Numerical implementation
The framework presented in Sections 2.1 and 2.2 is numerically implemented by exploiting Abaqus2Matlab (Papazafeiropoulos et al., 2017). Hence, we run the commercial finite element package Abaqus within the mathematical software Matlab to take advantage of Matlab’s in-built capabilities for fitting univariate distributions by means of the least squares method.
We implement MSG plasticity in the commercial finite element package Abaqus by means of a user material subroutine (UMAT). For numerical reasons, we make use of the lower order version of MSG plasticity, commonly referred as the conventional mechanism based strain gradient (CMSG) plasticity theory (Huang et al., 2004). As shown in (Martínez-Pañeda and Niordson, 2016) and discussed in (Shi et al., 2001), the lower and higher order versions of MSG plasticity predict identical results except for a boundary layer of size roughly 10 nm. This boundary layer falls outside of the domain of physical validity of continuum theories; strain gradient plasticity models a collective behaviour of dislocations and it is therefore applicable at a scale much larger than the dislocation spacing. Fortran modules are used to store the plastic strain components across Gauss integration points, and the plastic strain gradient is computed by numerical differentiation within the element. First, the plastic strain increment is interpolated through its values at the Gauss points in the isoparametric space, and afterwards the increment in the plastic strain gradient is calculated by differentiation of the shape functions. The reader is referred to (Martínez-Pañeda et al., 2017a) for more details.
2.4 Boundary value problem
We employ our framework to assess brittle failure in ferritic steels. Numerical predictions are compared to experimental results from the Euro toughness project on DIN 22NiMoCr37 steel (Heerens and Hellmann, 2002). The Euro toughness project is frequently chosen as paradigmatic benchmark for cleavage models due to the richness of its data set. Experiments are conducted at 7 temperatures, from C to C, spanning the entire transition from brittle to ductile fracture.
Mimicking the experimental campaign, we model a compact tension specimen of width mm, distance between pins mm and initial notch length mm, referred to as size 2T in (Heerens and Hellmann, 2002). The finite element model includes the compact tension specimen and the pins. The load is prescribed by imposing a displacement on the pins, and we model contact between the pins and the specimen by using a surface to surface contact algorithm with finite sliding. The path independent -integral is computed outside of the plastic zone by means of the domain integral method at each load increment. An initial blunting radius of 2 m is defined at the crack tip. After a mesh sensitivity analysis, the specimen is discretized with 9800 quadrilateral quadratic plane strain elements. As shown in Fig. 2, a very refined mesh is used near the crack tip so as to accurately capture the influence of plastic strain gradients.

3 Results
We begin our analysis by investigating the stress elevation of strain gradient plasticity and its influence on the Weibull stress distribution (Section 3.1). Then, we calibrate the Weibull parameters for each temperature and assess the probability of failure due to cleavage with both conventional and MSG plasticity theories (Section 3.2). Section 3.3 explores the response across temperatures aiming to gain insight into the role of plastic strain gradients in the ductile-to-brittle transition.
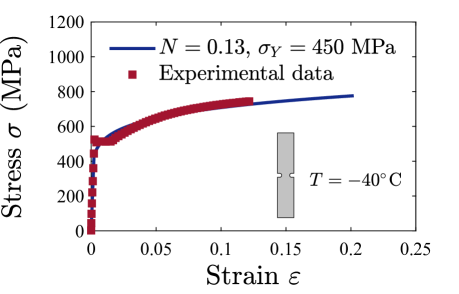
First, we define our uniaxial stress-strain hardening law as
| (16) |
where is the strain hardening exponent. Thus, in (10), the reference stress equals and . Here, Young’s modulus takes the value GPa, and Poisson’s ratio equals . We proceed to calibrate and with the uniaxial stress-strain data available as part of the Euro toughness data set (Heerens and Hellmann, 2002). The values of yield stress and strain hardening exponent obtained at each temperature are listed in Table 1. A representative fit is shown in Fig. 3(a) for the case of a temperature of C. As shown in Table 1, both and decrease with increasing temperature, in agreement with expectations. One should note that the length scale parameter of MSG plasticity has shown a negligible sensitivity to changes in temperature, as measured by Qian et al. (2014) through nanoindentation. Hence, we consider an intermediate value of m for all temperatures (Martínez-Pañeda and Niordson, 2016).
| Temperature () | -154 | -91 | -60 | -40 | -20 | 0 | 20 |
|---|---|---|---|---|---|---|---|
| Yield stress (MPa) | 570 | 490 | 470 | 450 | 440 | 430 | 425 |
| Strain hardening exponent | 0.14 | 0.14 | 0.13 | 0.13 | 0.13 | 0.12 | 0.12 |
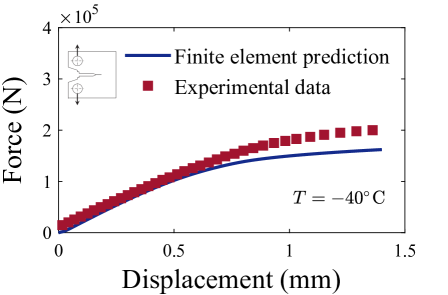
The computation of the force versus displacement curves from the calibrated values of and shows a good agreement with the experimental data. The results obtained for the representative case of C are shown in Fig. 3(b). The influence of the plastic strain gradients is restricted to a small region next to the crack tip and, consequently, the macroscopic force versus displacement curve is almost insensitive to in the absence of damage. Locally, crack tip stresses are however very sensitive to local strengthening due to gradients of plastic strain.
3.1 Gradient effects on crack tip stresses
We examine first the tensile stress distribution ahead of the crack for a representative case, C, and a specific load level that falls within the range of critical loads reported in the experiments, N/mm. Results are shown in Fig. 4 for both conventional and MSG plasticity with m. The tensile stress is normalized by the yield strength of the material at C, and the distance ahead of the crack is shown in logarithmic scale to highlight the different responses given by MSG and conventional plasticity theories. As shown in the figure, far away from the crack tip both MSG plasticity and conventional plasticity agree but differences start at about 20-30 m ahead of the crack. This distance is sufficiently large to engulf the critical length of various damage mechanisms, including cleavage in ferritic steels. The stress elevation due to plastic strain gradients is associated to large geometrically necessary dislocation (GND) densities that act as obstacles to the motion of statistically stored dislocations and elevate local strength.

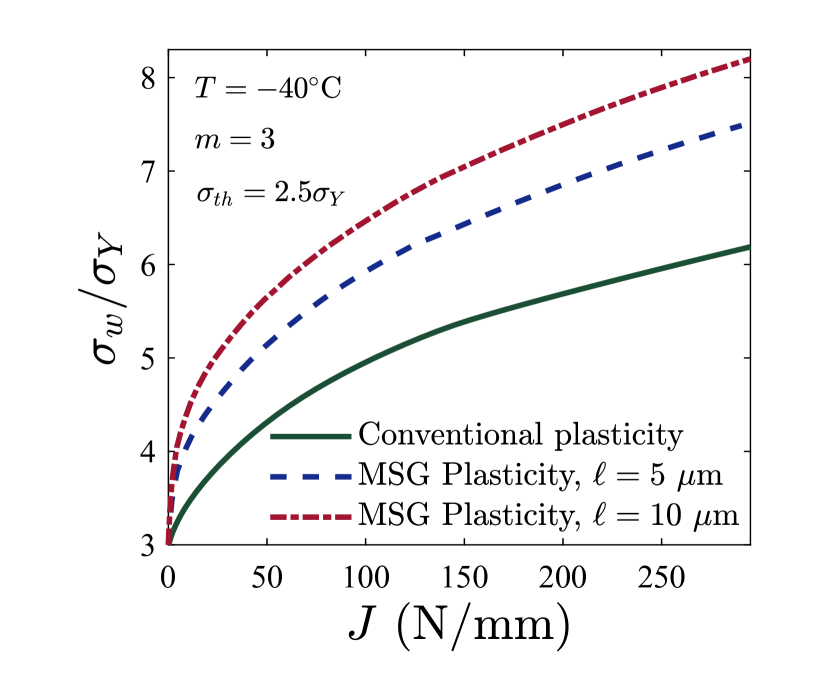
The stress elevation associated with large gradients of plastic strain in the vicinity of a crack influences cleavage models by elevating the Weibull stress . We illustrate this by assuming and and computing the Weibull stress through (12) as a function of the remote load. Results are shown in Fig. 5 for two representative values of the length scale parameter m and m, as well as for conventional plasticity. As shown in the figure, the Weibull stress increases with increasing and differences increase with the remote load. As we shall show below, differences are sensitive to the values of and , and the gradient-enhanced elevation can be substantial. Note that, following (11), strain gradient plasticity elevates the local probability of failure for a fixed value of , and .
3.2 Statistical analysis of cleavage
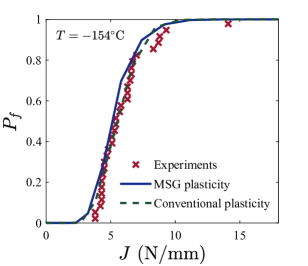
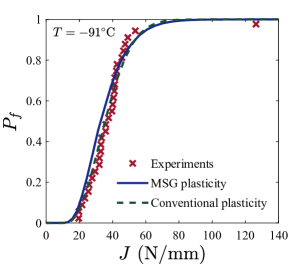
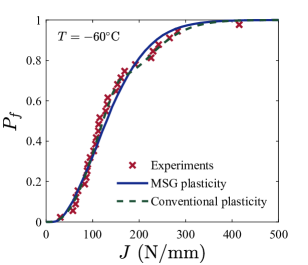
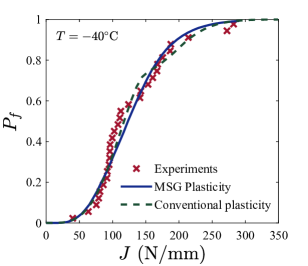
The statistical framework outlined in Section 2 is now employed to estimate the probability of failure as a function of the remote load, as quantified by . Fig. 6(b) shows the results obtained for 4 representative temperatures, C, C, C and C. The figure shows the experimental predictions, as given by (13), along with the results for MSG plasticity with m and conventional J2 plasticity. Both conventional and MSG plasticity predictions exhibit good agreement with the experiments for the calibrated Weibull parameters.
The calibrated values of the modulus , the threshold stress for crack growth , and the scaling parameter are shown in Table 2. Results are shown for 7 temperatures and both strain gradient and conventional plasticity. Considering the effect of plastic strain gradients leads to very significant differences in the values of the calibrated Weibull parameters. Differences between conventional and MSG plasticity are particularly notable in regards to the stress threshold for crack growth ; much larger stresses are needed to propagate micro-cracks if the influence of GNDs is accounted for. Furthermore, qualitative differences are observed in the dependence of the threshold stress with temperature. While the strain gradient plasticity-based prediction exhibits the natural trend of decreasing with decreasing (the material anticipates a reduced barrier to cleavage), this is not the case for conventional plasticity. A plausible explanation behind the scatter observed lies on the fact that the maximum tensile stress is load-independent in conventional plasticity (McMeeking, 1977); for lower temperatures, a higher stress level is attained for the same as is larger. Contrarily, in strain gradient plasticity, crack tip stresses scale with the remote load (Martínez-Pañeda and Fleck, 2019).
In addition, the conventional plasticity results show noticeably high predictions for at temperatures -60∘C and -40∘C. For these two temperatures, there is a clear change in the shape of the versus curve for values of close to 0.75. Reducing the tolerance of the convergence criterion or changing the initial estimations of and did not have any influence in the outcome of the statistical fitting procedure. Moreover, very similar results were obtained when repeating the procedure with specimens of different geometry; referred to as 0.5T and 1T in (Heerens and Hellmann, 2002). The uniqueness of the Weibull parameters (see, e.g., Ruggieri et al., 2000) is addressed by repeating the analysis for four different geometries (0.5, 1T, 2T and 4T) and two temperatures (-91∘C and -20∘C). Computations reveal very similar values of , and to those shown in Table 2 for both conventional and strain gradient plasticity. Differences are largest with geometry 4T but remain below 10% in all cases.
| MSG plasticity | |||||||
| Temperature () | -154 | -91 | -60 | -40 | -20 | 0 | 20 |
| (MPa) | 23.6 | 46.9 | 632.3 | 611.7 | 1060.4 | 183.0 | 16948.0 |
| (MPa) | 5489.3 | 7295.1 | 7670.6 | 8136.7 | 8295.9 | 19888.0 | 13516.0 |
| 2.0 | 1.9 | 2.9 | 3.1 | 3.2 | 1.7 | 12.71 | |
| Conventional plasticity | |||||||
| Temperature () | -154 | -91 | -60 | -40 | -20 | 0 | 20 |
| (MPa) | 9.2 | 14.9 | 1380.4 | 911.3 | 146.0 | 46.11 | 1731.7 |
| (MPa) | 2251.7 | 2459.0 | 1015.7 | 1477.5 | 2289.1 | 2205.0 | 1474.7 |
| 1.9 | 1.8 | 13.5 | 12.8 | 3.2 | 0.78 | 19.87 |
More insight into the influence of plastic strain gradients on local failure probability can be gained by means of a hazard map. In a hazard map, the local probability of failure is shown over the entire engineering component, highlighting the areas that are vulnerable to a specific type of failure (Muñiz-Calvente et al., 2016). The local probability of failure is computed as in each material unit from a local . The results obtained are shown in log scale in Fig. 7 for both conventional and strain gradient plasticity. Important differences can be readily observed. While the local only becomes meaningful close to the crack tip in both cases, the potential damage initiation sites are identified to be much more localized for the case of strain gradient plasticity. In other words, only defects within tens of microns, as opposed to several mm, are identified as fracture-triggering particles when plastic strain gradients are accounted for. The critical distance for cleavage fracture in steels is considered to be significantly smaller than 1 mm (Watanabe et al., 1987).

3.3 The ductile to brittle transition
We then proceed to examine the ductile-to-brittle transition by computing the resistance curves for , 0.5 and 1 across the temperature versus load map. For each value of three curves are shown, the experimental data and the numerically computed results for MSG plasticity and conventional J2 plasticity; see Fig. 8. The results show how the load at which failure is predicted, , increases with the temperature - ductility is enhanced. As the load and the temperature increase, ductile crack growth is observed, with the largest temperatures showing several cases where crack extension equals mm, the limit value for ductile growth tests (Heerens and Hellmann, 2002). In addition, the gradient-enhanced prediction appears to follow more precisely the experimental trend.

3.4 Influence of crack tip constraint conditions
Lastly, we investigate the influence of crack tip constraint conditions by imposing a non-zero elastic T-stress (Betegón and Hancock, 1991). This is achieved by means of the so-called modified boundary layer formulation. Consider a crack plane aligned with the negative axis of the Cartesian reference frame (, ). For a crack tip placed at the origin and a given T value, we choose to prescribe a remote mode I load, , by defining the nodal displacements in the outer periphery of the mesh as
| (17) |
| (18) |
where and are polar coordinates centred at the crack tip. As shown in Fig. 9, upon exploiting symmetry about the crack plane, only half of the model is analysed. We introduce an initial blunting radius that is 105 times smaller than the outer radius. The modified boundary layer model is discretized by means of 6422 quadrilateral quadratic plane strain elements.

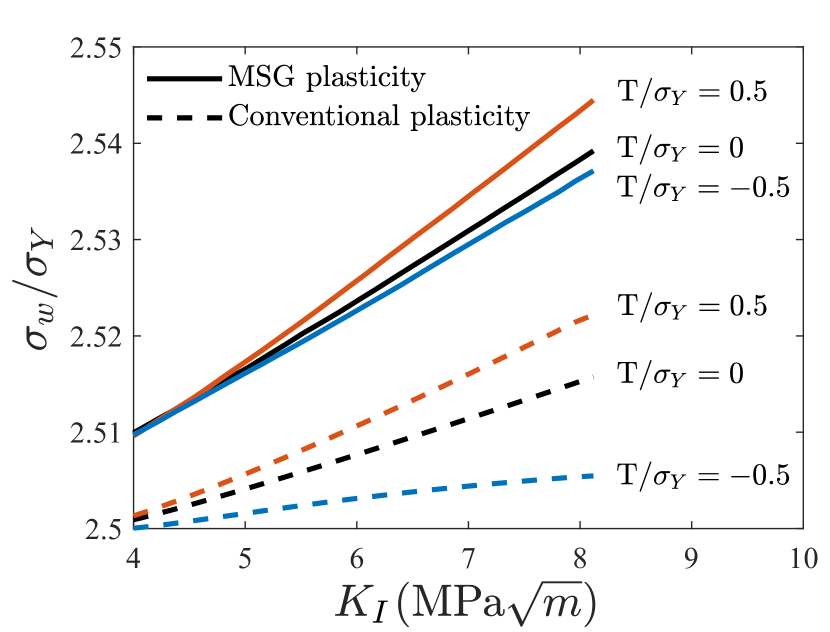
The results obtained, in terms of Weibull stress versus remote load are shown in Fig. 10. As in Fig. 5, we consider a temperature of C and assume and . A range of 3 values of the T-stress is considered: T, T,and T. The same qualitative trends are obtained for both conventional plasticity and strain gradient plasticity; for a given remote load , the Weibull stress increases with increasing T. However, conventional plasticity predictions of appear to exhibit a higher sensitivity to crack tip constraint conditions for the values of and assumed.
4 Conclusions
We have presented a 3-parameter statistical framework for cleavage that incorporates the role of large plastic strain gradients in the characterization of crack tip stresses. The model enables to accurately compute Weibull stresses and calibrate - without any prior assumptions - the three statistical parameters: threshold stress , scaling parameter and modulus . Finite element analysis is used in combination with Weibull statistics to investigate cleavage in ferritic steels with both conventional J2 plasticity and the mechanism-based strain gradient (MSG) plasticity theory. The main findings are:
i) For given values of , and , strain gradient plasticity effects elevate the Weibull stress and the probability of failure.
ii) The calibrated Weibull parameters for MSG plasticity show significant differences with the values obtained with conventional plasticity. The threshold stress required to trigger cracking in the gradient-enhanced case is 2-8 times larger than its conventional plasticity counterpart.
iii) Hazard maps, where the probability of failure is shown in each material unit, show that defects susceptible of initiating cracking are confined in a much smaller region next to the crack tip in the strain gradient plasticity case.
iv) The probability of failure is computed across the ductile-to-brittle transition, with strain gradient plasticity predictions showing a better agreement with experiments.
5 Acknowledgements
The authors acknowledge valuable discussions with M. Muñiz-Calvente (University of Oviedo). The authors would like to acknowledge financial support from the Ministry of Economy and Competitiveness of Spain through grant MAT2014-58738-C3. E. Martínez-Pañeda additionally acknowledges financial support from Wolfson College Cambridge (Junior Research Fellowship) and from the Royal Commission for the 1851 Exhibition through their Research Fellowship programme (RF496/2018).
References
- Aifantis (1984) Aifantis, E. C., 1984. On the Microstructural Origin of Certain Inelastic Models. Journal of Engineering Materials and Technology 106 (4), 326.
- Anand et al. (2005) Anand, L., Gurtin, M. E., Lele, S. P., Gething, C., 2005. A one-dimensional theory of strain-gradient plasticity: Formulation, analysis, numerical results. Journal of the Mechanics and Physics of Solids 53 (8), 1789–1826.
- Ashby (1970) Ashby, M. F., 1970. The deformation of plastically non-homogeneous materials. Philosophical Magazine 21 (170), 399–424.
- Bagchi and Evans (1996) Bagchi, A., Evans, A. G., 1996. The Mechanics and Physics of Thin-Film Decohesion and Its Measurement. Interface Science 3, 169–193.
- Beremin (1983) Beremin, F. M., 1983. A local criterion for cleavage fracture of a nuclear pressure vessel steel. Metallurgical Transactions A 14 (11), 2277–2287.
- Betegón and Hancock (1991) Betegón, C., Hancock, J. W., 1991. Two-Parameter Characterization of Elastic-Plastic Crack-Tip Fields. Journal of Applied Mechanics 58 (1), 104–110.
- Brinckmann and Siegmund (2008) Brinckmann, S., Siegmund, T., 2008. Computations of fatigue crack growth with strain gradient plasticity and an irreversible cohesive zone model. Engineering Fracture Mechanics 75 (8), 2276–2294.
- Cleveringa et al. (2000) Cleveringa, H., Van der Giessen, E., Needleman, A., 2000. A discrete dislocation analysis of mode I crack growth. Journal of the Mechanics and Physics of Solids 48 (6–7), 1133–1157.
- Elssner et al. (1994) Elssner, G., Korn, D., Rühle, M., 1994. The influence of interface impurities on fracture energy of UHV diffusion bonded metal-ceramic bicrystals. Scripta Metallurgica et Materiala 31 (8), 1037–1042.
- Fleck and Hutchinson (2001) Fleck, N. A., Hutchinson, J. W., 2001. A reformulation of strain gradient plasticity. Journal of the Mechanics and Physics of Solids 49 (10), 2245–2271.
- Fleck et al. (1994) Fleck, N. A., Muller, G. M., Ashby, M. F., Hutchinson, J. W., 1994. Strain gradient plasticity: Theory and Experiment. Acta Metallurgica et Materialia 42 (2), 475–487.
- Gao et al. (1999) Gao, H., Hang, Y., Nix, W. D., Hutchinson, J. W., 1999. Mechanism-based strain gradient plasticity - I. Theory. Journal of the Mechanics and Physics of Solids 47 (6), 1239–1263.
- Gil-Sevillano (2001) Gil-Sevillano, J., 2001. The effective threshold for fatigue crack propagation: A plastic size effect? Scripta Materialia 44 (11), 2661–2665.
- Heerens and Hellmann (2002) Heerens, J., Hellmann, D., 2002. Development of the Euro fracture toughness dataset. Engineering Fracture Mechanics 69 (4), 421–449.
- Huang et al. (2004) Huang, Y., Qu, S., Hwang, K. C., Li, M., Gao, H., Huang, Y., Qu, S., Hwang, K. C., Li, M., Gao, H., 2004. A conventional theory of mechanism-based strain gradient plasticity. International Journal of Plasticity 20 (4-5), 753–782.
- Hutchinson (1997) Hutchinson, J. W., 1997. Linking scales in fracture mechanics. Advances in Fracture Research, Proceedings of ICF10, 1 – 14.
- Irani et al. (2017) Irani, N., Remmers, J. J. C., Deshpande, V. S., 2017. A discrete dislocation analysis of hydrogen-assisted mode-I fracture. Mechanics of Materials 105, 67–79.
- Jiang et al. (2001) Jiang, H., Huang, Y., Zhuang, Z., Hwang, K. C., 2001. Fracture in mechanism-based strain gradient plasticity. Journal of the Mechanics and Physics of Solids 49 (5), 979–993.
- Komaragiri et al. (2008) Komaragiri, U., Agnew, S. R., Gangloff, R. P., Begley, M. R., 2008. The role of macroscopic hardening and individual length-scales on crack tip stress elevation from phenomenological strain gradient plasticity. Journal of the Mechanics and Physics of Solids 56 (12), 3527–3540.
- Korn et al. (2002) Korn, D., Elssner, G., Cannon, R. M., Ruhle, M., 2002. Fracture properties of interfacially doped Nb-A12O3 bicrystals: I, fracture characteristics. Acta Materialia 50 (15), 3881–3901.
- Martínez-Pañeda and Betegón (2015) Martínez-Pañeda, E., Betegón, C., 2015. Modeling damage and fracture within strain-gradient plasticity. International Journal of Solids and Structures 59, 208–215.
- Martínez-Pañeda et al. (2017a) Martínez-Pañeda, E., del Busto, S., Betegón, C., 2017a. Non-local plasticity effects on notch fracture mechanics. Theoretical and Applied Fracture Mechanics 92, 276–287.
- Martínez-Pañeda et al. (2016a) Martínez-Pañeda, E., del Busto, S., Niordson, C. F., Betegón, C., 2016a. Strain gradient plasticity modeling of hydrogen diffusion to the crack tip. International Journal of Hydrogen Energy 41 (24), 10265–10274.
- Martínez-Pañeda et al. (2019) Martínez-Pañeda, E., Deshpande, V. S., Niordson, C. F., Fleck, N. A., 2019. The role of plastic strain gradients in the crack growth resistance of metals. Journal of the Mechanics and Physics of Solids 126, 136–150.
- Martínez-Pañeda and Fleck (2019) Martínez-Pañeda, E., Fleck, N. A., 2019. Mode I crack tip fields: Strain gradient plasticity theory versus J2 flow theory. European Journal of Mechanics - A/Solids 75, 381–388.
- Martínez-Pañeda et al. (2017b) Martínez-Pañeda, E., Natarajan, S., Bordas, S., 2017b. Gradient plasticity crack tip characterization by means of the extended finite element method. Computational Mechanics 59, 831–842.
- Martínez-Pañeda and Niordson (2016) Martínez-Pañeda, E., Niordson, C. F., 2016. On fracture in finite strain gradient plasticity. International Journal of Plasticity 80, 154–167.
- Martínez-Pañeda et al. (2016b) Martínez-Pañeda, E., Niordson, C. F., Gangloff, R. P., 2016b. Strain gradient plasticity-based modeling of hydrogen environment assisted cracking. Acta Materialia 117, 321–332.
- McMeeking (1977) McMeeking, R. M., 1977. Finite deformation analysis of crack-tip opening in elastic-plastic materials and implications for fracture. Journal of the Mechanics and Physics of Solids 25 (5), 357–381.
- Muñiz-Calvente et al. (2015) Muñiz-Calvente, M., Fernández Canteli, A., Shlyannikov, V., Castillo, E., 2015. Probabilistic Weibull Methodology for Fracture Prediction of Brittle and Ductile Materials. Applied Mechanics and Materials 784 (2), 443–451.
- Muniz-Calvente et al. (2016) Muniz-Calvente, M., Ramos, A., Pelayo, F., Lamela, M. J., Fernández-Canteli, A., 2016. Statistical joint evaluation of fracture results from distinct experimental programs: An application to annealed glass. Theoretical and Applied Fracture Mechanics 85, 149–157.
- Muñiz-Calvente et al. (2016) Muñiz-Calvente, M., Ramos, A., Shlyannikov, V., Lamela, M. J., Fernández-Canteli, A., 2016. Hazard maps and global probability as a way to transfer standard fracture results to reliable design of real components. Engineering Failure Analysis 69, 135–146.
- Nix and Gao (1998) Nix, W. D., Gao, H. J., 1998. Indentation size effects in crystalline materials: A law for strain gradient plasticity. Journal of the Mechanics and Physics of Solids 46 (3), 411–425.
- Papazafeiropoulos et al. (2017) Papazafeiropoulos, G., Muñiz-Calvente, M., Martínez-Pañeda, E., 2017. Abaqus2Matlab: A suitable tool for finite element post-processing. Advances in Engineering Software 105, 9–16.
- Pineau et al. (2016) Pineau, A., Benzerga, A. A., Pardoen, T., 2016. Failure of metals I: Brittle and ductile fracture. Acta Materialia 107, 424–483.
- Pribe et al. (2019) Pribe, J. D., Siegmund, T., Tomar, V., Kruzic, J. J., 2019. Plastic strain gradients and transient fatigue crack growth: a computational study. International Journal of Fatigue 120, 283–293.
- Qian et al. (2011) Qian, X., Zhang, S., Swaddiwudhipong, S., 2011. Calibration of Weibull parameters using the conventional mechanism-based strain gradient plasticity. Engineering Fracture Mechanics 78 (9), 1928–1944.
- Qian et al. (2014) Qian, X., Zhang, S., Swaddiwudhipong, S., Shen, L., 2014. Temperature dependence of material length scale for strain gradient plasticity and its effect on near-tip opening displacement. Fatigue and Fracture of Engineering Materials and Structures 37 (2), 157–170.
- Qiu et al. (2003) Qiu, X., Huang, Y., Wei, Y., Gao, H., Hwang, K., 2003. The flow theory of mechanism-based strain gradient plasticity. Mechanics of Materials 35 (3-6), 245–258.
- Raynolds et al. (1996) Raynolds, J. E., Smith, J. R., Zhao, G. L., Srolovitz, D. J., 1996. Adhesion in NiAl-Cr from first principles. Physical Review B 53 (20), 13883–13890.
- Ruggieri et al. (2000) Ruggieri, C., Gao, X., Dodds, R. H., 2000. Transferability of elastic-plastic fracture toughness using the Weibull stress approach: Significance of parameter calibration. Engineering Fracture Mechanics 67 (2), 101–117.
- Shi et al. (2001) Shi, M., Huang, Y., Jiang, H., Hwang, K. C., Li, M., 2001. The boundary-layer effect on the crack tip field in mechanism-based strain gradient plasticity. International Journal of Fracture 112 (1), 23–41.
- Stölken and Evans (1998) Stölken, J. S., Evans, A. G., 1998. A microbend test method for measuring the plasticity length scale. Acta Materialia 46 (14), 5109–5115.
- Suo et al. (1993) Suo, Z., Shih, C. F., Varias, A. G., 1993. A theory for cleavage cracking in the presence of plastic flow. Acta Metallurgica Et Materialia 41 (5), 1551–1557.
- Tvergaard and Hutchinson (1992) Tvergaard, V., Hutchinson, J. W., 1992. The relation between crack growth resistance and fracture process parameters in elastic-plastic solids. Journal of the Mechanics and Physics of Solids 40 (6), 1377–1397.
- Tvergaard and Niordson (2008) Tvergaard, V., Niordson, C. F., 2008. Size effects at a crack-tip interacting with a number of voids. Philosophical Magazine 88 (30-32), 3827–3840.
- Watanabe et al. (1987) Watanabe, J., Iwadate, T., Tanaka, Y., Yokobori, T., Ando, K., 1987. Fracture toughness in the transition region. Engineering Fracture Mechanics 28 (5-6), 589–600.
- Wei (2006) Wei, Y., 2006. A new finite element method for strain gradient theories and applications to fracture analyses. European Journal of Mechanics, A/Solids 25 (6), 897–913.