Polarization in caustic-crossing binary microlensing events
Abstract
Here, we revisit the polarization signal in caustic-crossing binary microlensing and introduce the maps of the polarization signals of the source star as a function of its position projected on the lens plane. The behavior of these maps depends on the source size in comparison with the caustic. If the source size is so smaller than the caustic curve, the maximum polarization signal occurs while the source edge is crossing the nearest folds to the position of the primary. When the source size is larger than the caustic, the polarization signal maximizes over a circular ring around the primary whose radius normalized to the source radius is . In cusp caustic crossings, the polarization curves have three peaks, the largest and widest one happens when the source edge is on the corner of the cusp and the source center is inside the caustic curve. When the source is entirely inside the caustic, the polarization signal significantly decreases. Despite the low magnification factor between two parts of planetary caustics, its polarization signal is considerable and can reach to for early-type stars. While crossing the connection line between different parts of caustic, the polarimetry curve have three close peaks that the middle one appears when the source center is upon the connection line.
keywords:
gravitational lensing: micro – techniques: polarimetric – methods: numerical.1 Introduction
Polarization of a light occurs when its electric field oscillates in a special plane instead of vibrating in all planes normal to the direction of its propagation. If an unpolarized light passes through a fluid, it will be partially or completely polarized owing to scattering processes (Chandrasekhar, 1960). If the size of the particles in the fluid is smaller than or in the order of the incoming wavelength, the state of material does not change, the so-called Rayleigh scattering, (see, e.g., Young, 1981). In this scattering process, the bound electron of a particle absorbs the energy of the interacting electromagnetic waves, but this energy is not sufficient to excite the electron. Hence, it vibrates parallel with the electric field direction (at the time of the collision) and propagates a light normal to its vibration direction. The scattered light will be polarized and its polarization value depends on the observer’s line of sight. Another type of scattering is Thomson scattering which is the elastic scattering of the electromagnetic radiation by a free and charged particle. The resulted radiation will be linearly polarized (see, e.g., Chen et al., 1998).
Both kinds of scattering take place in the stellar atmospheres. Their contributions depend on the stellar surface temperatures and the scattering species. In the stellar atmospheres, every point of the stellar surface has a different polarization value. At the center, there is no net polarization and at its edges the polarization maximizes. Generally, it depends on the angle between the observer’s line of sight and the normal to the stellar surface. If the source star is very far from us, we receive the integrated light of the source star which has no net polarization, because of the circular symmetry of the source surface. If this symmetry breaks, a net polarization signal is measurable. Gravitational microlensing breaks the circular symmetry of the source surface and causes a net polarization signal (Schneider & Wagoner, 1987; Simmons et al., 1995a, b; Bogdanov et al., 1996).
The polarization in microlensing events were studied in many references as a helpful tool to partially resolve the degeneracy in the microlensing parameters by measuring the source radius, the Einstein radius, etc. (see, e.g., Agol, 1996; Yoshida, 2006; Simmons et al., 2002). In microlensing events, the intrinsic polarization signals of the source stars which are mostly unmeasurable can be magnified and generate some perturbations in polarization curves. The intrinsic polarization signals are made by second-order perturbations, for instance the stellar magnetic fields and spots, circumstellar disks, close-in giant planets, etc., ( e.g., Sajadian, 2015; Sajadian & Rahvar, 2015; Sajadian & Hundertmark, 2017).
Polarization in binary microlensing events and in the fold caustic crossings was first analytically estimated by Schneider & Wagoner (1987). Then, Agol (1996) studied this subject and he noticed that the polarization signal of a lensed early-type source star during caustic crossings can reach to one percent. He discussed on the benefits of measuring the polarization signals during binary microlensing events of early-type source stars. The polarization curves for different types of source stars, several detected planetary microlensing events and the reported catalogue of single microlensing events by the Optical Gravitational Lensing Experiment collaboration (OGLE-III)(Wyrzykowski et al., 2015) were well investigated by Ingrosso et al. (2012); Ingrosso et al. (2015).
Here, we revisit the polarization in caustic-crossing microlensing events and introduce the maps of the polarization signals over the binary lens plane and study them. We consider one type of stars, i.e., hot and early-type stars, as the source stars and probe the source locations where the polarization signals maximize while passing from different caustic configurations. This study will be beneficial for potentially follow-up polarimetry observations of on-going binary and caustic-crossing microlensing events in near future. It helps to recognize the best candidates of on-going microlensing events for polarimetry observations. We expect to have similar polarization behaviors while caustic crossings for other types of source stars, e.g., main-sequence and red clump giant (RCG) stars, but with different scales. Indeed, the local and intrinsic polarization profiles over different types of stars are similar, i.e., they depends just on the source radius projected on sky plane and enhances while moving from the source center to its edges. We study the polarization maps and polarization curves in the fold and cusp caustic crossings, detailed in the section (2). We summarize the conclusions in the last section.
2 Polarization in binary microlensing
The value of the polarization signal in a microlensing event depends on (i) how much the circular symmetry of the source surface breaks, (ii) the intrinsic and local polarization of the source star which in turn depends on the scattering species and (iii) the source radius. Throughout the paper, we consider hot and early-type stars as sources. Noting that the different types of source stars have similar patterns of the local polarizations. Hence, we expect similar polarization behaviors but in different scales for different stellar types. In early-type stars with a free electron atmosphere, mostly Thomson scattering produces the polarization signal. Their local Stokes (total and polarized) intensities (Tinbergen, 1996) were first analytically evaluated by Chandrasekhar (1960) which can be estimated as:
| (1) |
where , is the radial position of each point over the stellar surface normalized to the stellar radius and projected on the sky plane and is the emergent radiative flux of the source star from its center. and are the so-called limb-darkening coefficients which were evaluated by Schneider & Wagoner (1987), based on the Chanrasekhar’s analytical solution of the radiative transfer equations in a plane-parallel atmosphere. In this work, we use these amounts throughout the paper.
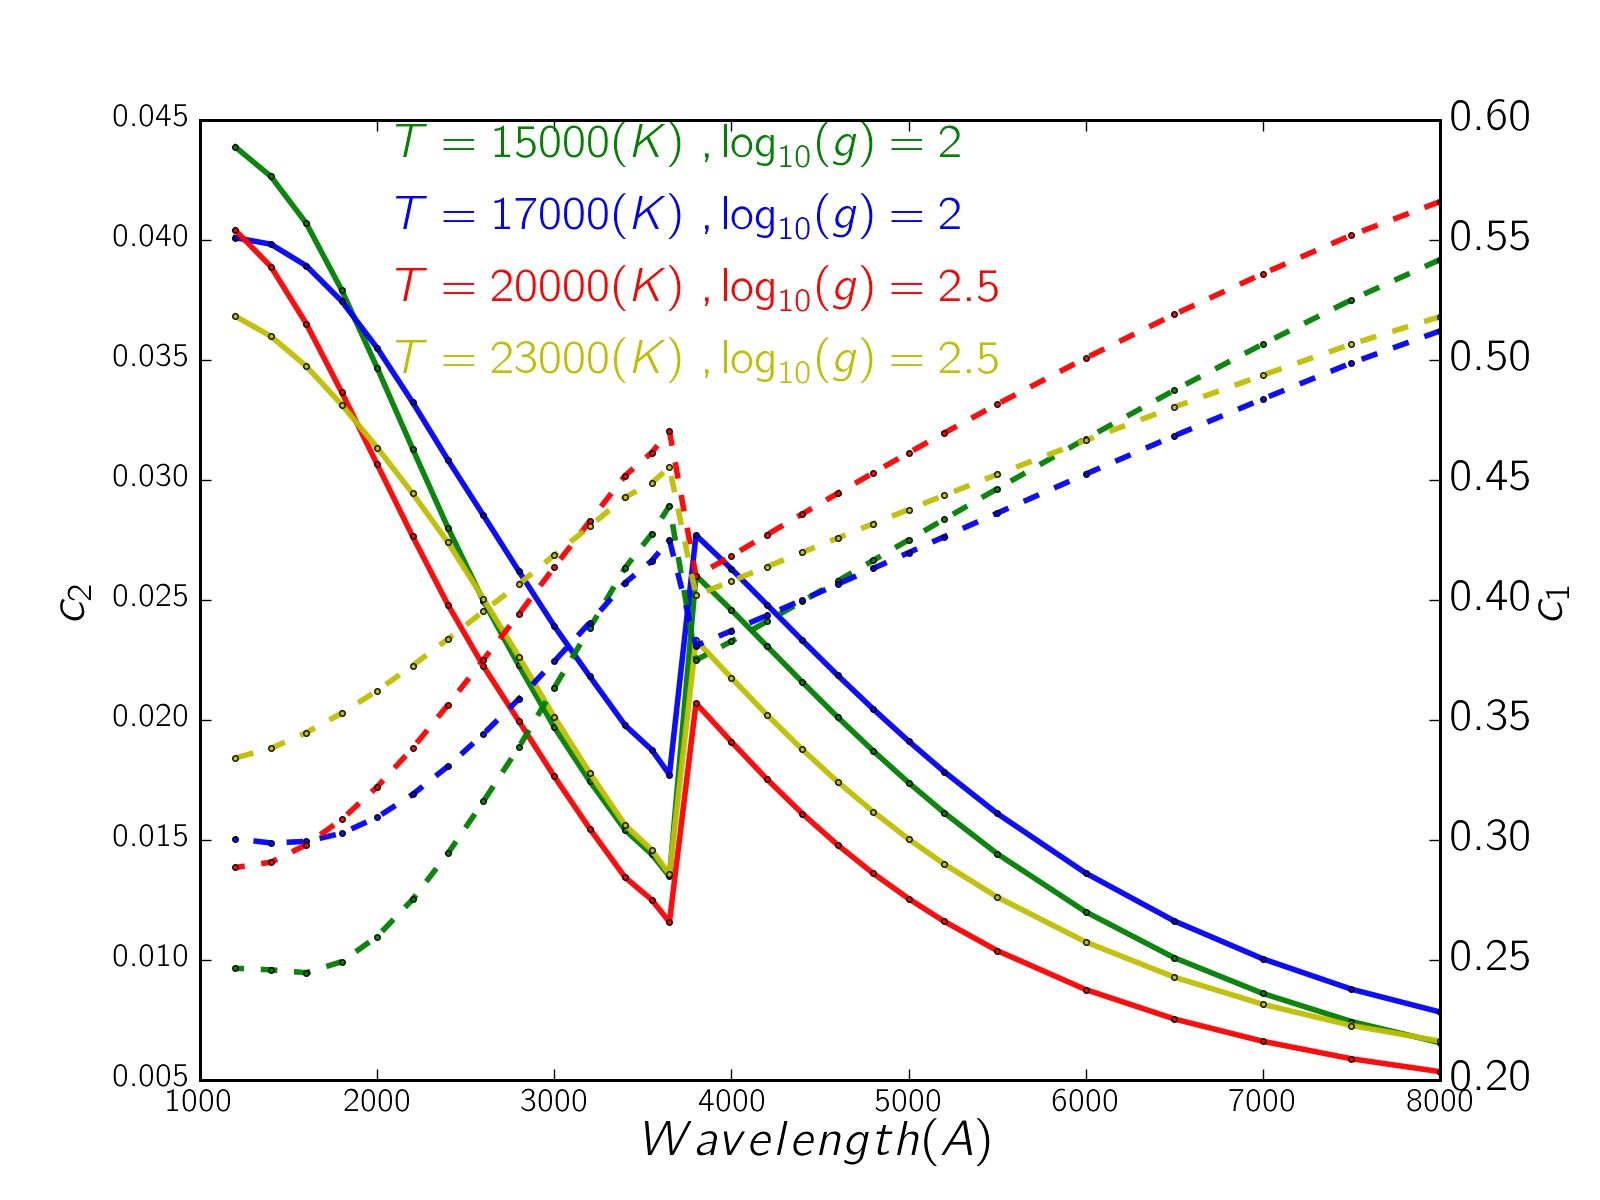
These limb-darkening coefficients generally depends on the wavelength, stellar surface temperature, its surface gravity and partly the stellar metalicity. These dependencies can be determined by numerically solving the radiative transfer equations in different models of stellar atmospheres. For instance, Harrington (2017) evaluated the monochromatic opacities and Stokes intensities for early-type stars 111https://www.astro.umd.edu/~jph/Stellar_Polarization.html, based on the NLTE code TLUSTY (Lanz & Hubeny, 2003, 2007) 222http://nova.astro.umd.edu/index.html. According to his results, we plot the limb-darkening coefficients, (dashed curves) and (solid curves), versus monochromatic wavelength for four stellar models with different surface temperatures and gravities in Figure (1). In these models, the metal abundance is the same as solar one. Accordingly, (unlike ) generally decreases in the larger wavelengths. Also, these values of limb-darkening coefficients are a bit smaller than those estimated based on the analytical solution of radiative transfer equations given by Chandrasekhar (1960). 333In order to estimate the limb-darkening coefficients in the standard filters, we integrated of the Stokes intensities over the bandwidths of Johnson-Cousins UBVRI photometric filters. In -band, and which are close to the analytical values, i.e., and .
In order to calculate the polarization signal during a microlensing event, we integrate the local polarized and total Stokes intensities (given by equations 2) over the star disk by considering the magnification factor as a weight function. More details can be found in many references, (see, e.g., Ingrosso et al., 2012). For calculating the magnification factor in binary microlensing events we use -model which was developed by V. Bozza444http://www.fisica.unisa.it/GravitationAstrophysics/RTModel.htm (Bozza et al., 2018; Bozza, 2010; Skowron & Gould, 2012). In this regard, we consider each element of the source disk as a point-like source. The number of elements depends on how much the source center is close to the caustic line.
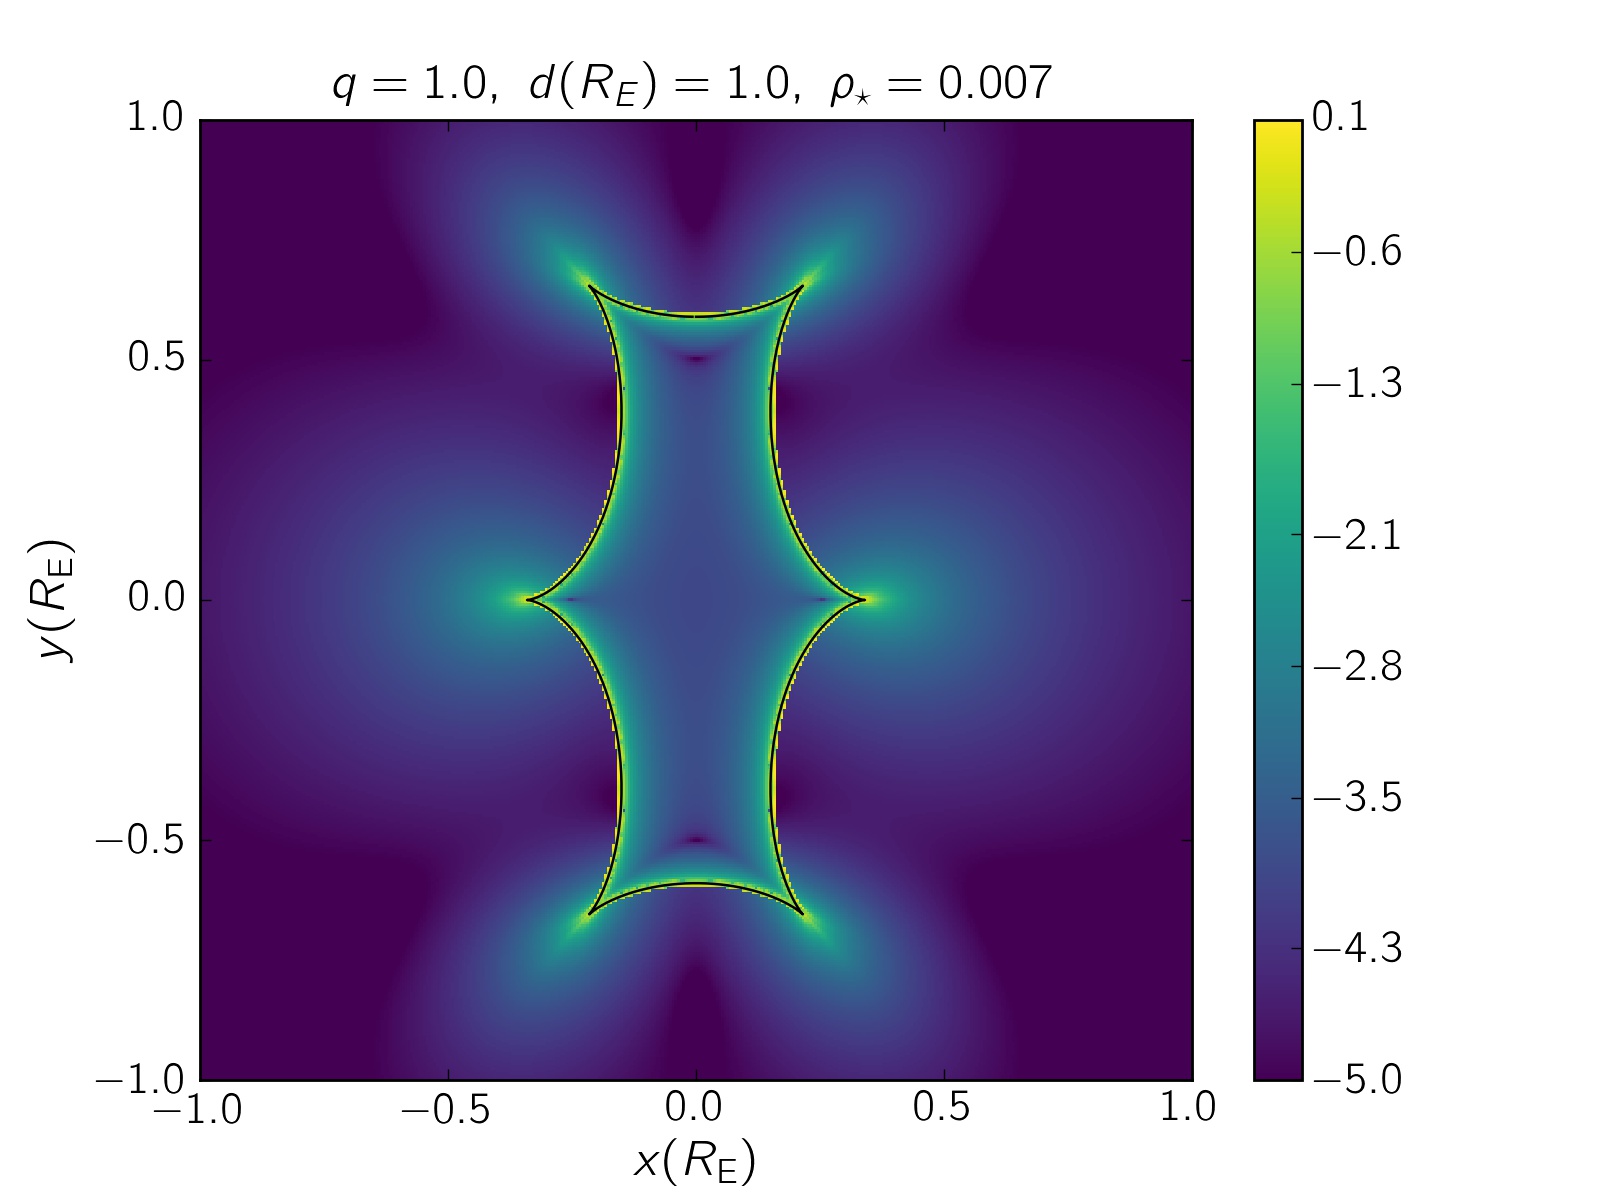
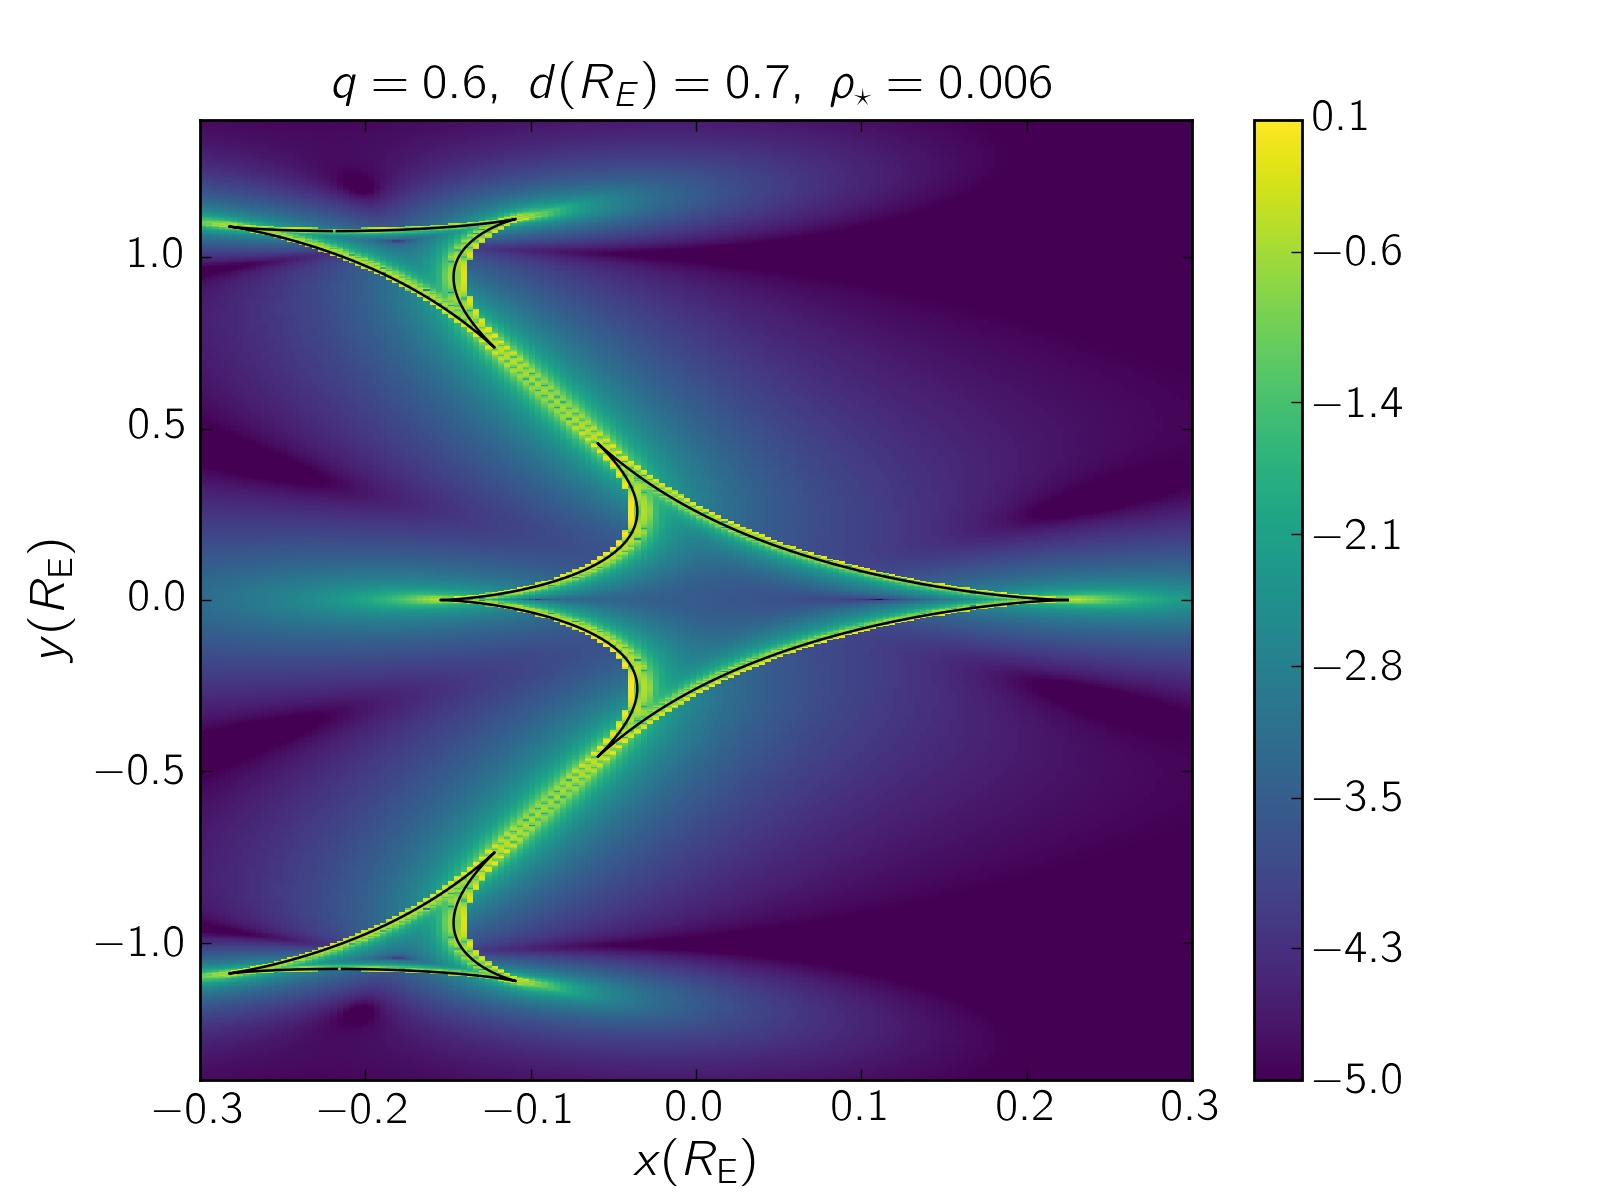
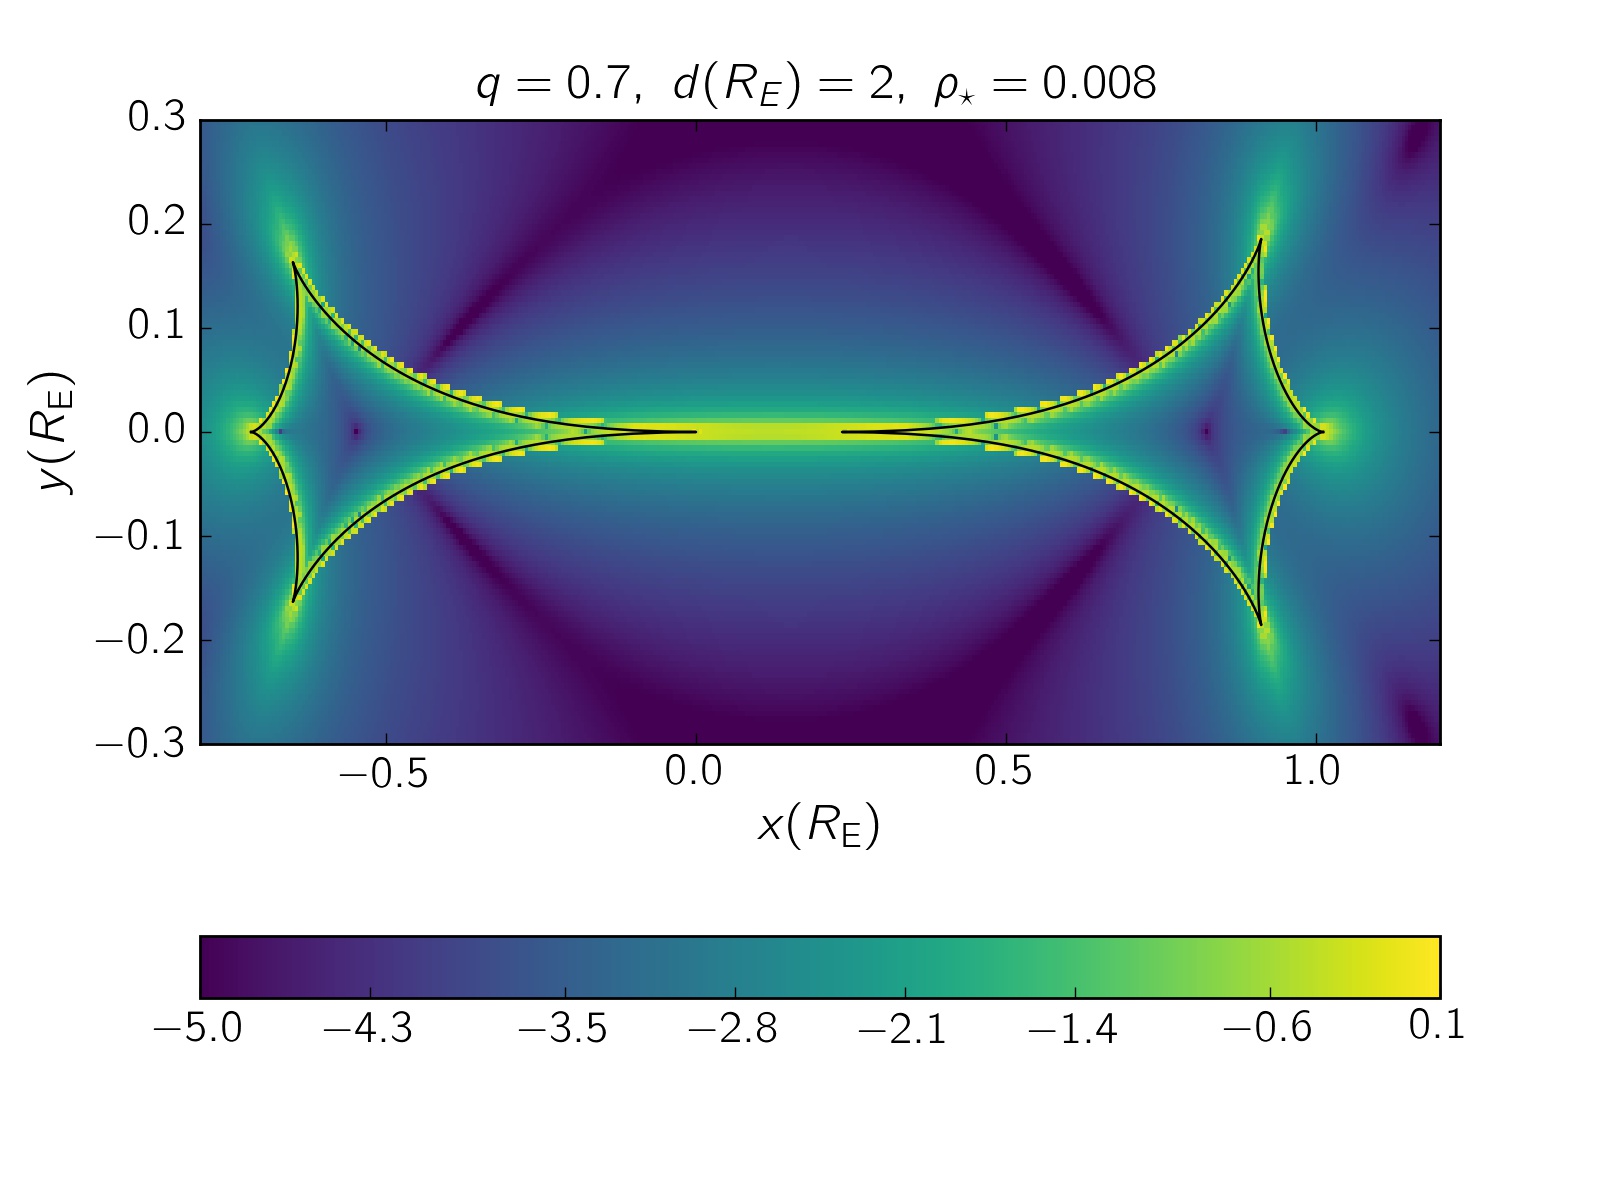
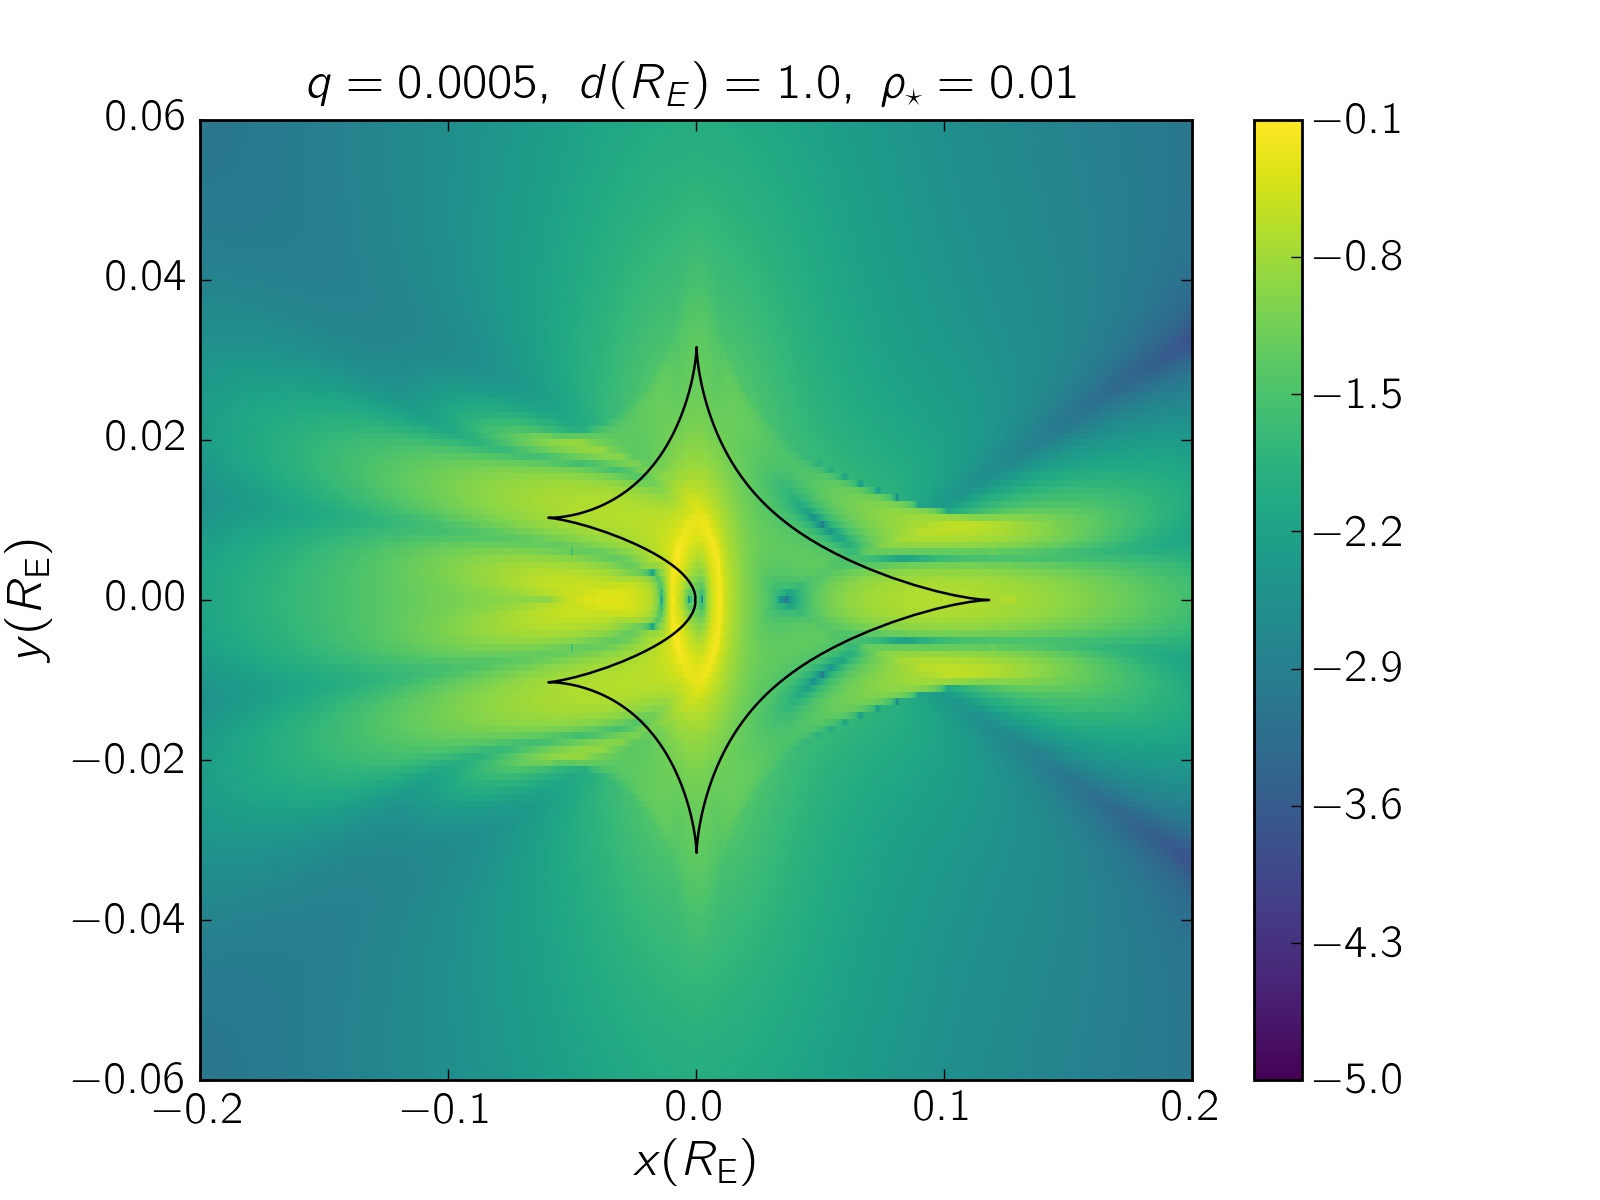
Each binary-lens system as microlenses is specified by two factors: the microlenses mass ratio and the projected separation between two microlenses normalized to the Einstein radius . For a given binary microlenses and in every given point in the lens plane, we calculate the polarization signal of the source star while passing from that point which gives a map of expected polarization signals. We call them as polarization maps. In the following subsection, we study the characteristics of polarization maps for intermediate, close and wide topologies. Here, we assume that the source size is very small with respect to the size of the caustic.
2.1 Polarization maps
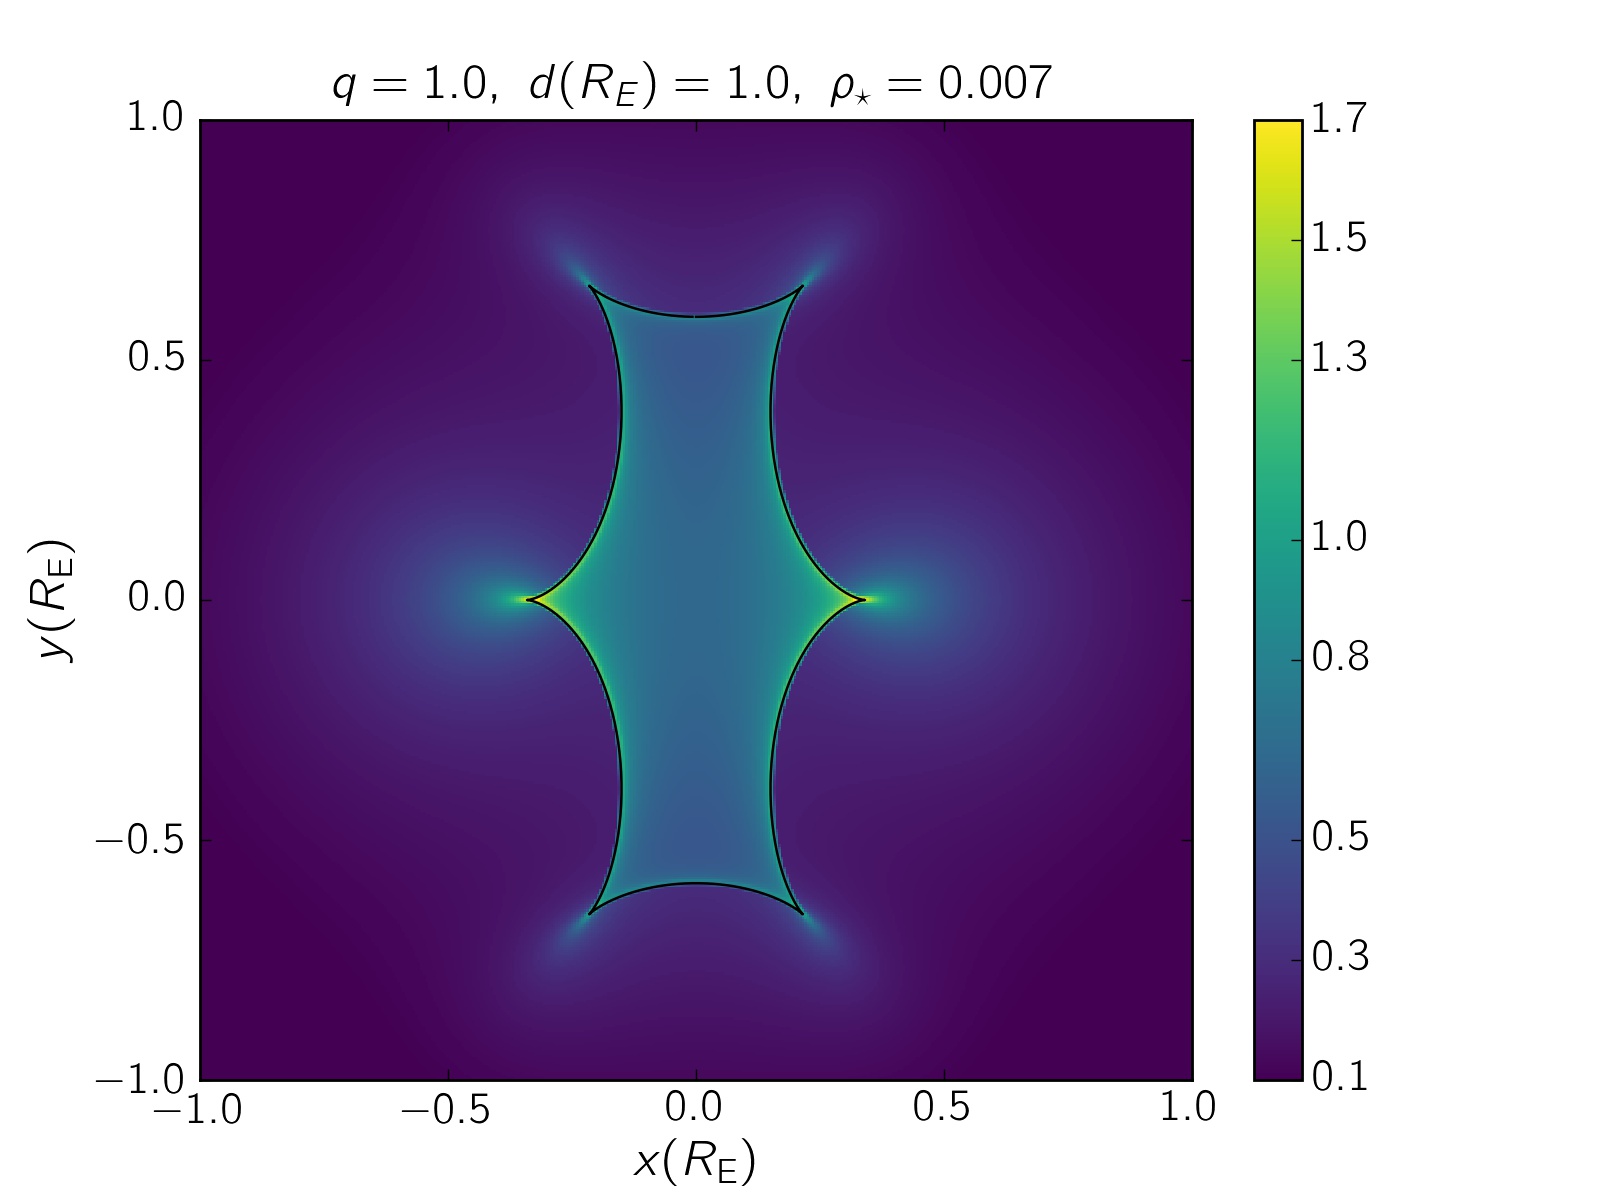
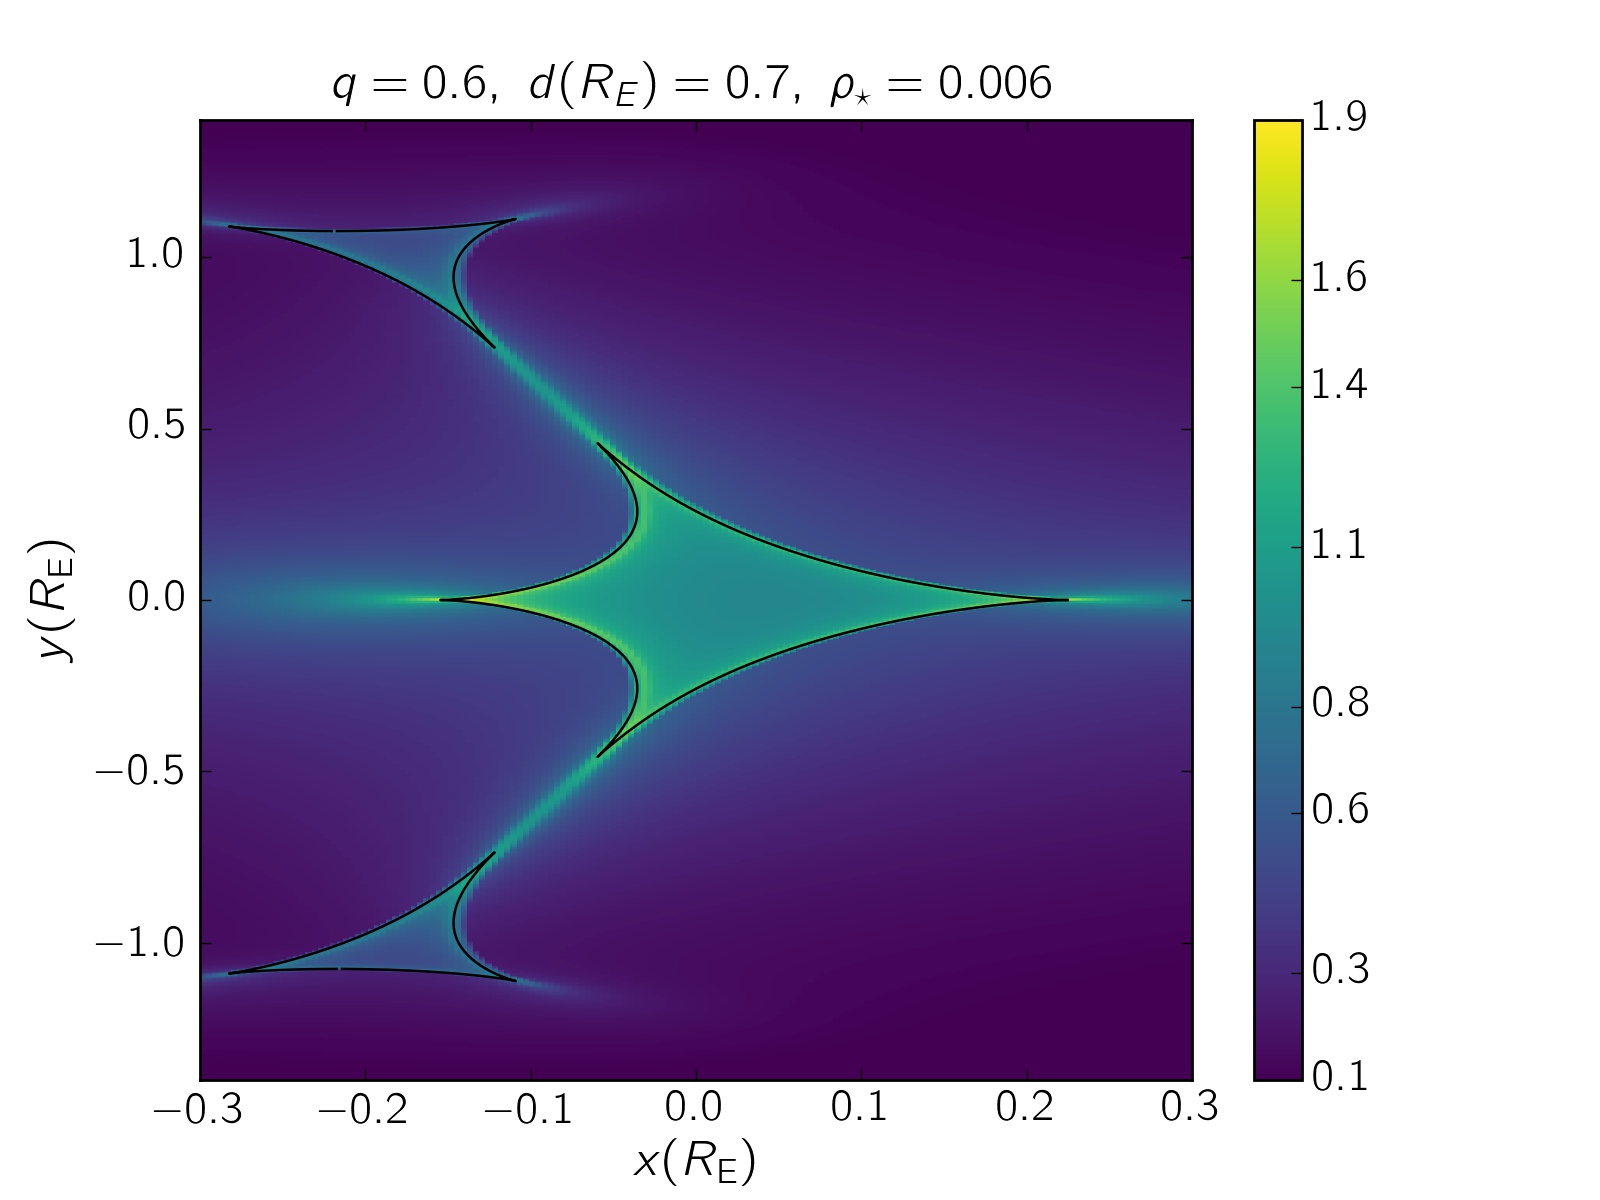
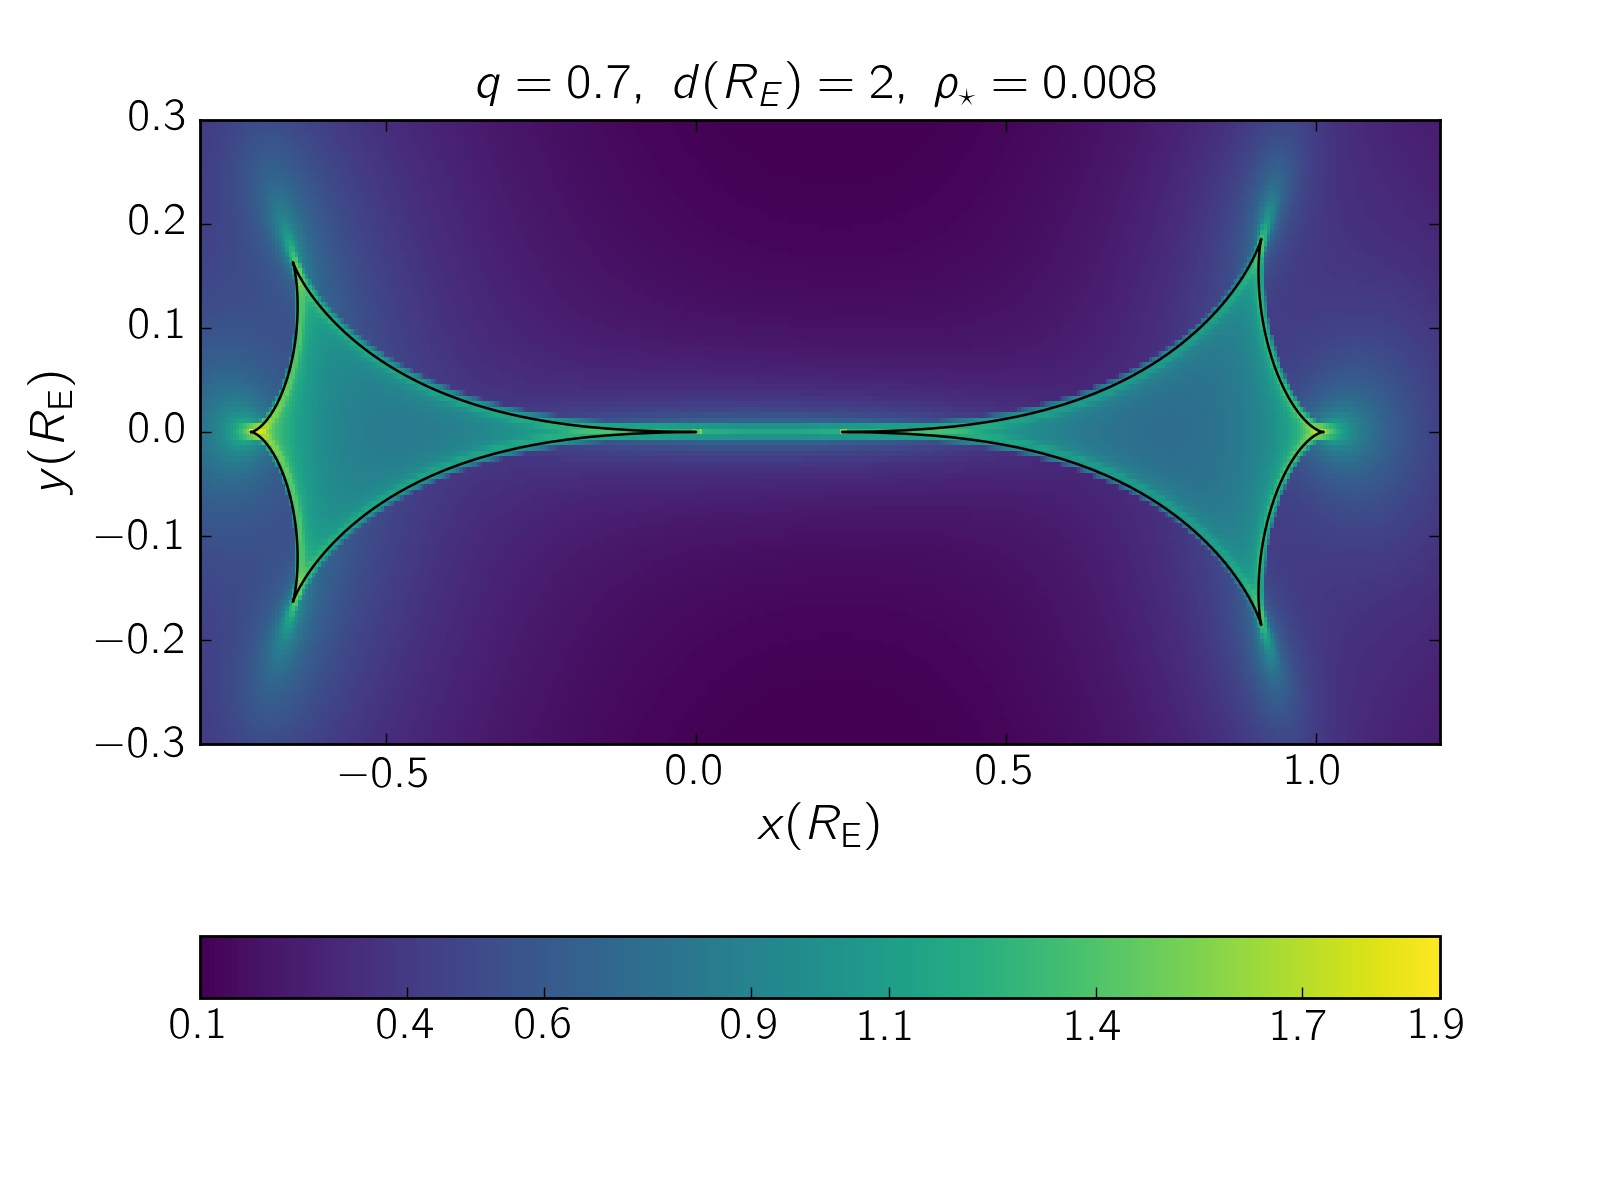
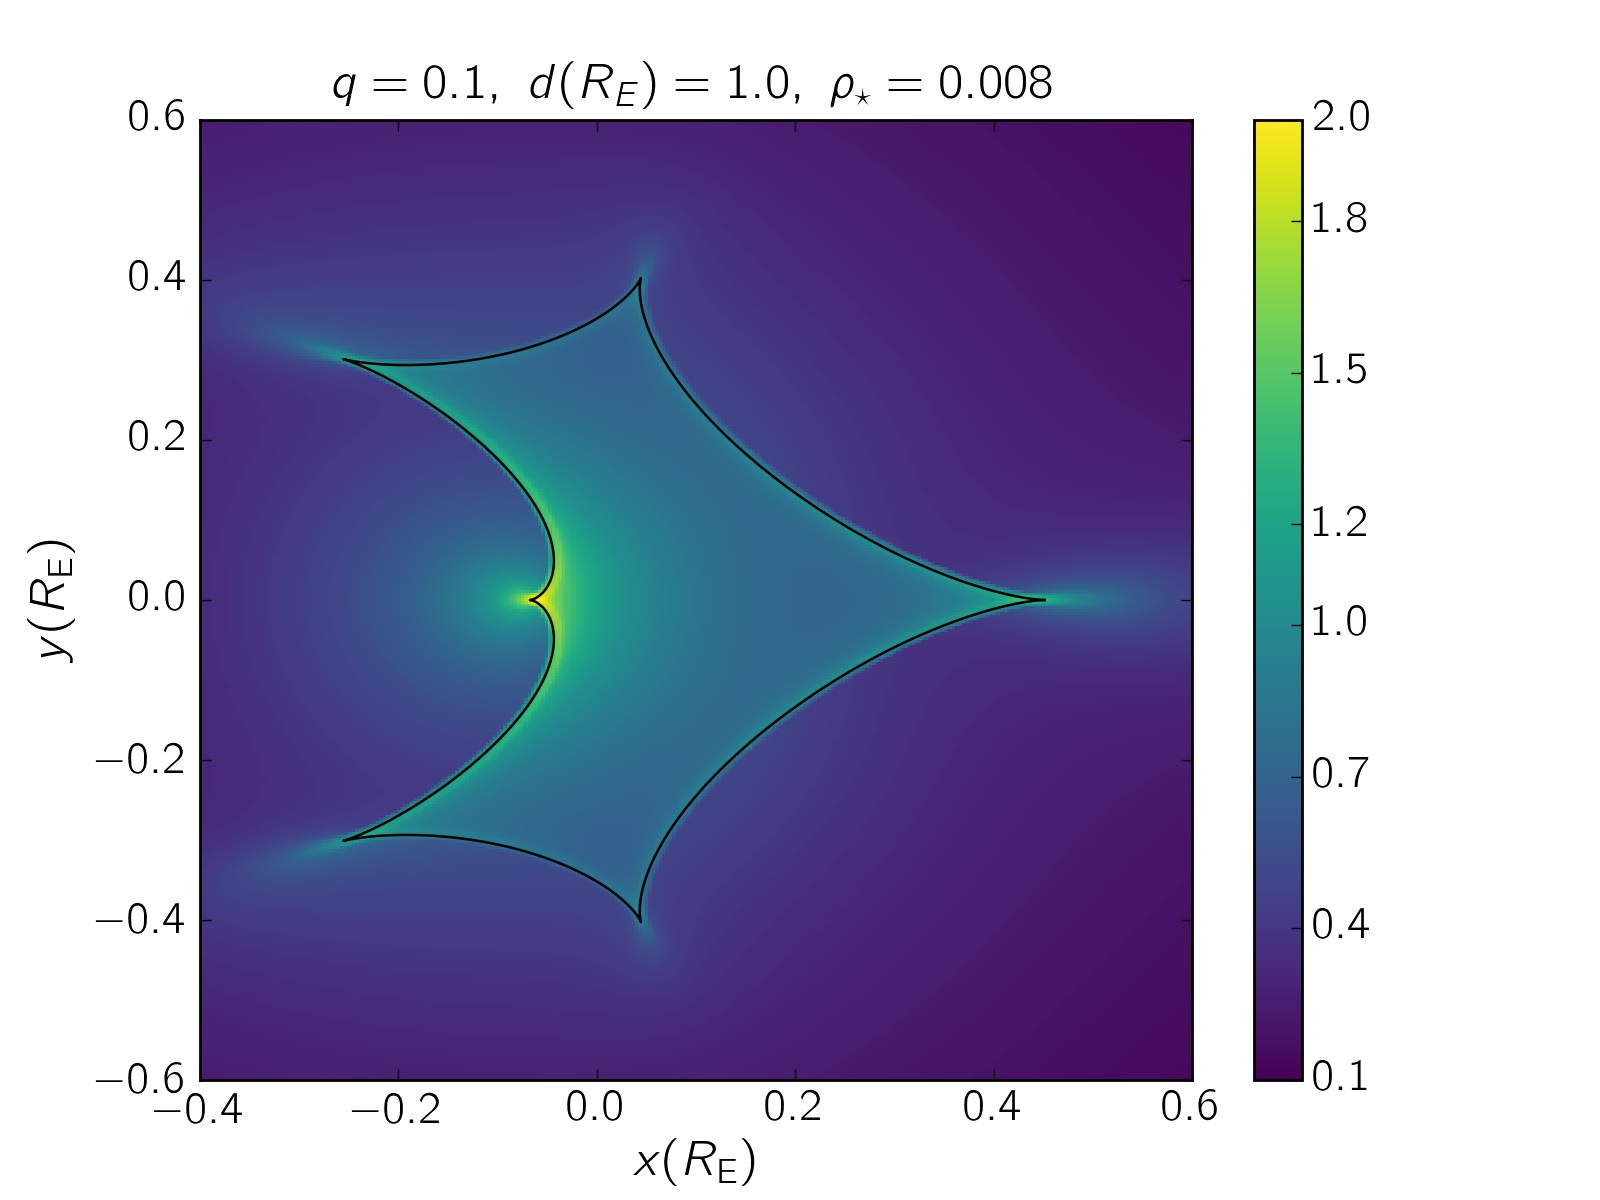
In Figure (2), four examples of polarization maps for different topologies are plotted. For better comparison with magnification maps, we show the corresponding magnification maps in Figure (8) in Appendix. The polarization maps can be described using some points which are classified in the following.
When the source radius is sufficiently smaller than the caustic curve and in caustic crossings, the polarization signal maximizes when the source edge is tangential to the caustic fold and its center is out of the caustic curve. The local polarization signals from the stellar edges are maximum (see equations 2). Hence, whenever some part of the source edges magnifies highly, the integrated polarization signal maximizes. Comparing different folds, the maximum polarization signal occurs when the source is crossing the folds create the closest cusp to the location of the primary, although the highest magnification factor occurs when the source crosses that cusp itself (see Figure 8). The value of these maximum polarization signals depends on the source size, but mostly reach to one percent for hot and early-type stars.
Since the maximum local polarized and total intensities from the source surface are from the stellar edge and its center, respectively, so the magnification peak takes place when the source center is on the fold and its the time interval with the largest polarimetry peak is , where is the time of crossing the source radius. When entering the caustic line, the polarization peak happens earlier whereas in exiting from the caustic line the magnification peak happens earlier. When the source does not cross the caustic and just passes close to it, their time interval depends on the caustic shape, the source trajectory and the source radius. This time interval decreases by increasing the impact parameter.
When the source is wholly inside the caustic curve, although its magnification factor is considerable and it is not zero, the polarization signal is almost zero. In that case, every point over the source disk is magnified, but there is no significant symmetry breaking.
On the connection lines between different caustic curves in close and wide topologies, the polarization signals are considerable, although they do not reach to one percent, which are achievable in fold caustic crossings (see, e.g., Figure 5).
Comparing the magnification and polarization maps, whenever the magnification map is smooth and without high fluctuations, there is no significant polarization signal, even though the magnification factor is high at every point, for instance inside the caustic curve.
2.2 Polarization in planetary microlensing
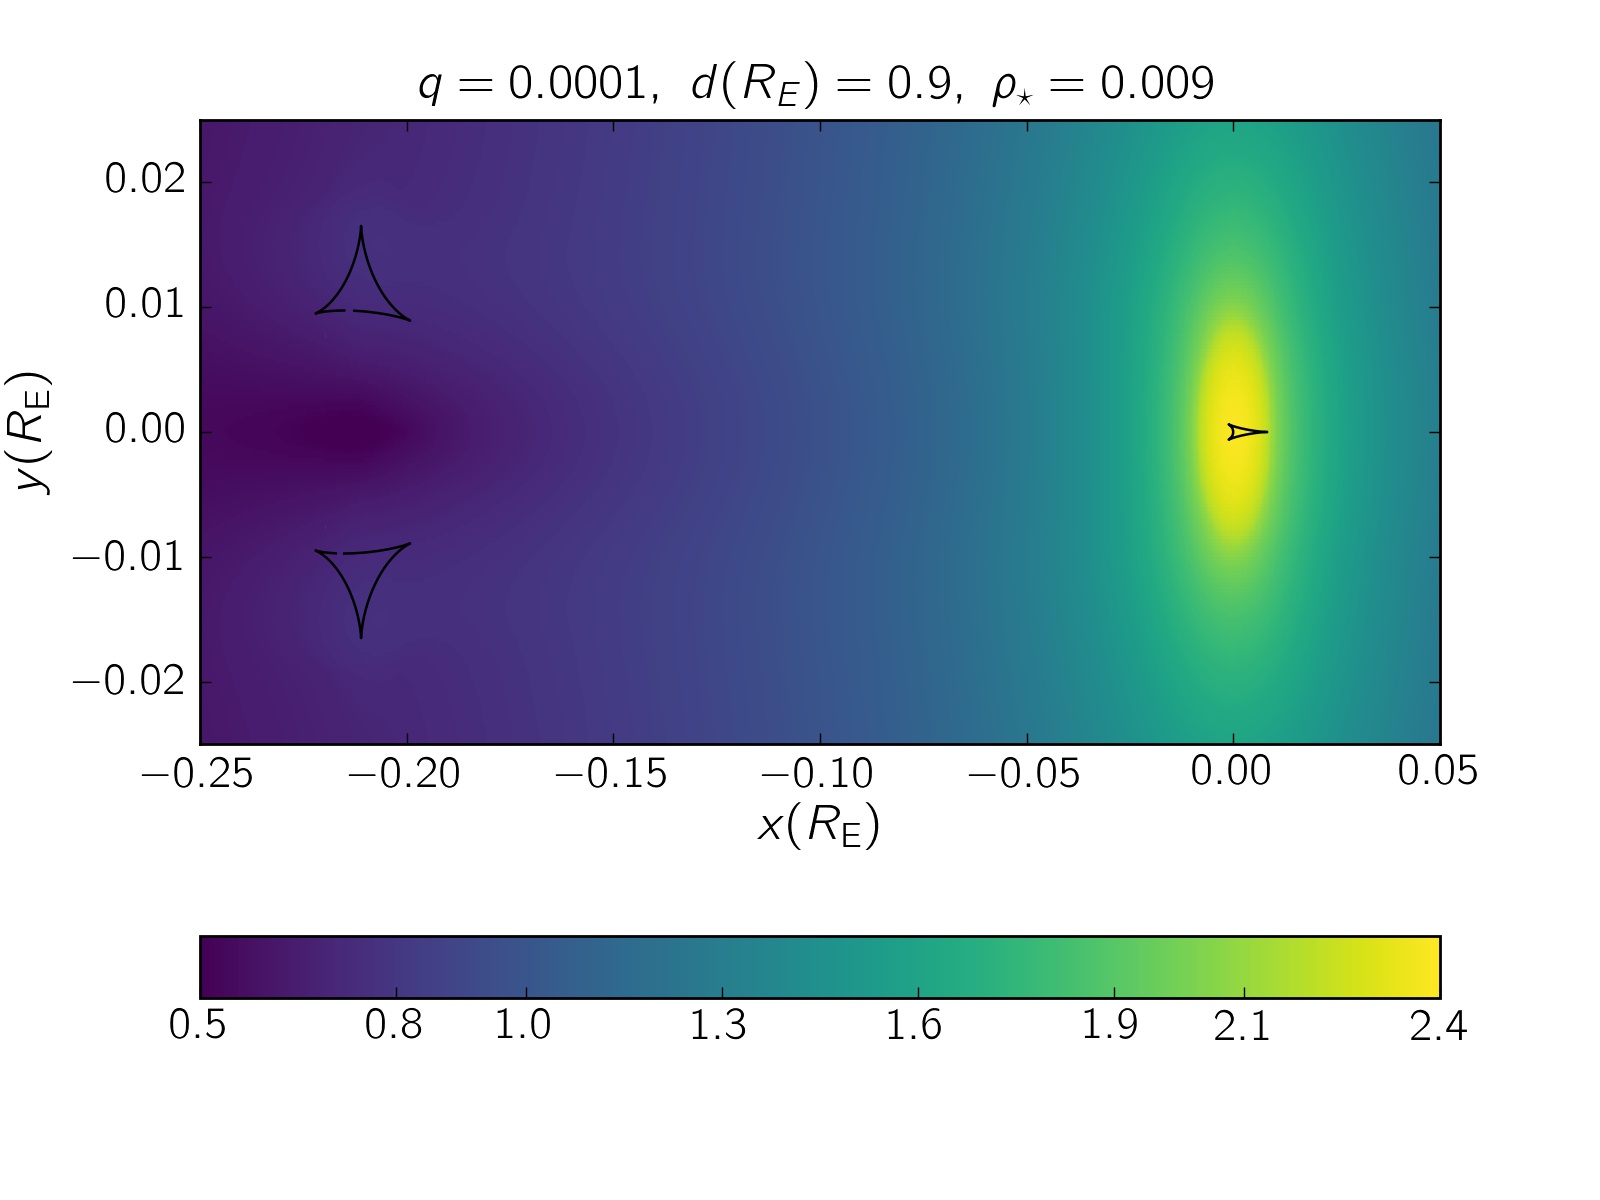
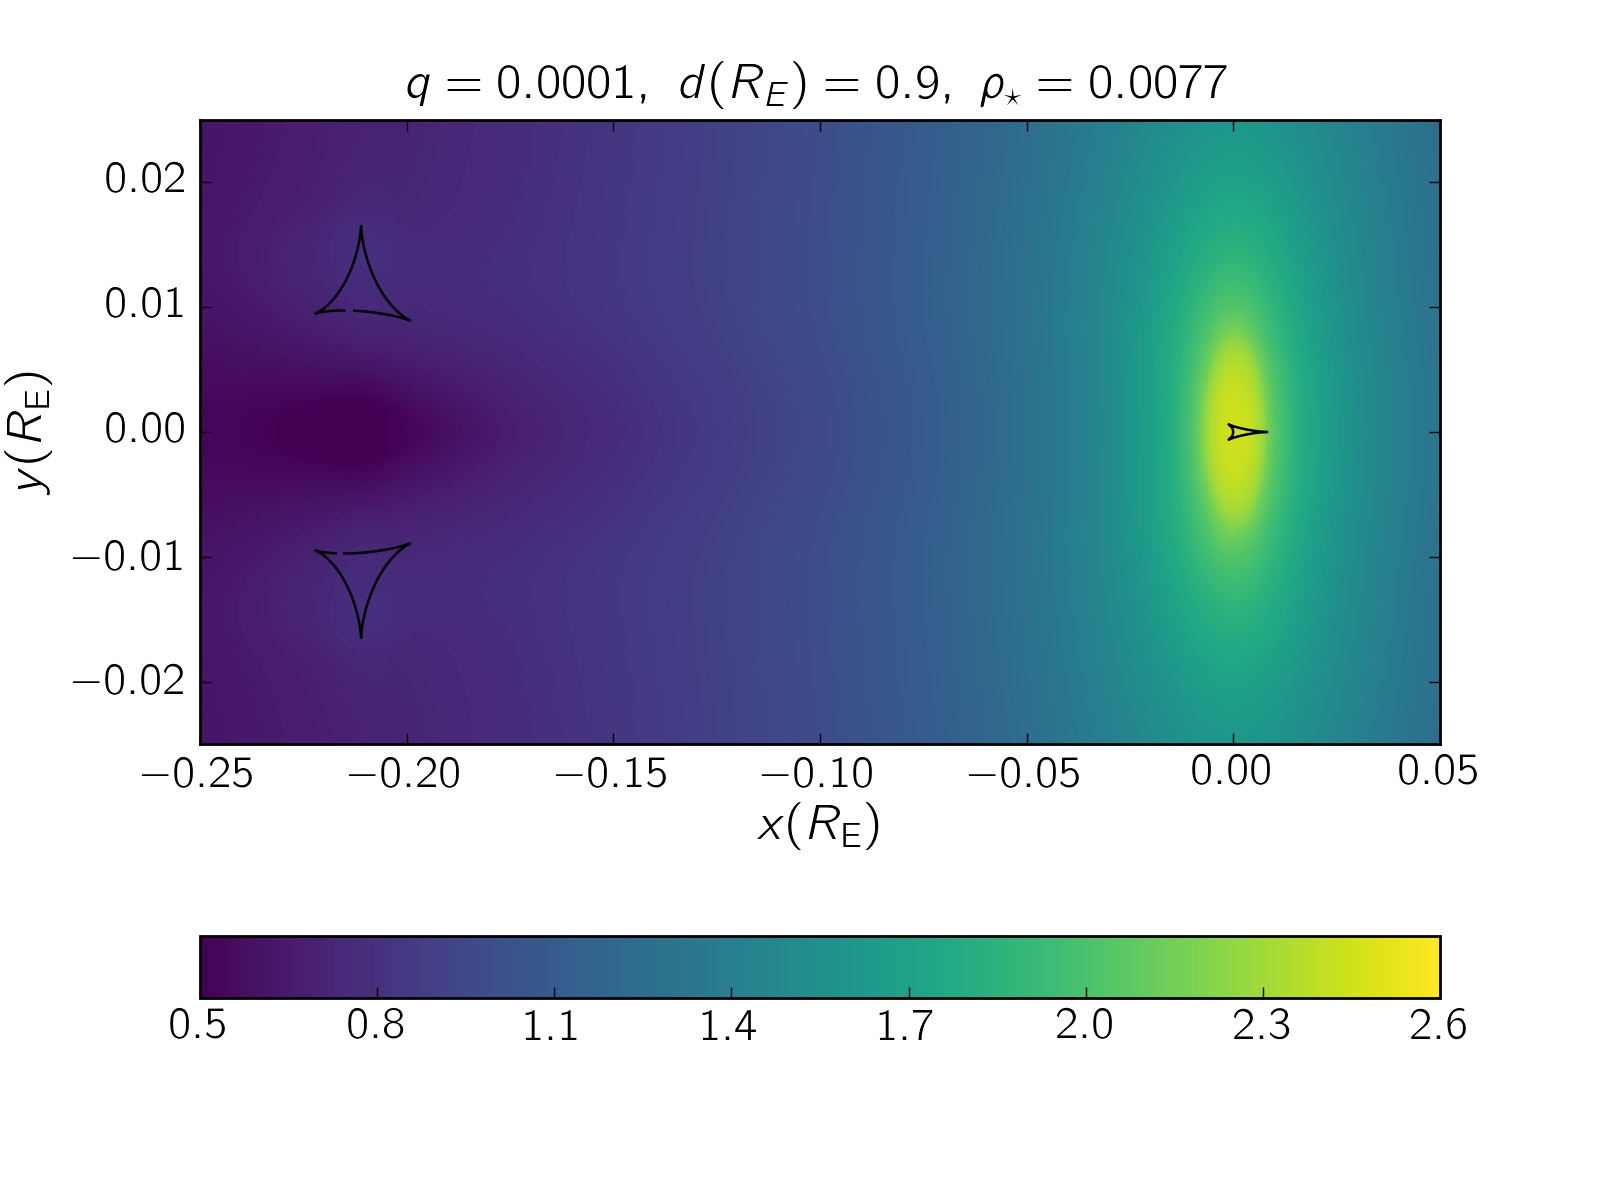
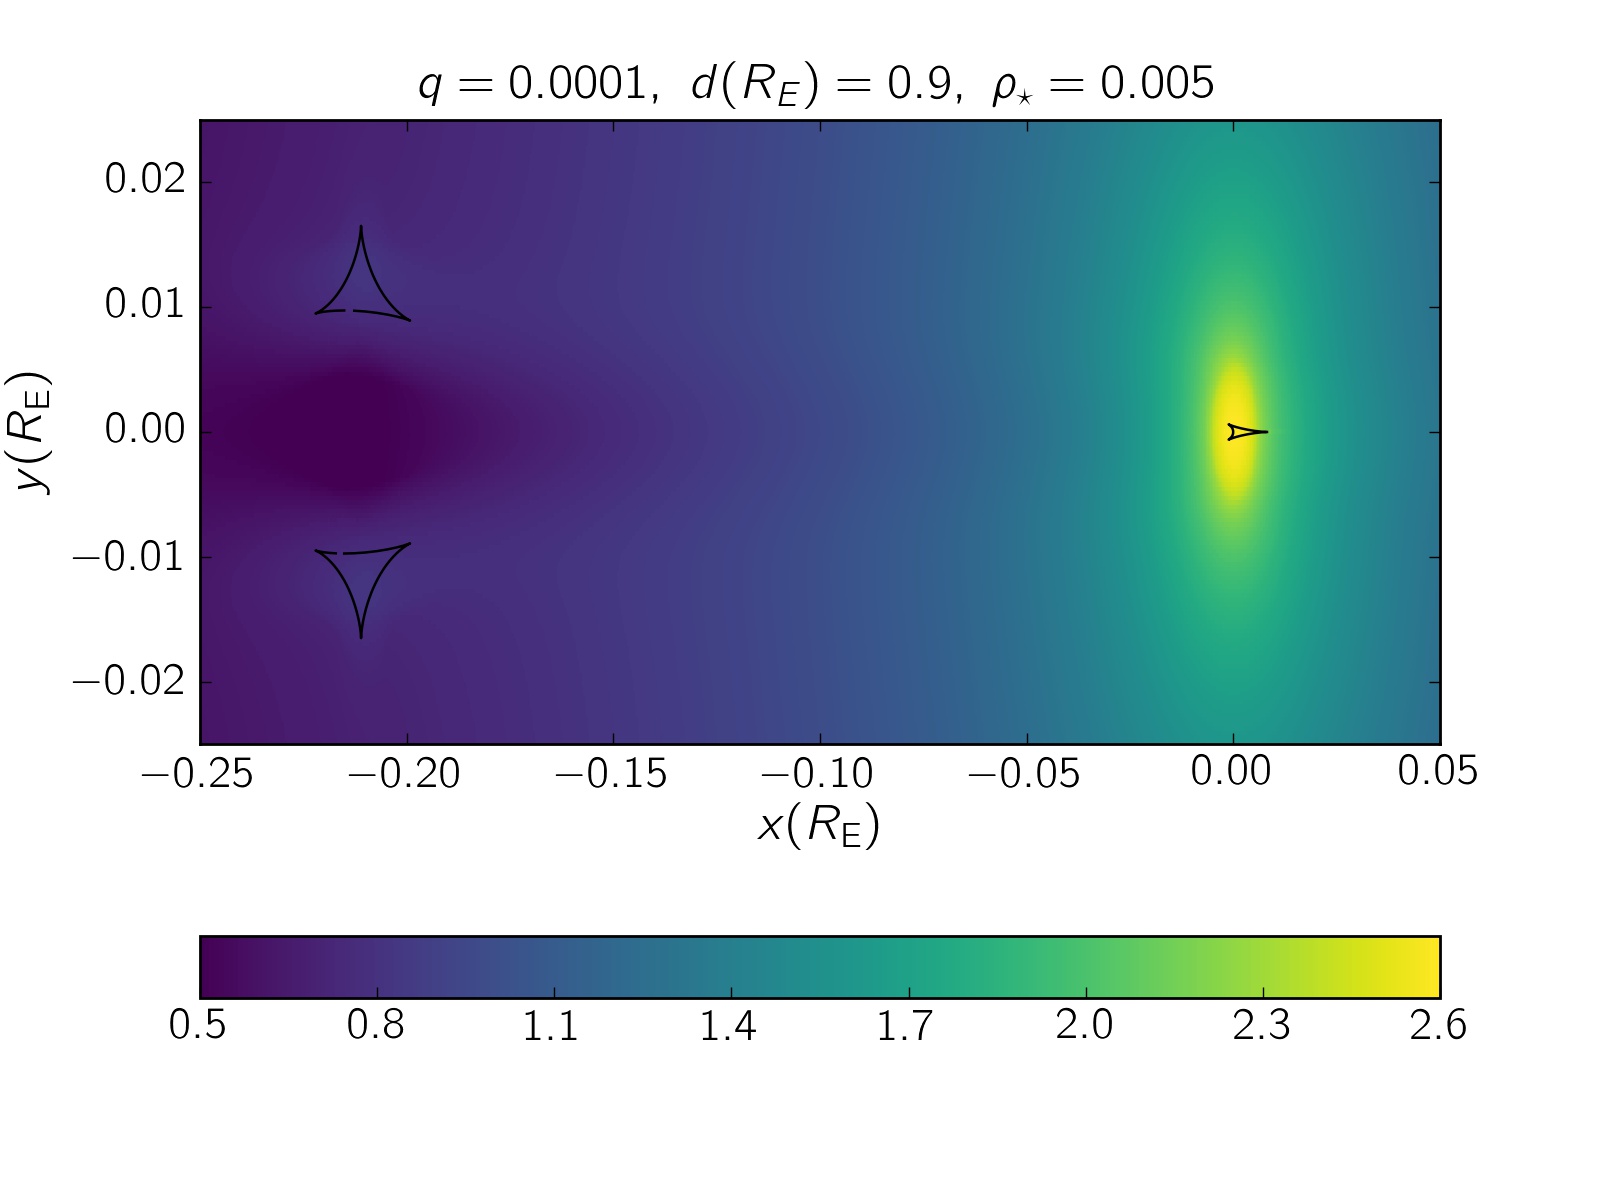
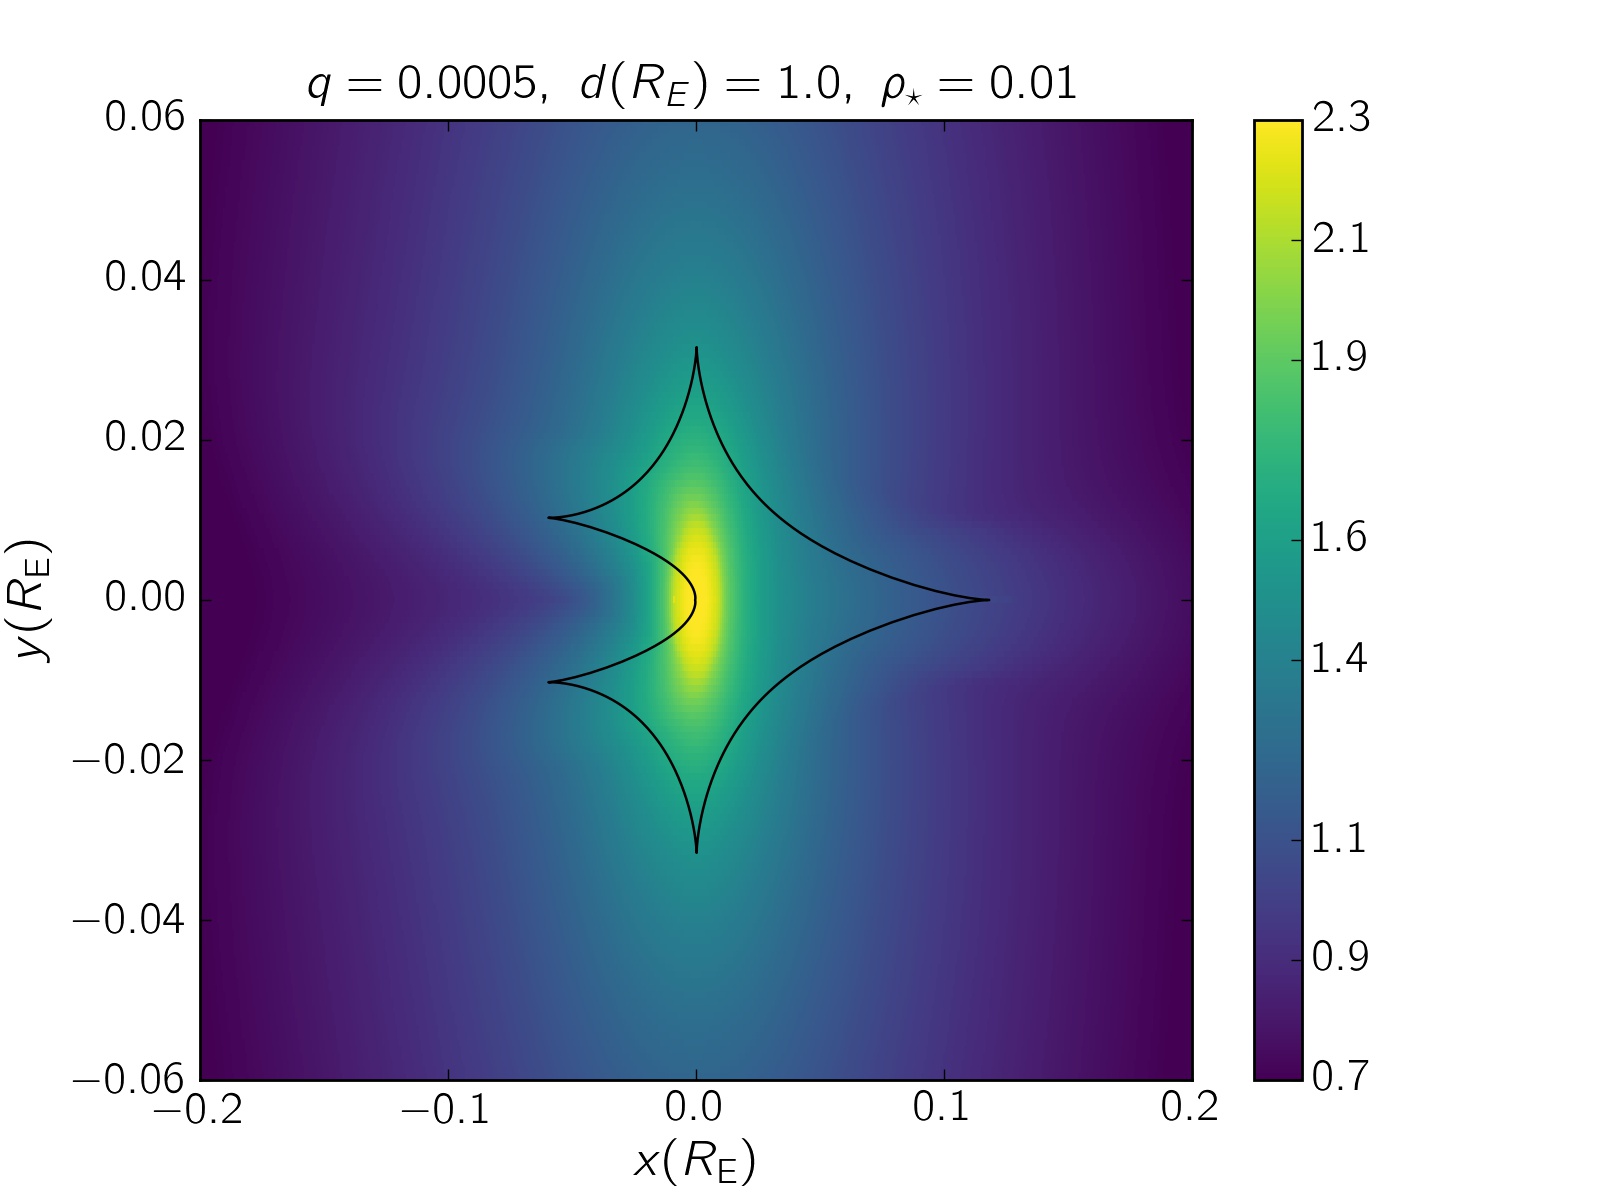
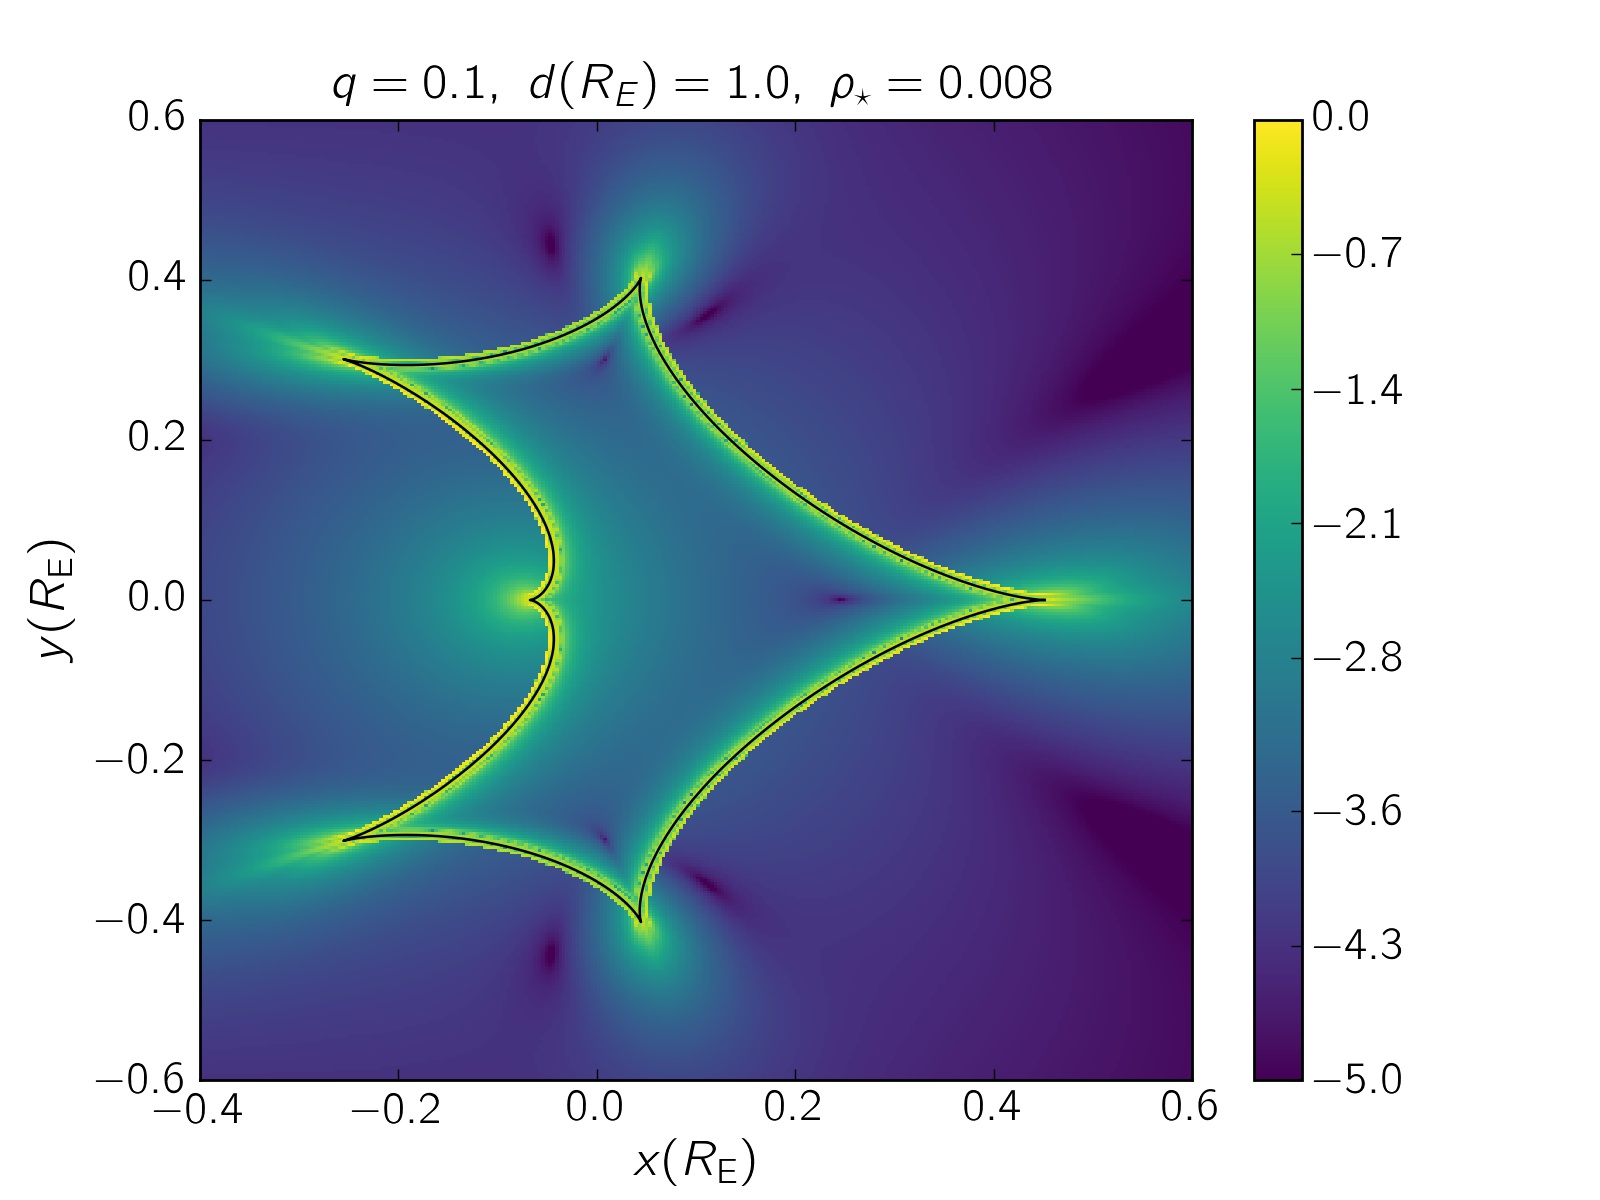
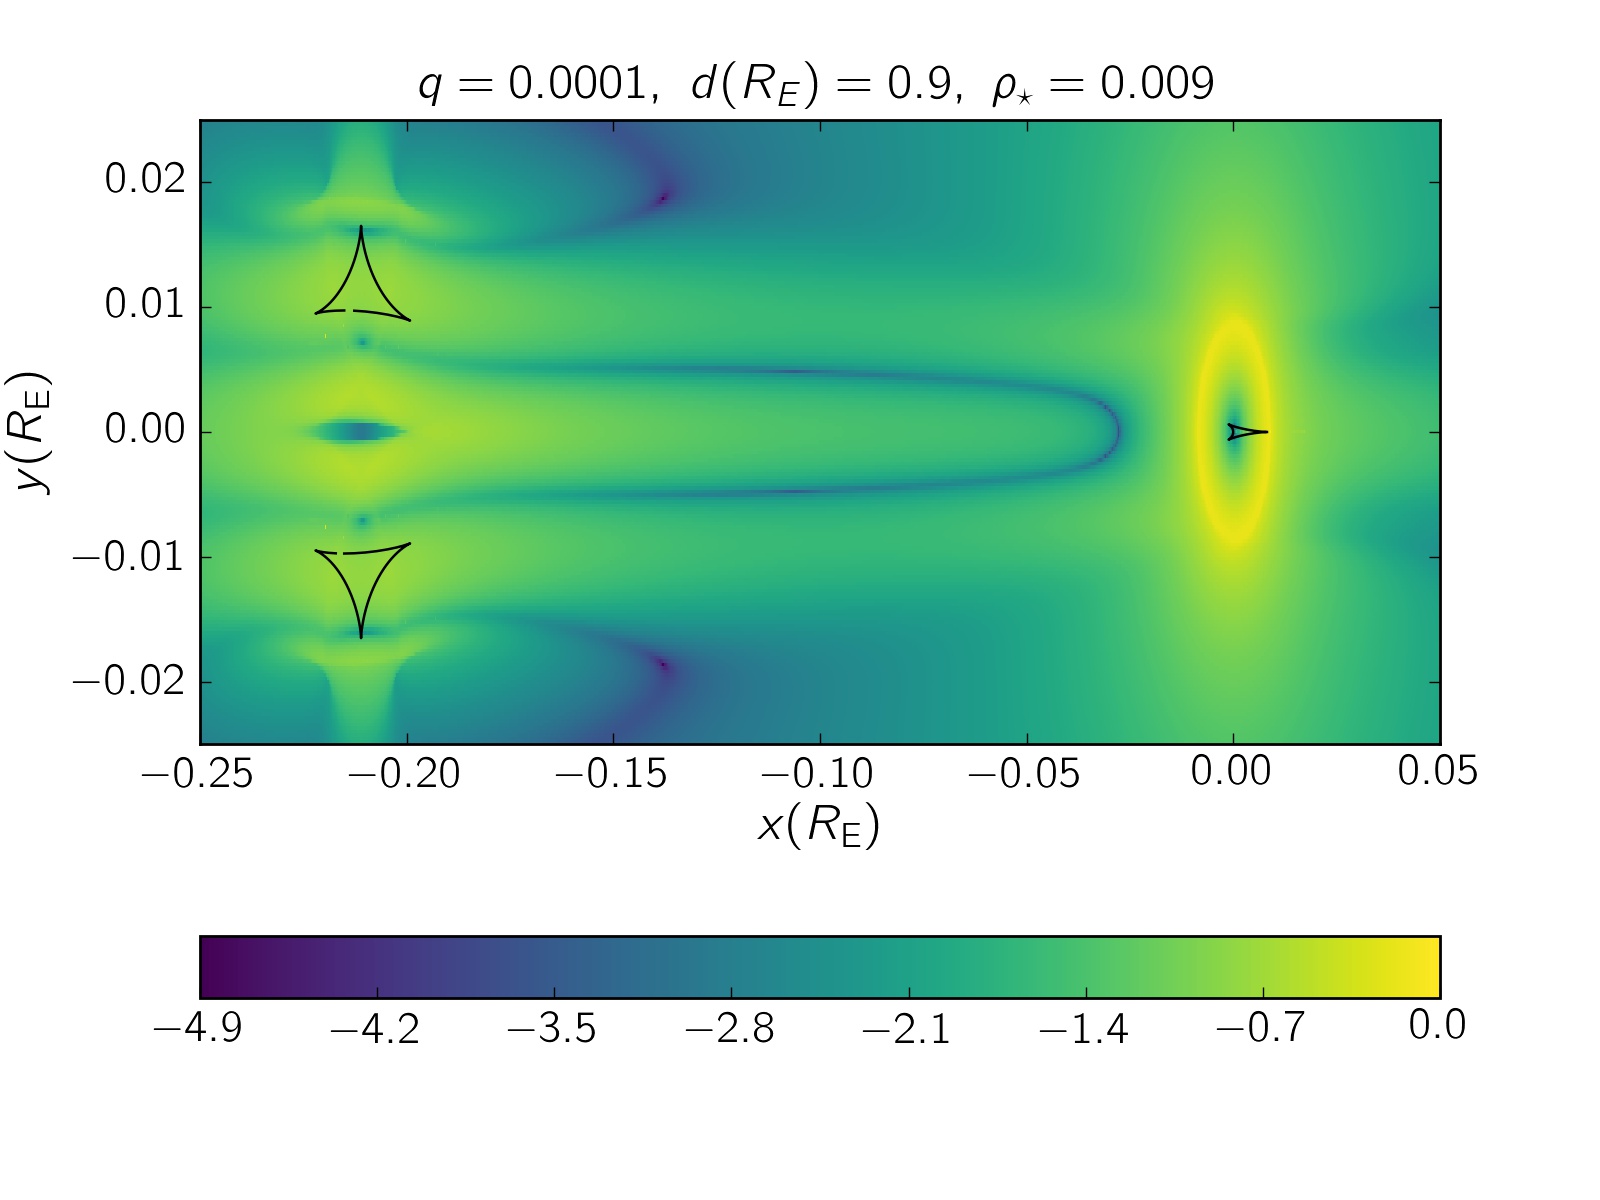
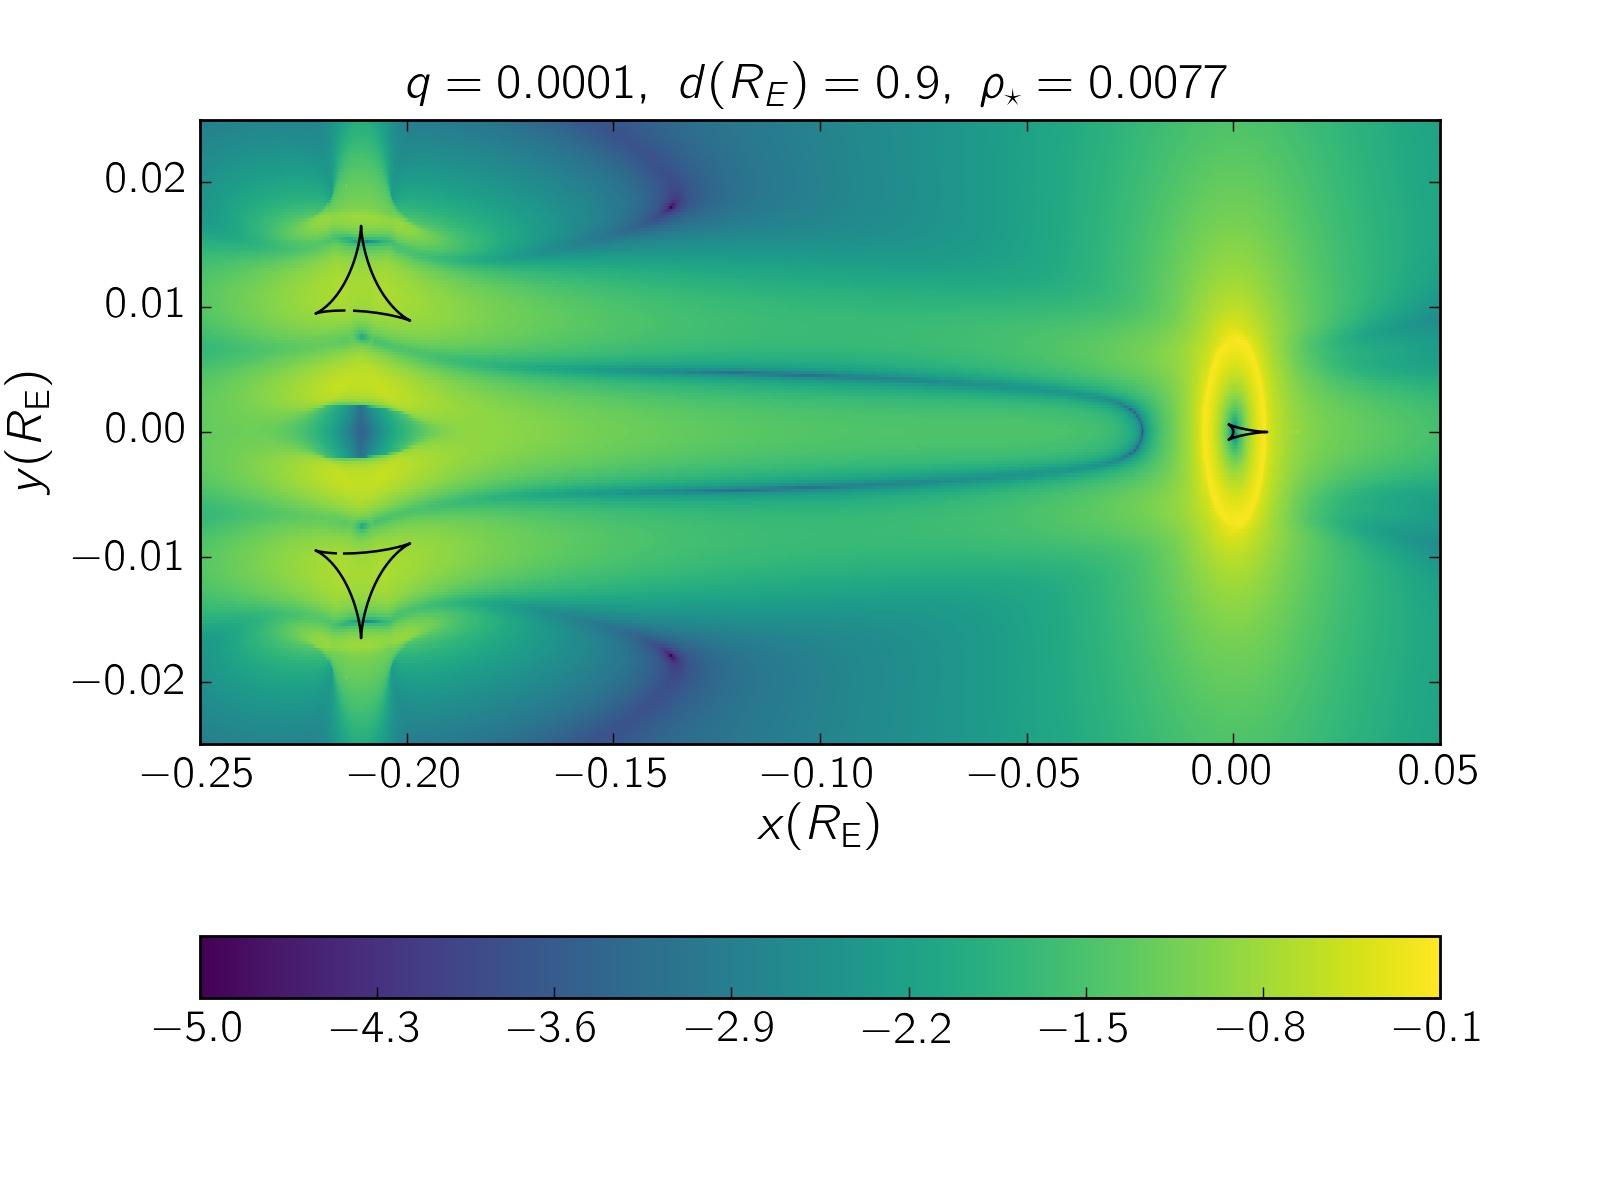
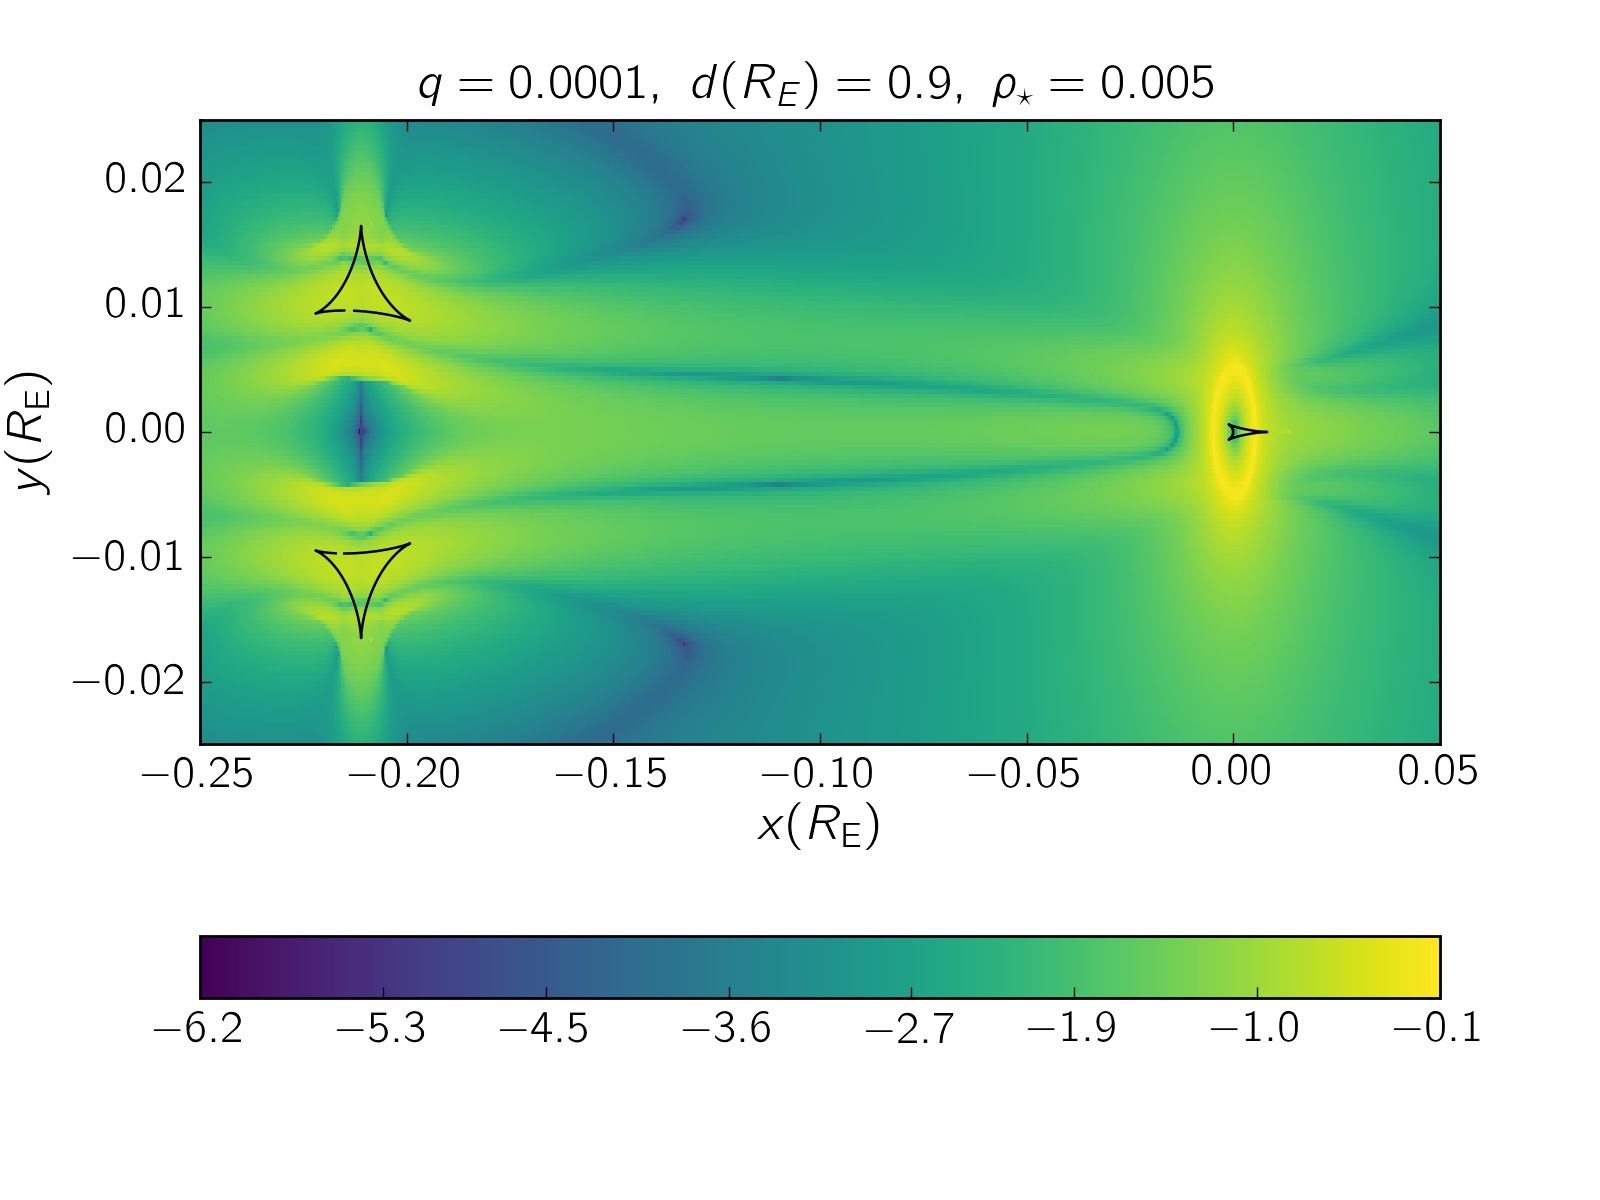
When microlenses constitute a planetary system, we have one small central and two planetary caustics. For very small mass ratio, the size of the central caustic is proportional to (Chung et al., 2005) and mostly small in comparison with the source size. We plot four polarization maps corresponding to some planetary systems in Figure (3). Their corresponding magnification maps are shown in Figure (9) of Appendix. According to these maps, in planetary microlensing events the maximum polarization signals take place over a ring around the position of the primary. Noting that the magnification factor maximizes at the center of this ring (see Figure 9). Hence, whenever the source edge passes from the location of the primary its polarization signal maximizes.
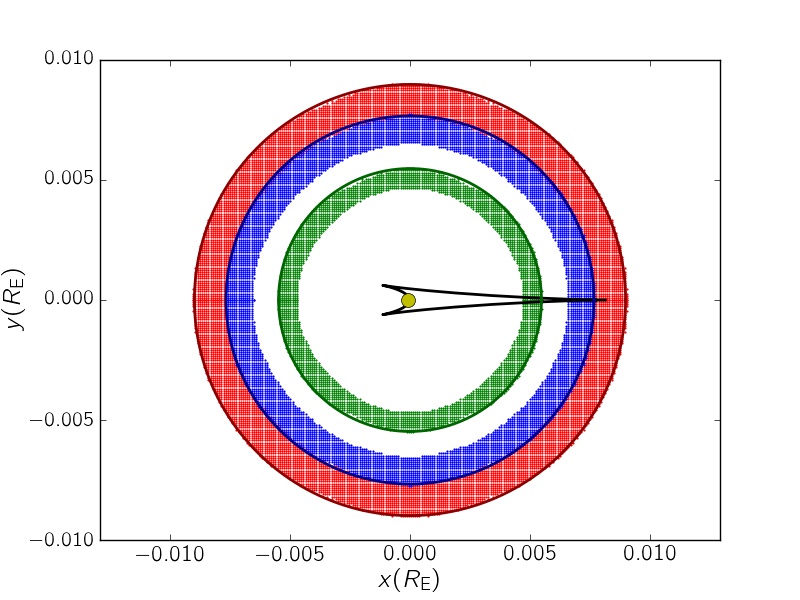
In order to study the finite source effect on the polarization maps in planetary microlensing events, in Figures 3, 3 and 3 we consider three different source radii, i.e., . The larger source radius, the greater ring with higher polarization amounts. According to the numerical calculations, the radius of the rings is . Hence, the time interval between the polarization and magnification peaks is , when the source passes from the central caustic.
To better show the circular shape of these rings and compare their radii with the source radius, the rings are plotted in Figure (4). In this plot, the points with the polarization signals higher than percent (most likely measurable) are shown. The red, blue, green points and circles are the high polarization points and the source rings corresponding to , respectively. The yellow circle represents the position of the primary. The central caustic is plotted with the black curve.
The magnification factor is not high around planetary caustics (see Figure 9), whereas the polarization signals is not zero around them. However, their polarization signals can not reach to one percent and is less than those upon the rings around the central caustic. Right between two parts of planetary caustics the polarization is very low, because of symmetry.
The last map of Figure (3), is an intermediate topology with small value for . The size of the resonance caustic is (Gaudi, 2012) for a fixed value of . We choose the source size as on the same order of magnitude of the size of the caustic for . Similarly, the highest polarization signals take place on a circular ring whose center is at the location of the perimetry. If the source passes normal to the binary axis (when it is outside the caustic), three polarization peaks create. The polarization angle at the position of each peak differs by with respect to its next peak.
2.3 Polarization in fold caustic crossings
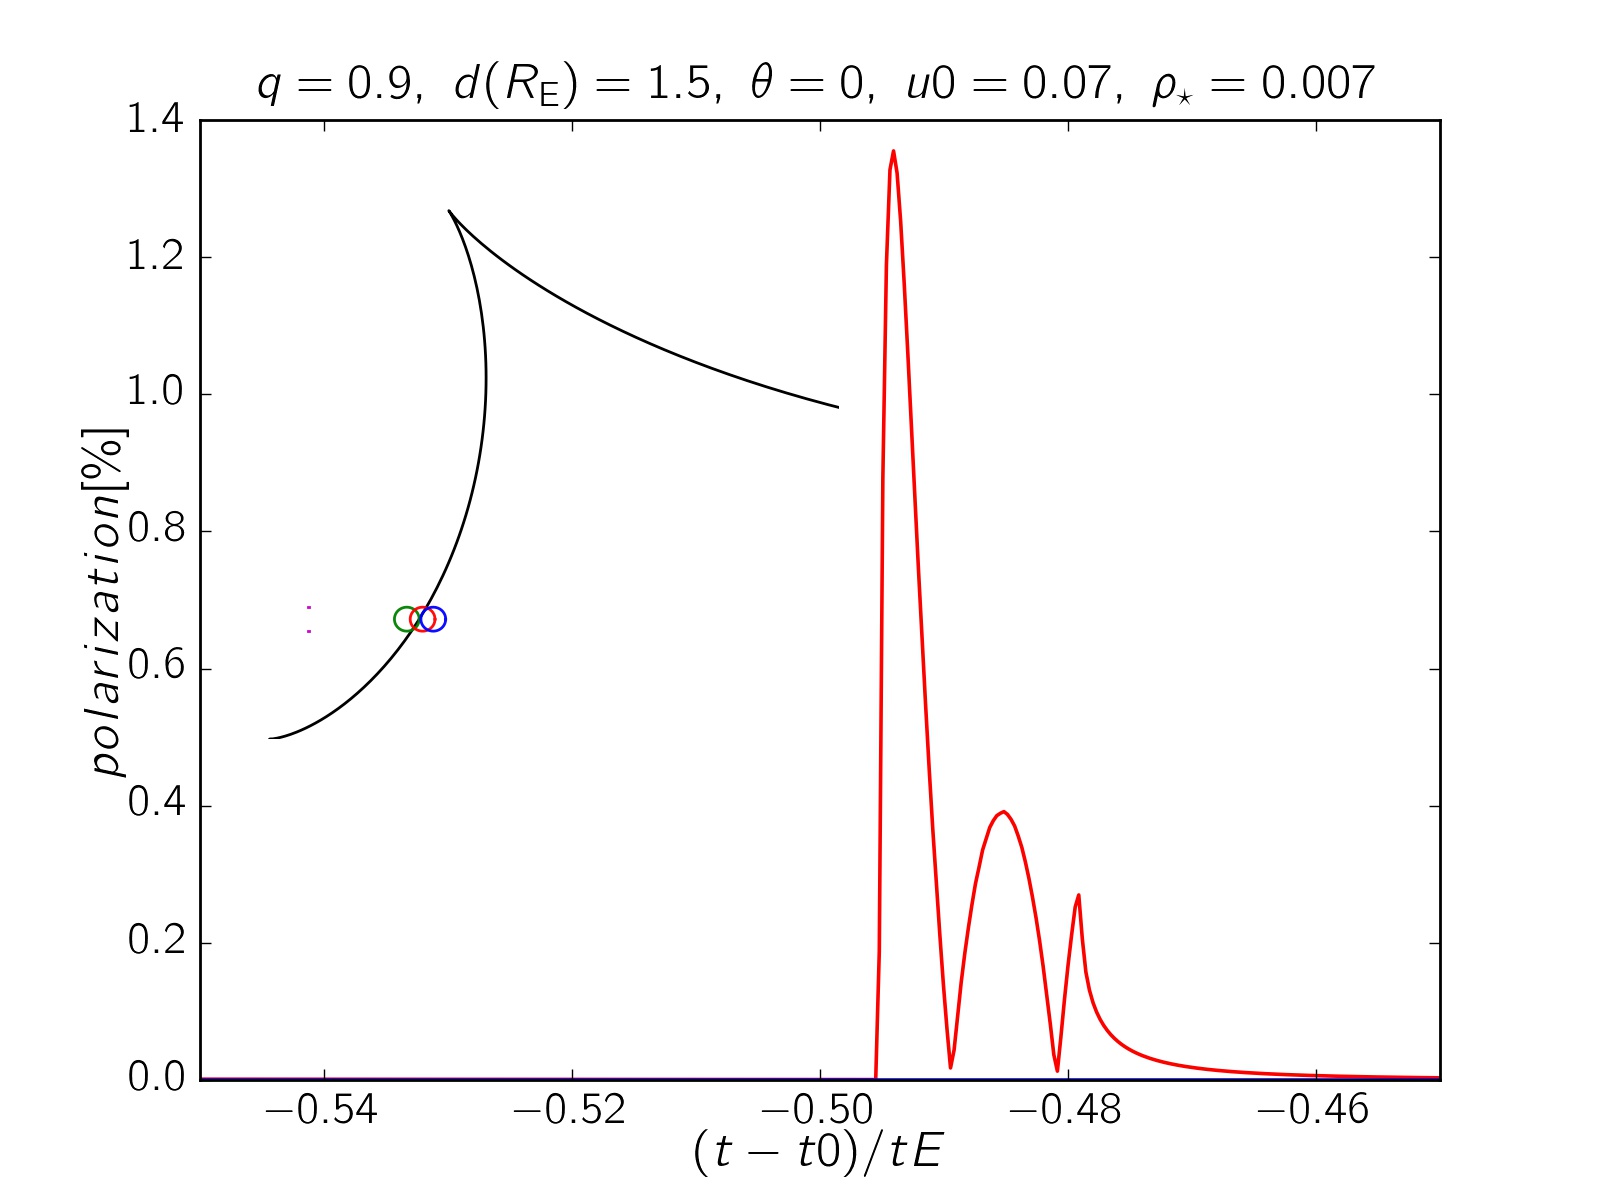
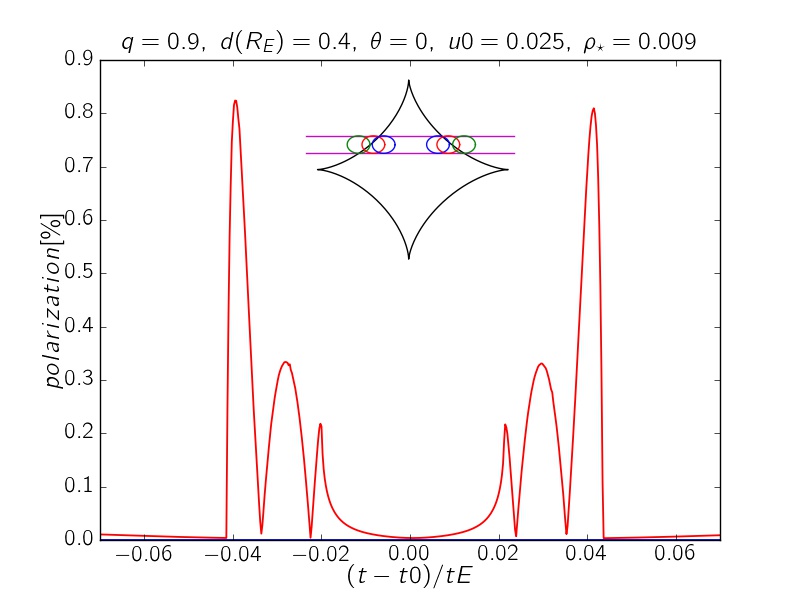
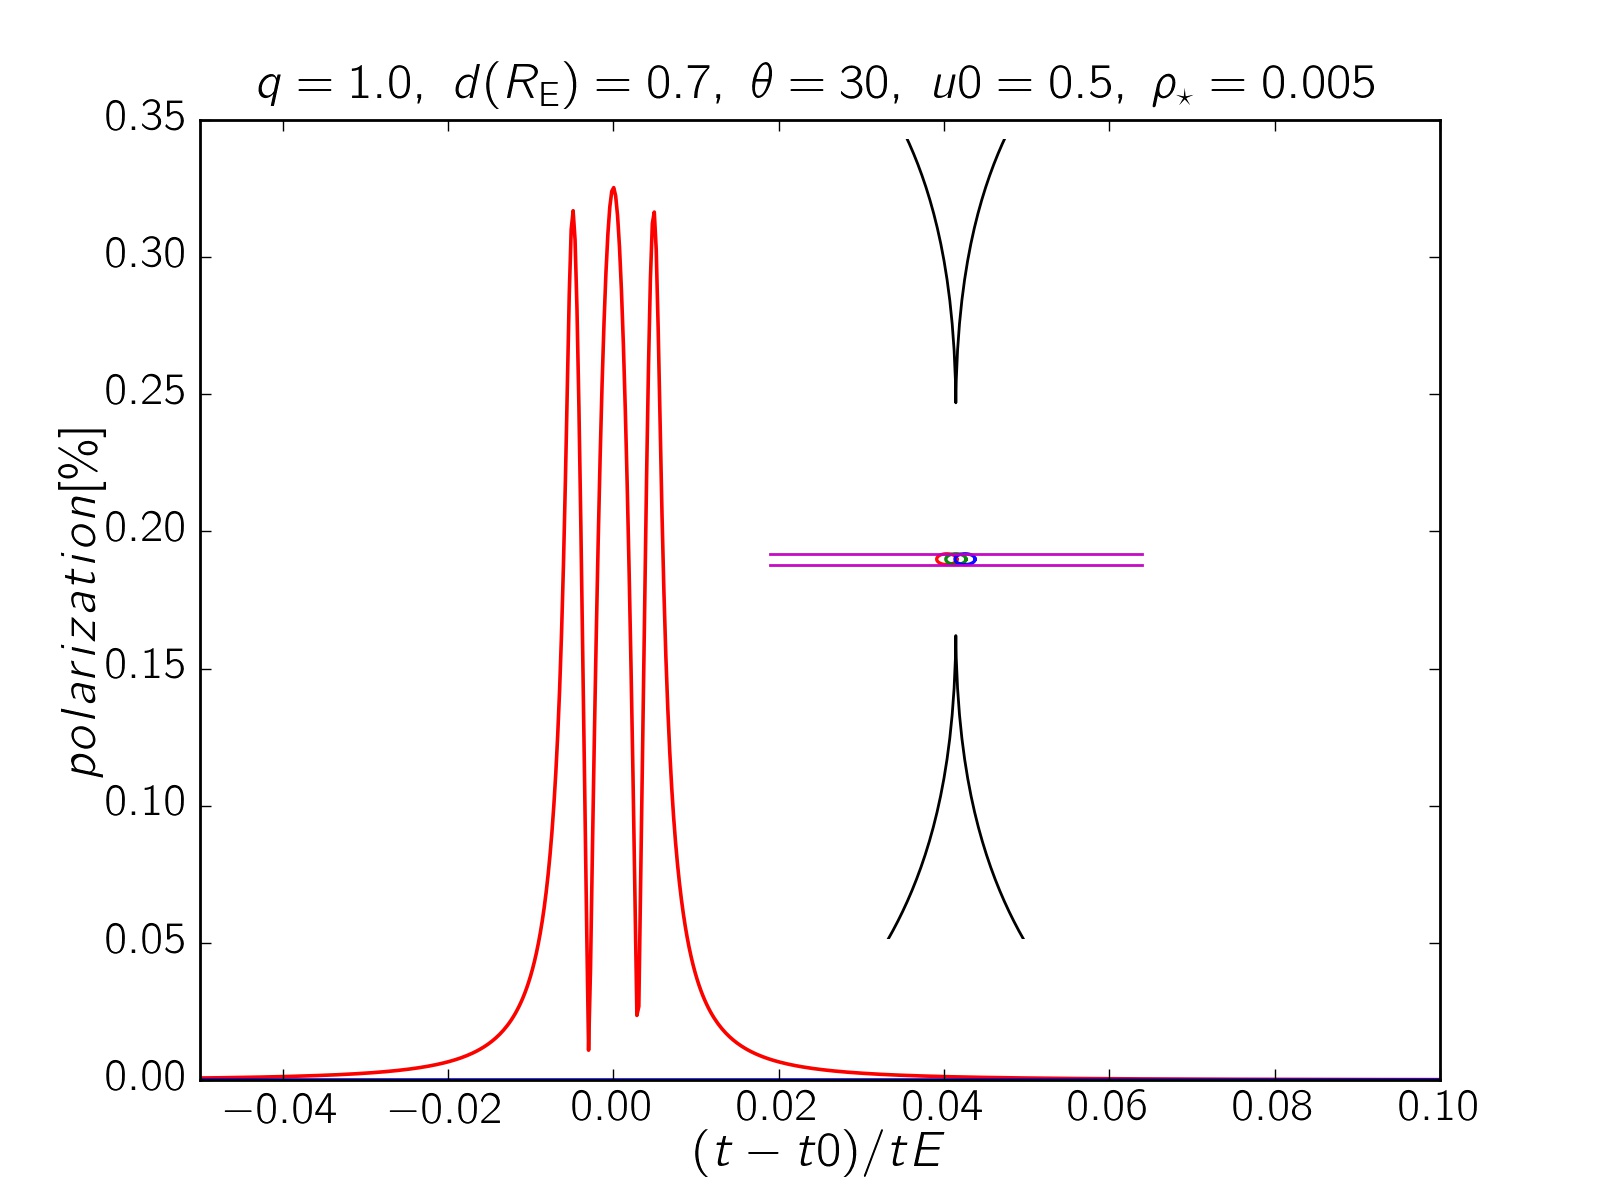
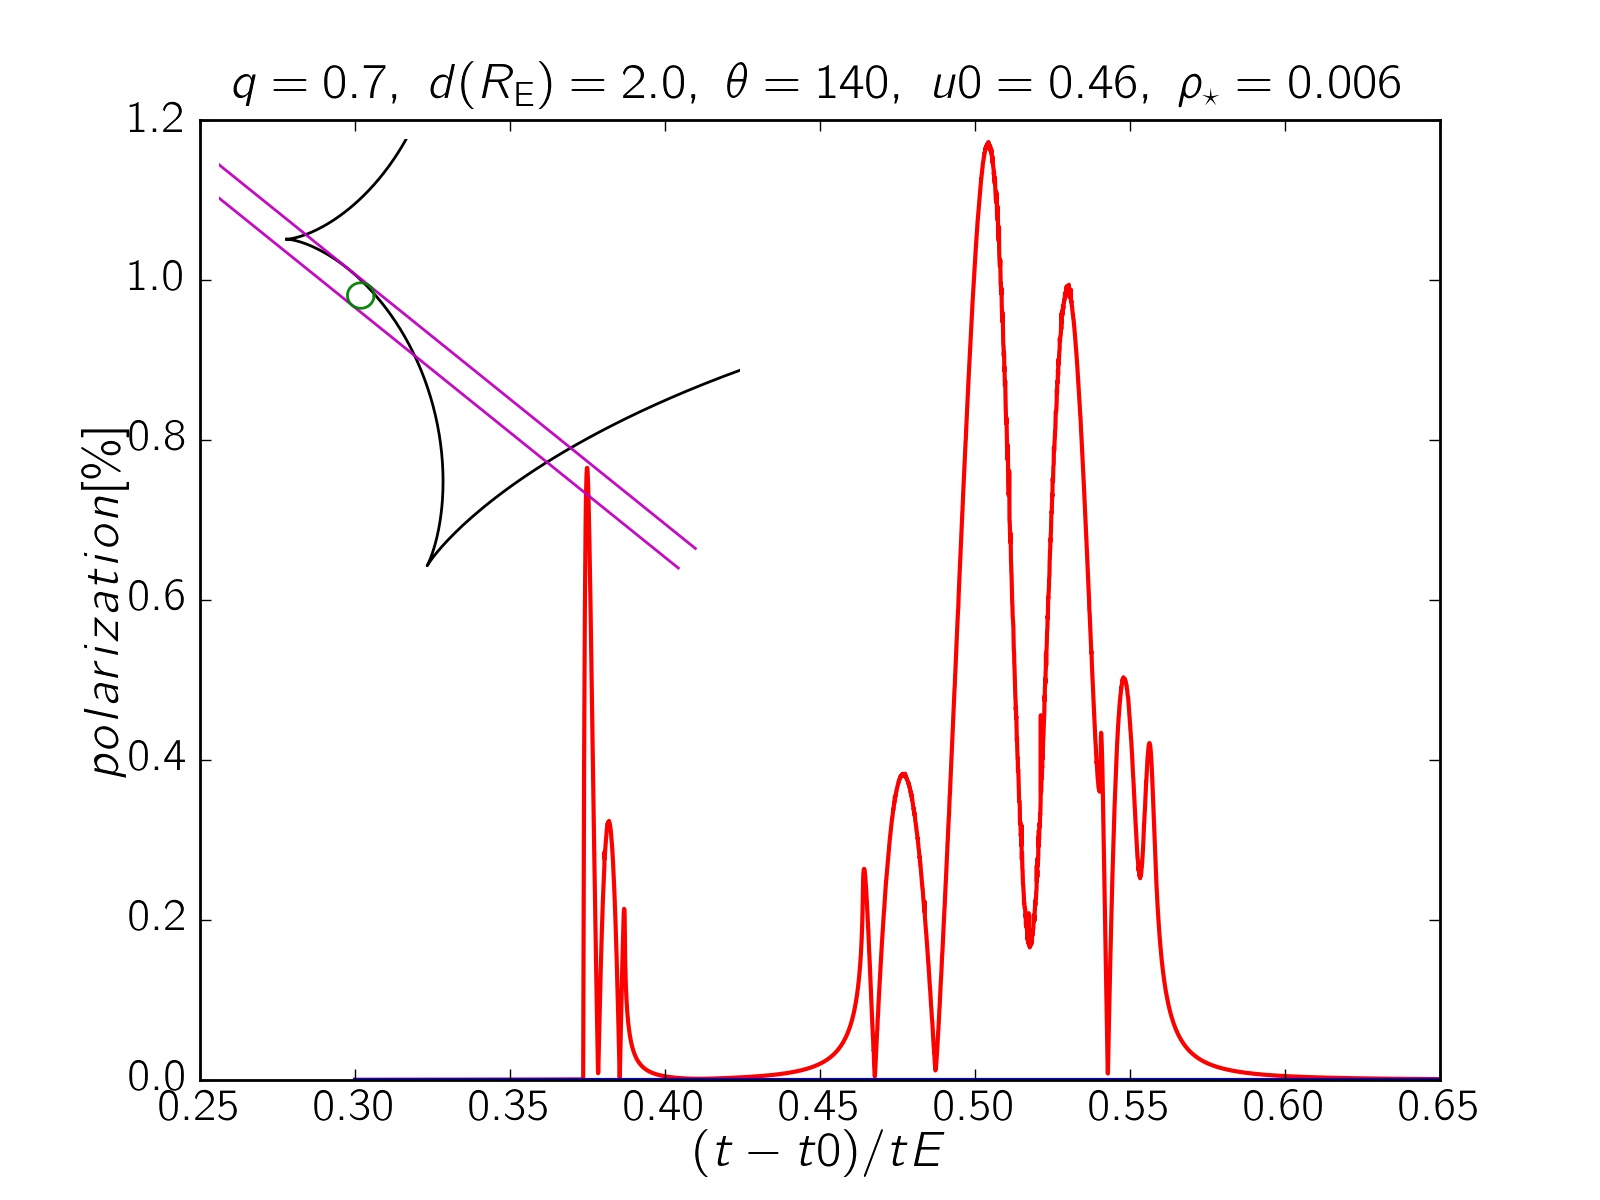
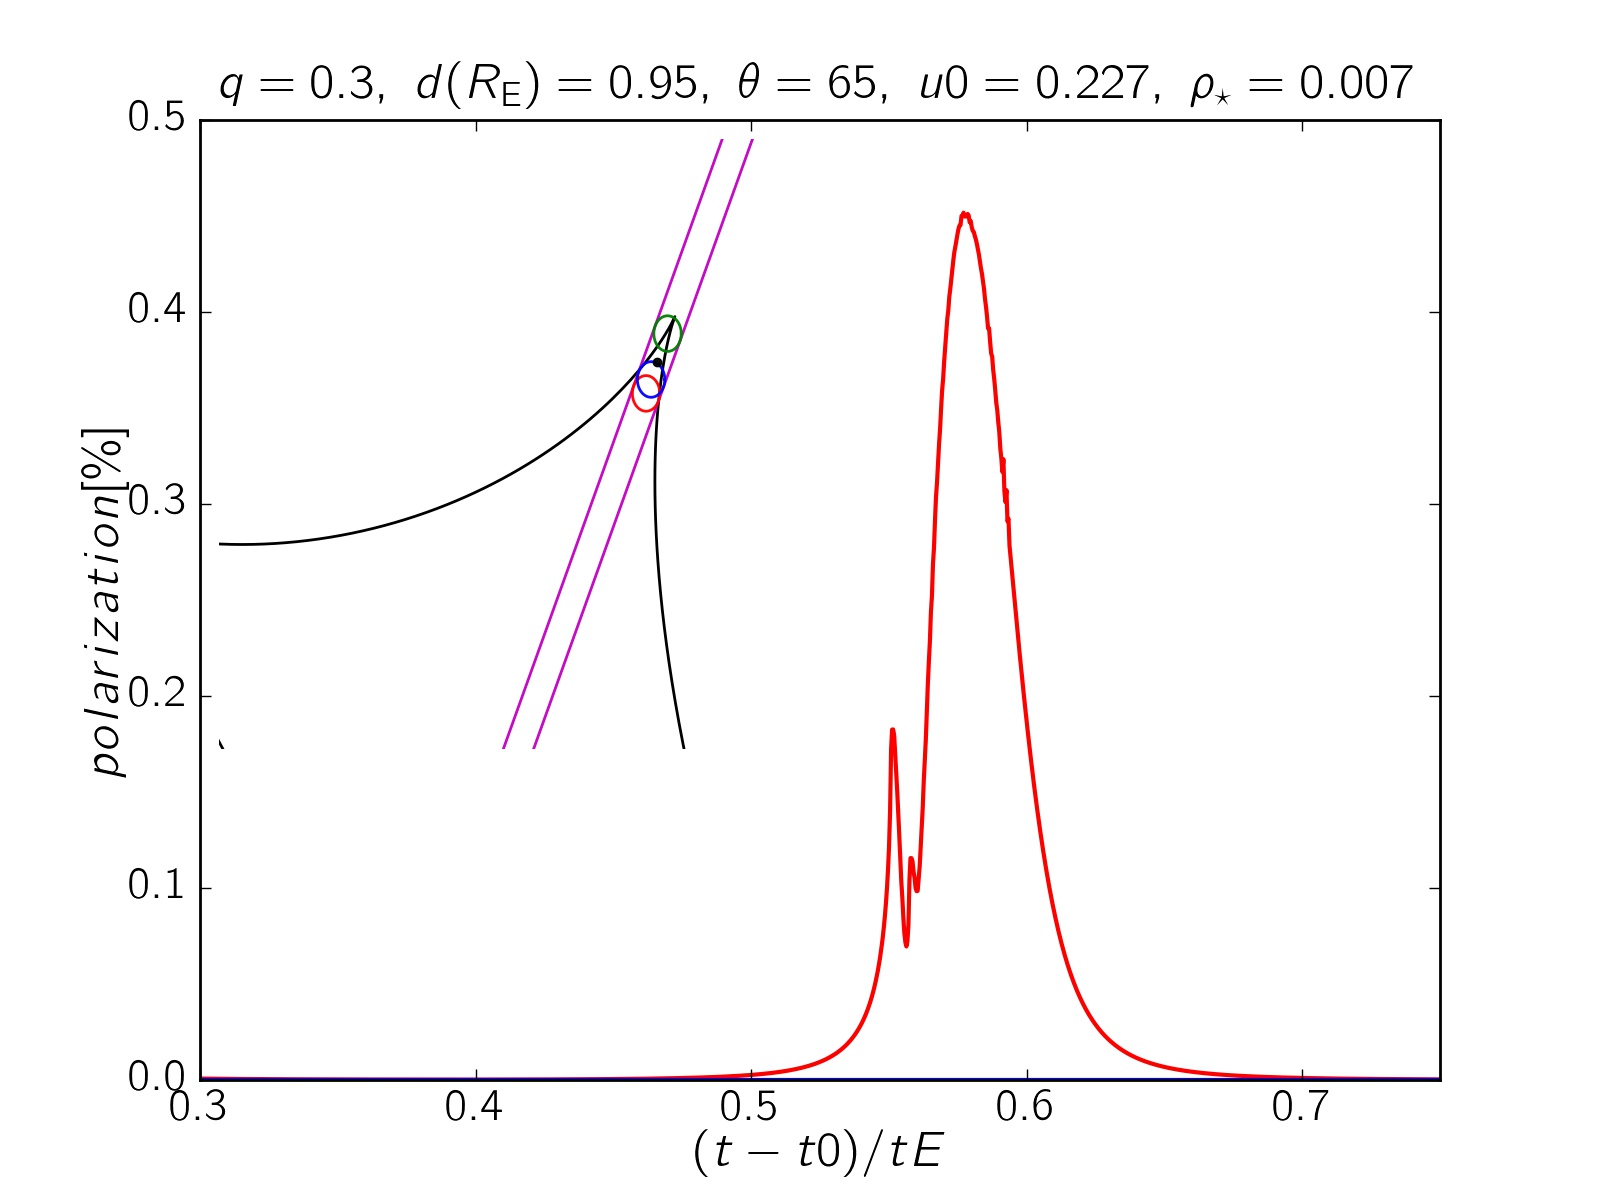
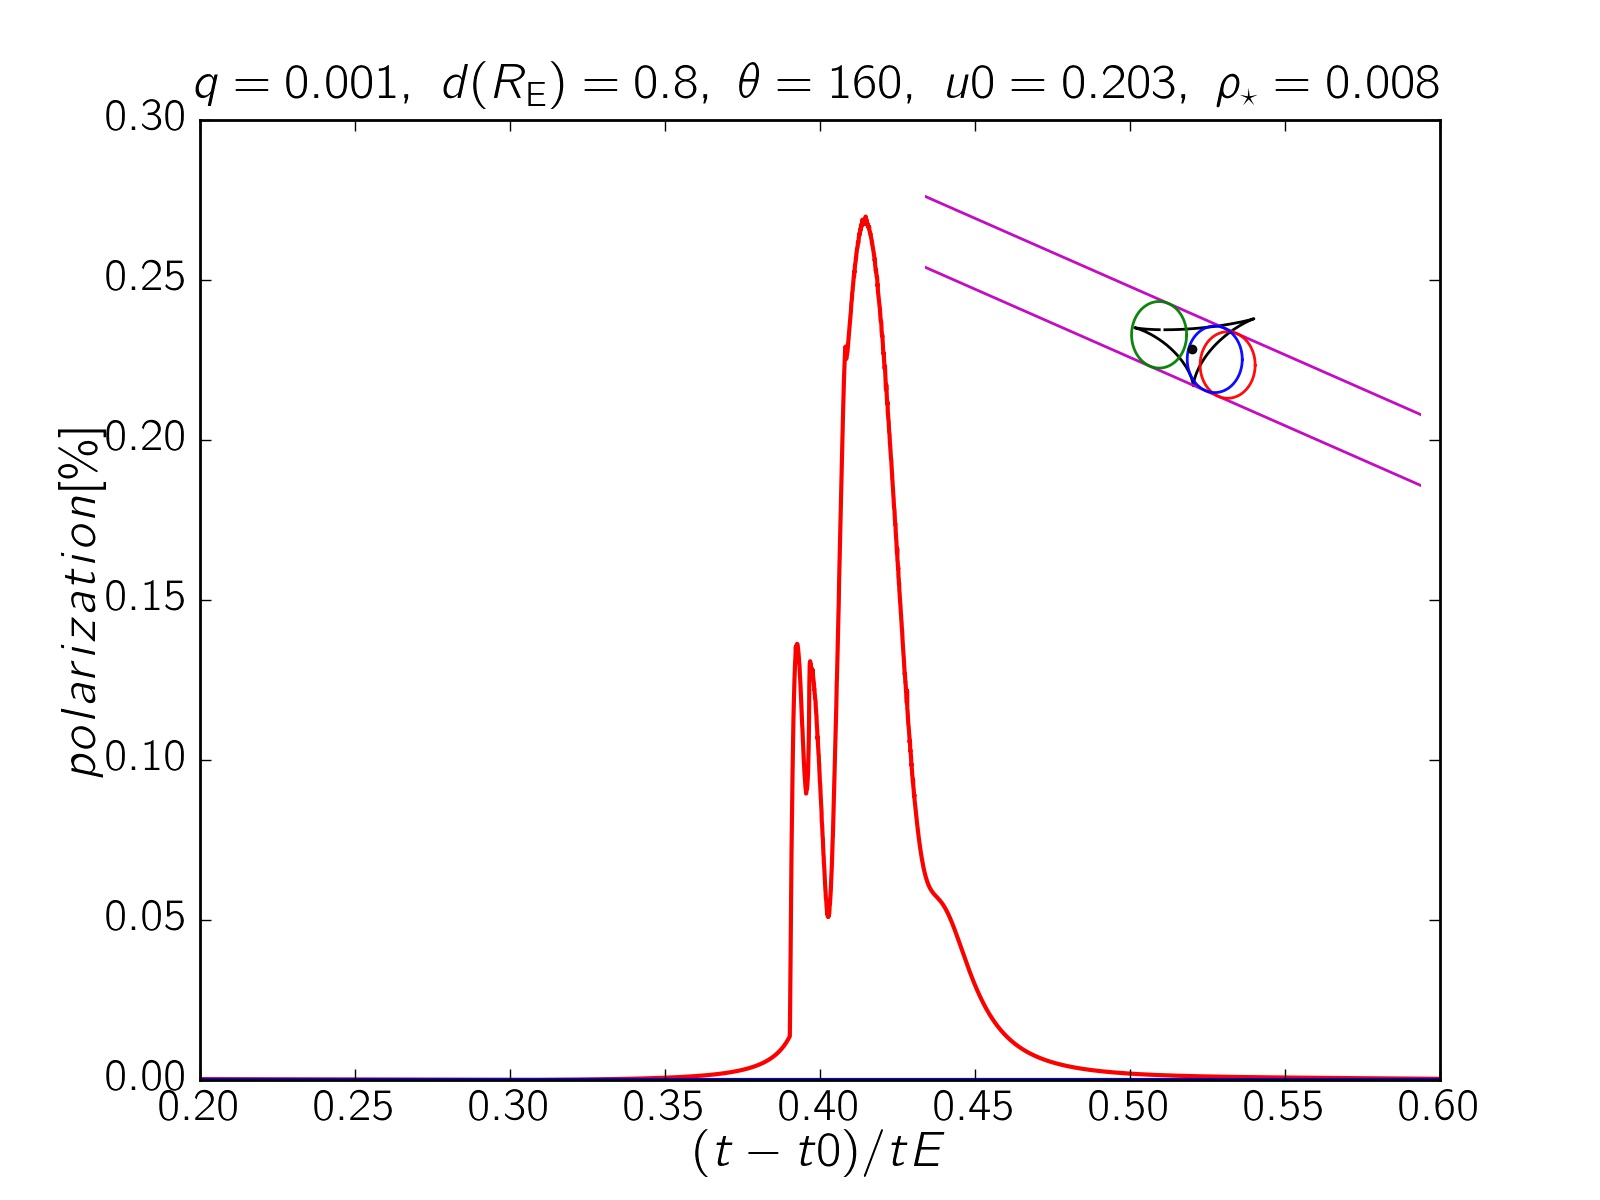
The polarization curve of a star while entering into (extracting from) the fold of a caustic has three peaks, which happens (i) when the first edge of the source is on the caustic line, (ii) when the source center is on the caustic line and (iii) when the last edge of the source star is on the caustic line. The first is the highest, because a small part of the source edge is highly magnified and other parts are not magnified much, which makes the largest asymmetry. The last peak is the smallest, because all of the source points magnify. The middle one is the widest and occurs at the same time of the magnification peak. The time interval between two consecutive peaks is . Hence, the polarization curve during fold caustic crossings lasts about . At the time of the middle peak, the polarization angle differs from that at the time of other peaks by . Figure (5) shows four polarization curves of fold-crossing microlensing events. The green, red and blue circles show the source rings at the time of the highest, widest and smallest polarization peaks.
In the panel 5, the source star is traveling from the connection line between two caustic curves. In that case we have three polarization peaks. The middle one occurs at the same time of the magnification peak. Their size and time intervals depend on the angle between the source trajectory and the connection line. For symmetric cases, i.e., when the source trajectory is normal to the connection line, (i) the middle peak is the highest and two side peaks have symmetric shapes and at the same time intervals with respect to the middle. (ii) The polarization angle from the first peak to the second peak changes by and from the second one to the last one changes by .
2.4 Polarization in cusp caustic crossings
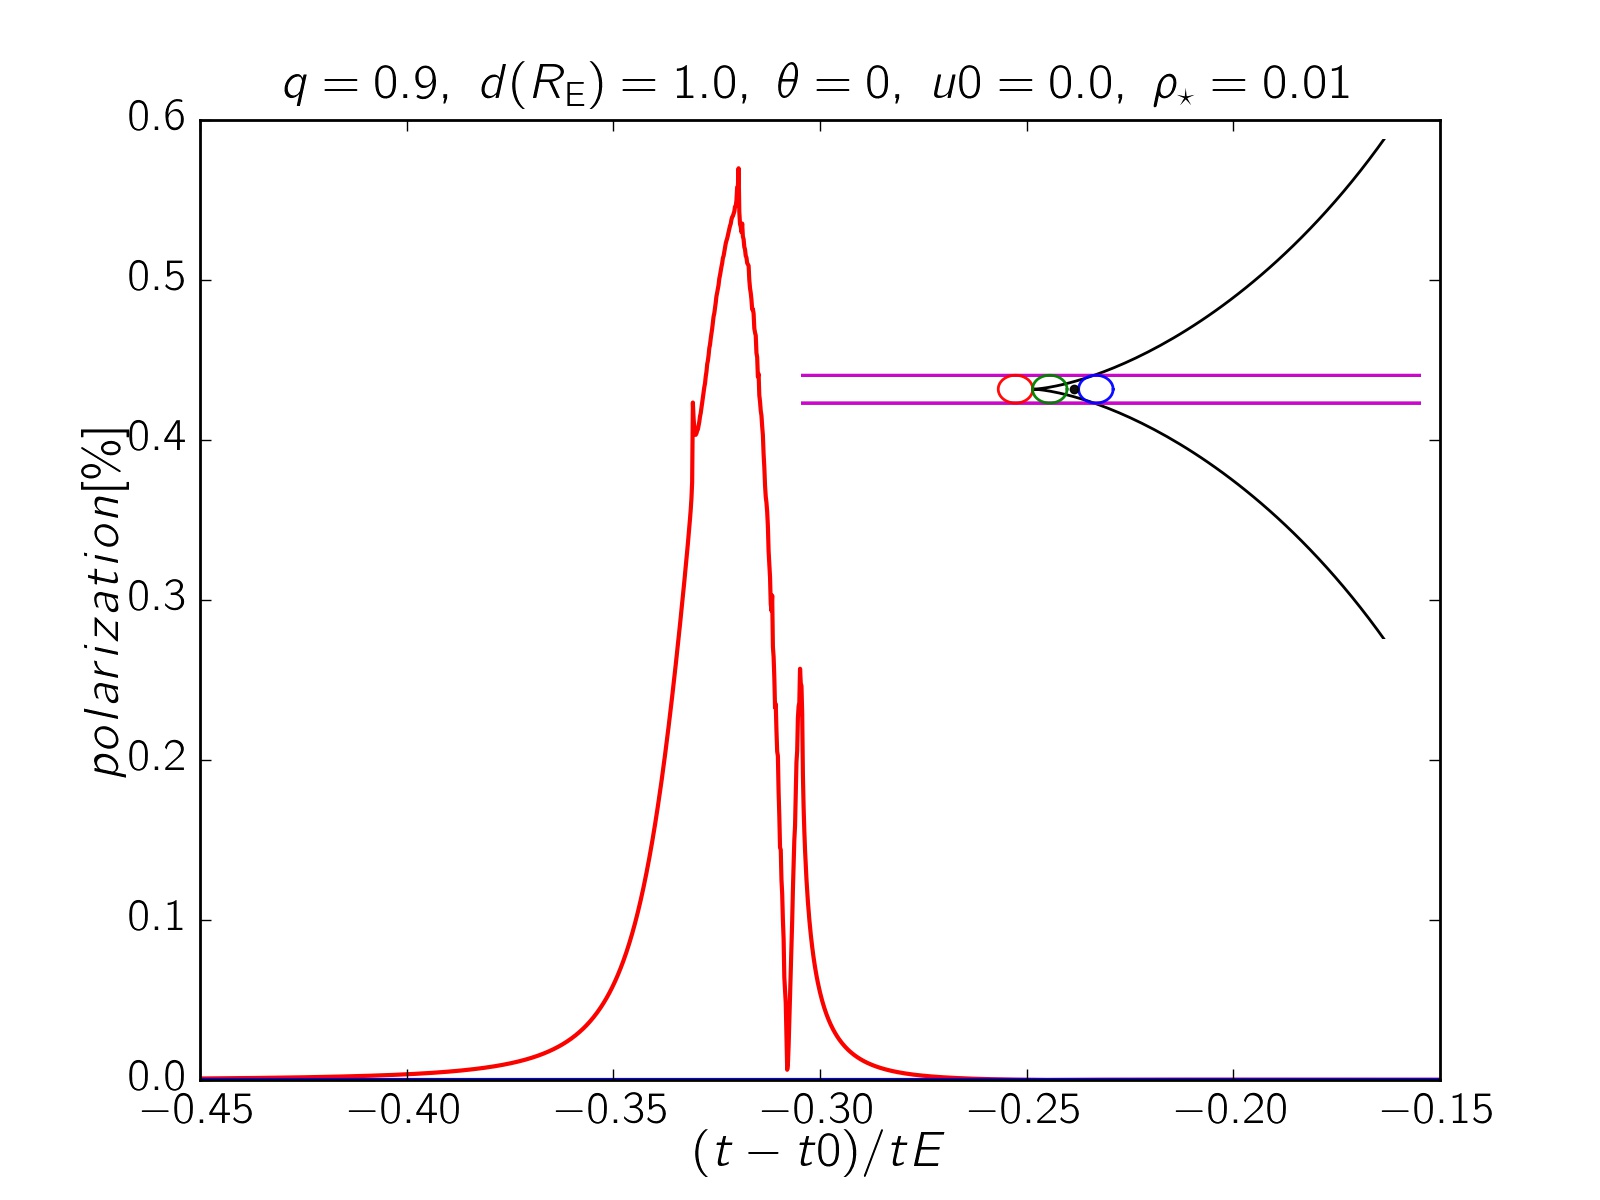
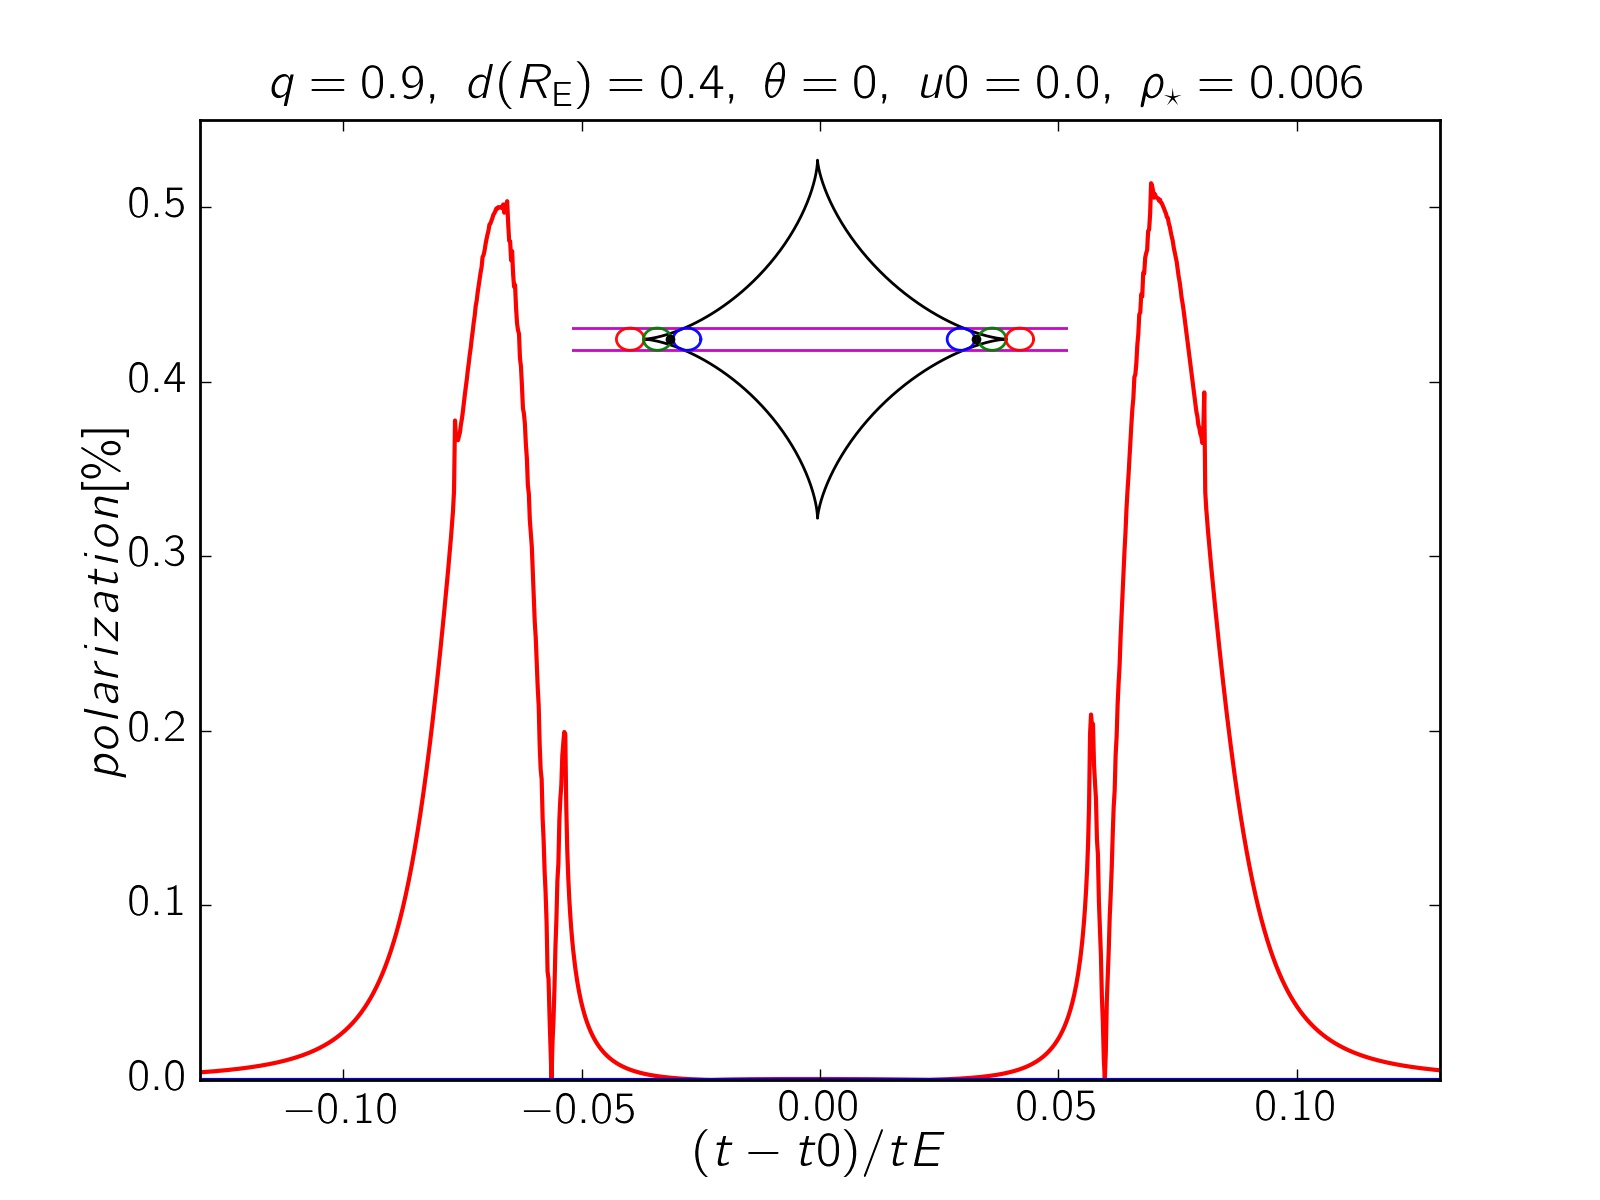
While cusp caustic crossings all polarization curves have similar behaviors. In Figure (6), we show four examples of polarization curves for binary-lens microlensing events with cusp caustic crossings. In the panels 6 and 6 the source trajectories pass on the symmetric axis of cusps (which divides the cusps into two symmetric parts) and in the two others panels the source trajectories do not coincide on the symmetric axes of cusps.
Two first polarization curves have the same behaviors. They have three peaks. The first peak is very small and occurs at the time when the source edge is on the corner of the cusp and its center is out of the caustic (the source ring at this time is shown as red circle). The second peak is the largest and widest one (main peak) and takes place when the source edge is on the corner of the cusp while its center is inside the caustic (shown as green circles). The polarization angles at the times of these peaks are the same and their time intervals are exactly (green and red circles are tangential). The last one happens when the source is completely inside the caustic curve and its last edges are tangential to the folds which meet at that cusp (shown as blue circles). The polarization angle at the time of this peak differs by from two previous peaks.
The magnification peak in cusp caustic crossings happens at some time between the main and third peaks. The source positions at the time of the maximum magnification signals are shown as filled black circles which is upon the edges of blue circles. Hence, the time interval between the magnification and third polarization peak is . While entering the cusp the magnification peak happens earlier and while existing from the cusp that polarization peak occurs earlier.
In the panel 6, the source trajectory does not coincide on the symmetric axis of the cusp and its polarization curve is somewhat different from ones shown in panels 6 and 6. According to Figure 6, in this asymmetric case the polarization curve has three peaks. The largest and widest one happens when the source edge is on the corner of the cusp and the source center is into the caustic curve, the source at the time of this peak is shown as green circle. This peak is similar to the main peak in symmetric cases. When the source is completely into the caustic curve two other peaks appear: One of them at the time that the source edges are tangential to the folds meet at the cusp (the source ring is shown as a blue circle) and the other at the time of the last connection of the source edge and the folds (shown with red circle). The time of the last peak and its value depends on the source trajectory, its radius and the cusp shape.
The polarization angles at the time of peaks (i) and (ii) differ by . The magnification peak happens with the time interval before (after) the time of the middle peak while entering into (existing from) the cusp.
In the panel 6, the polarization curve when the source size is almost equal to the planetary caustic and the source passes from one of the caustic cusps. Its polarization curve has similar behavior with the polarization curve plotted in the panel 6.
The significant point regarding the polarization curves while cusp caustic crossings is that the polarization signal even at the largest peaks do not reach to one percent for early-type stars, whereas it reaches to one percent or even more while crossing the folds join at the primary’s location. In Figure 5 the source star passes from both fold and cusp of a caustic curve. The highest polarization signal occurs when the source is tangential to the fold for a while. The source star is shown as a green circle at the time of the maximum polarization in this plot.
While fold caustic crossings, the polarization reaches to zero between two consecutive peaks, whereas in the cusp caustic crossings, the polarization between peaks mostly does not achieve to zero.
2.5 Case Study
In this section, we investigate the expected polarization curves for some caustic-crossing microlensing events recently recorded by OGLE, MOA and KMTNet surveys. The source stars of most microlensing events toward the Galactic bulge are either main-sequence or RCG stars. For RCG sources, the local Stokes intensities are given by integrating on the polarization source functions over the line of sight coordinate (Simmons et al., 2002; Ignace et al., 2006). For these stars, the polarization signal linearly depends on the scattering optical depth which is given by:
| (2) |
where is the scattering cross section, indicates the strength of scattering number density of gas and dust in the stellar envelope , which can be described by:
| (3) |
where is the halo (inner) radius of this density function, i.e., for . However, itself depends on the mass loss, and the wind terminal velocity in the stellar atmosphere (Ignace, 2008).
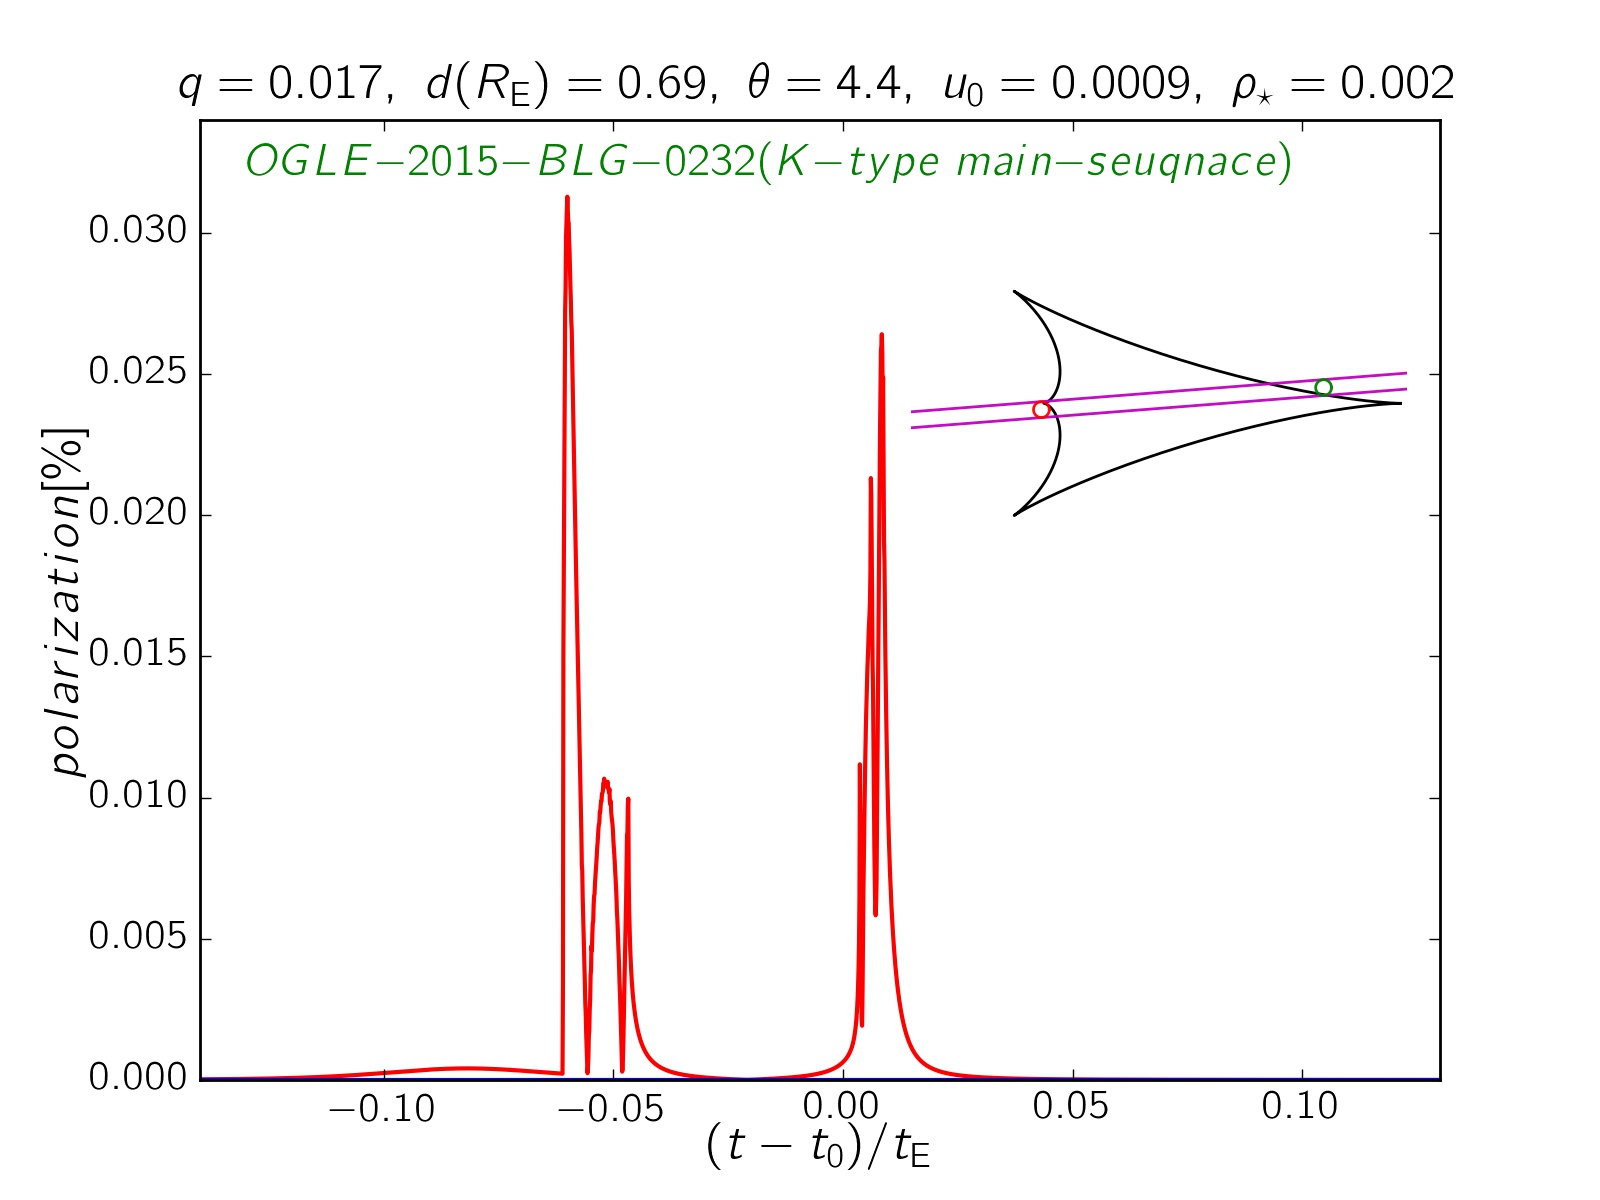
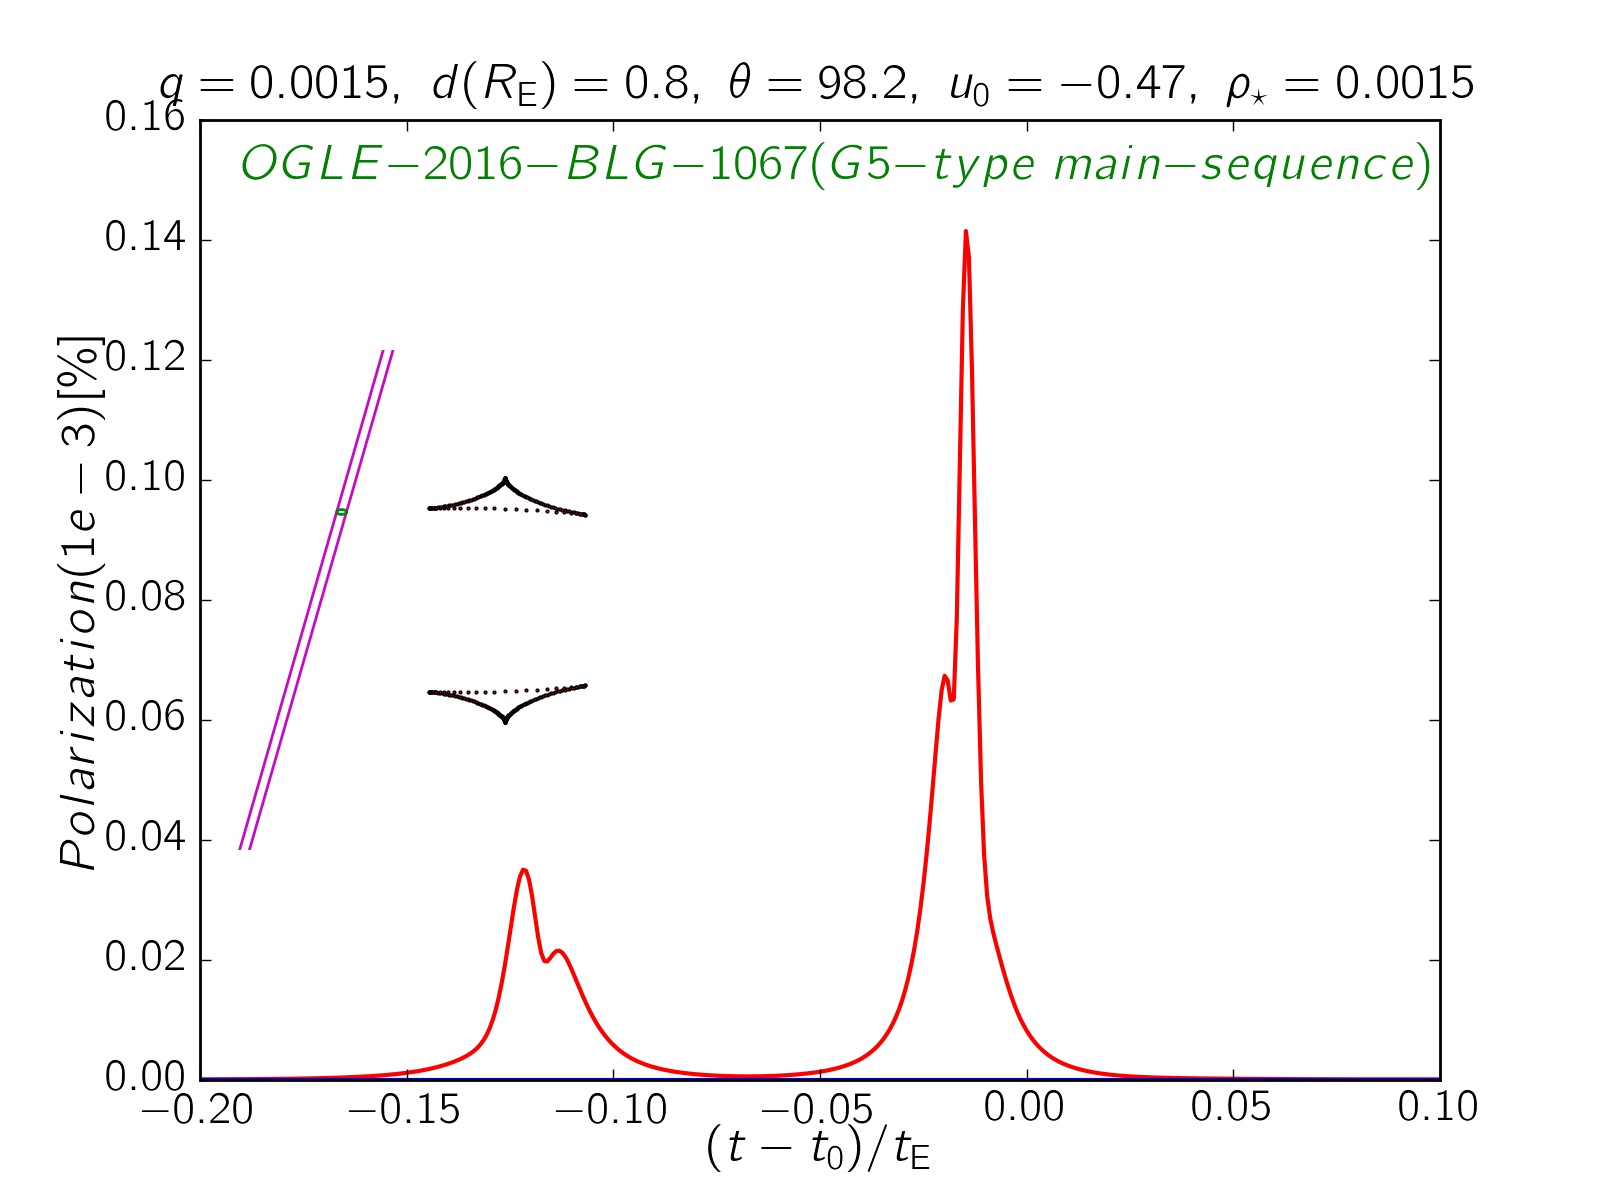
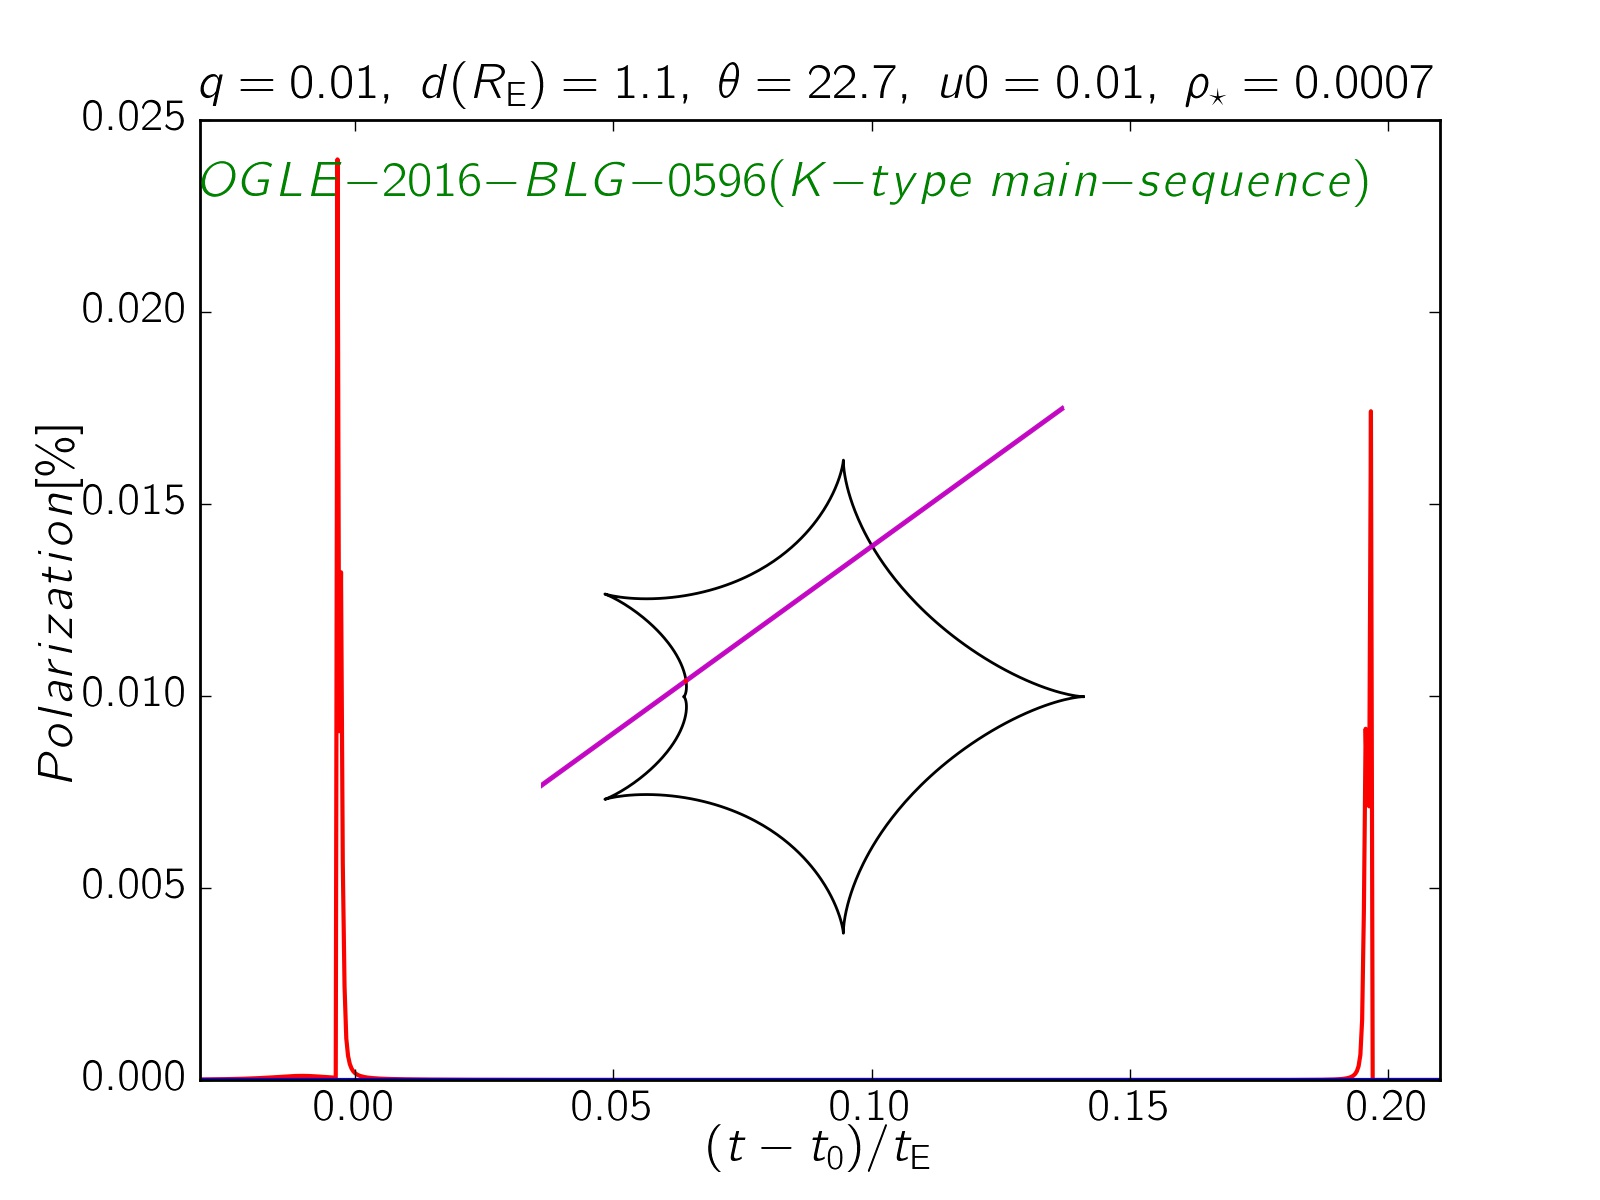
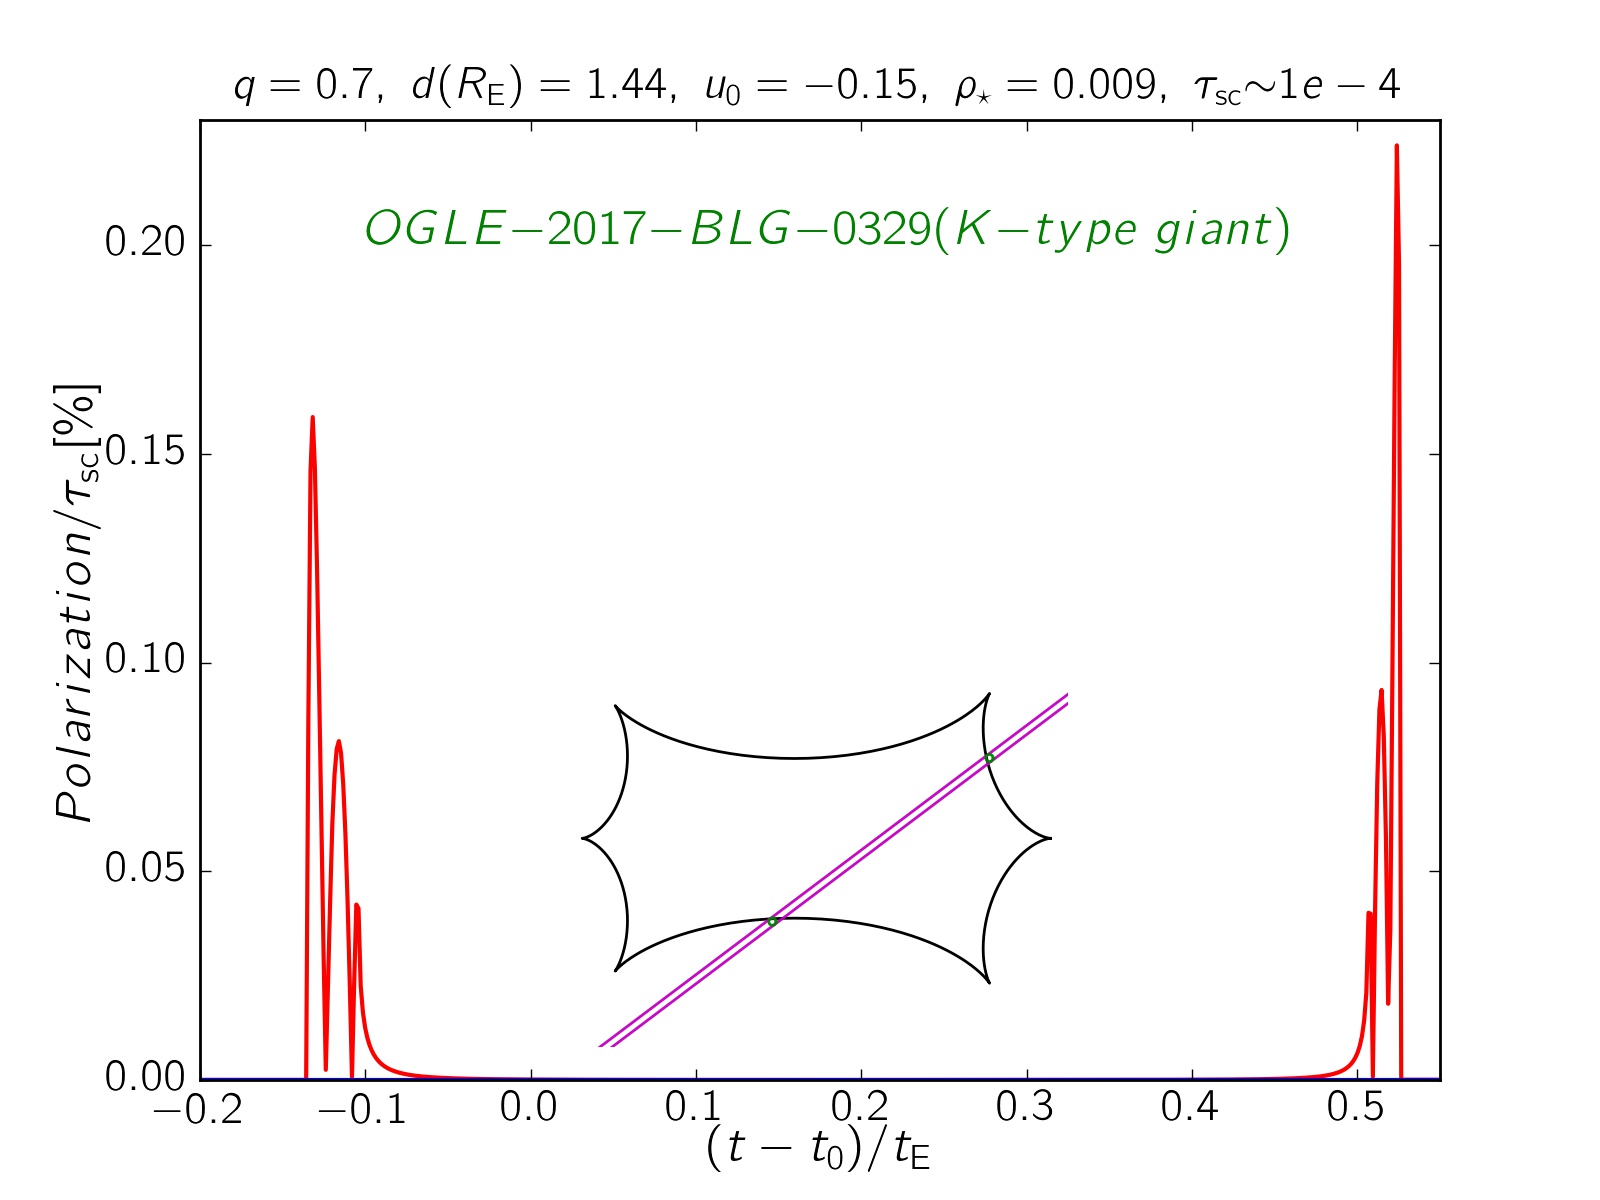
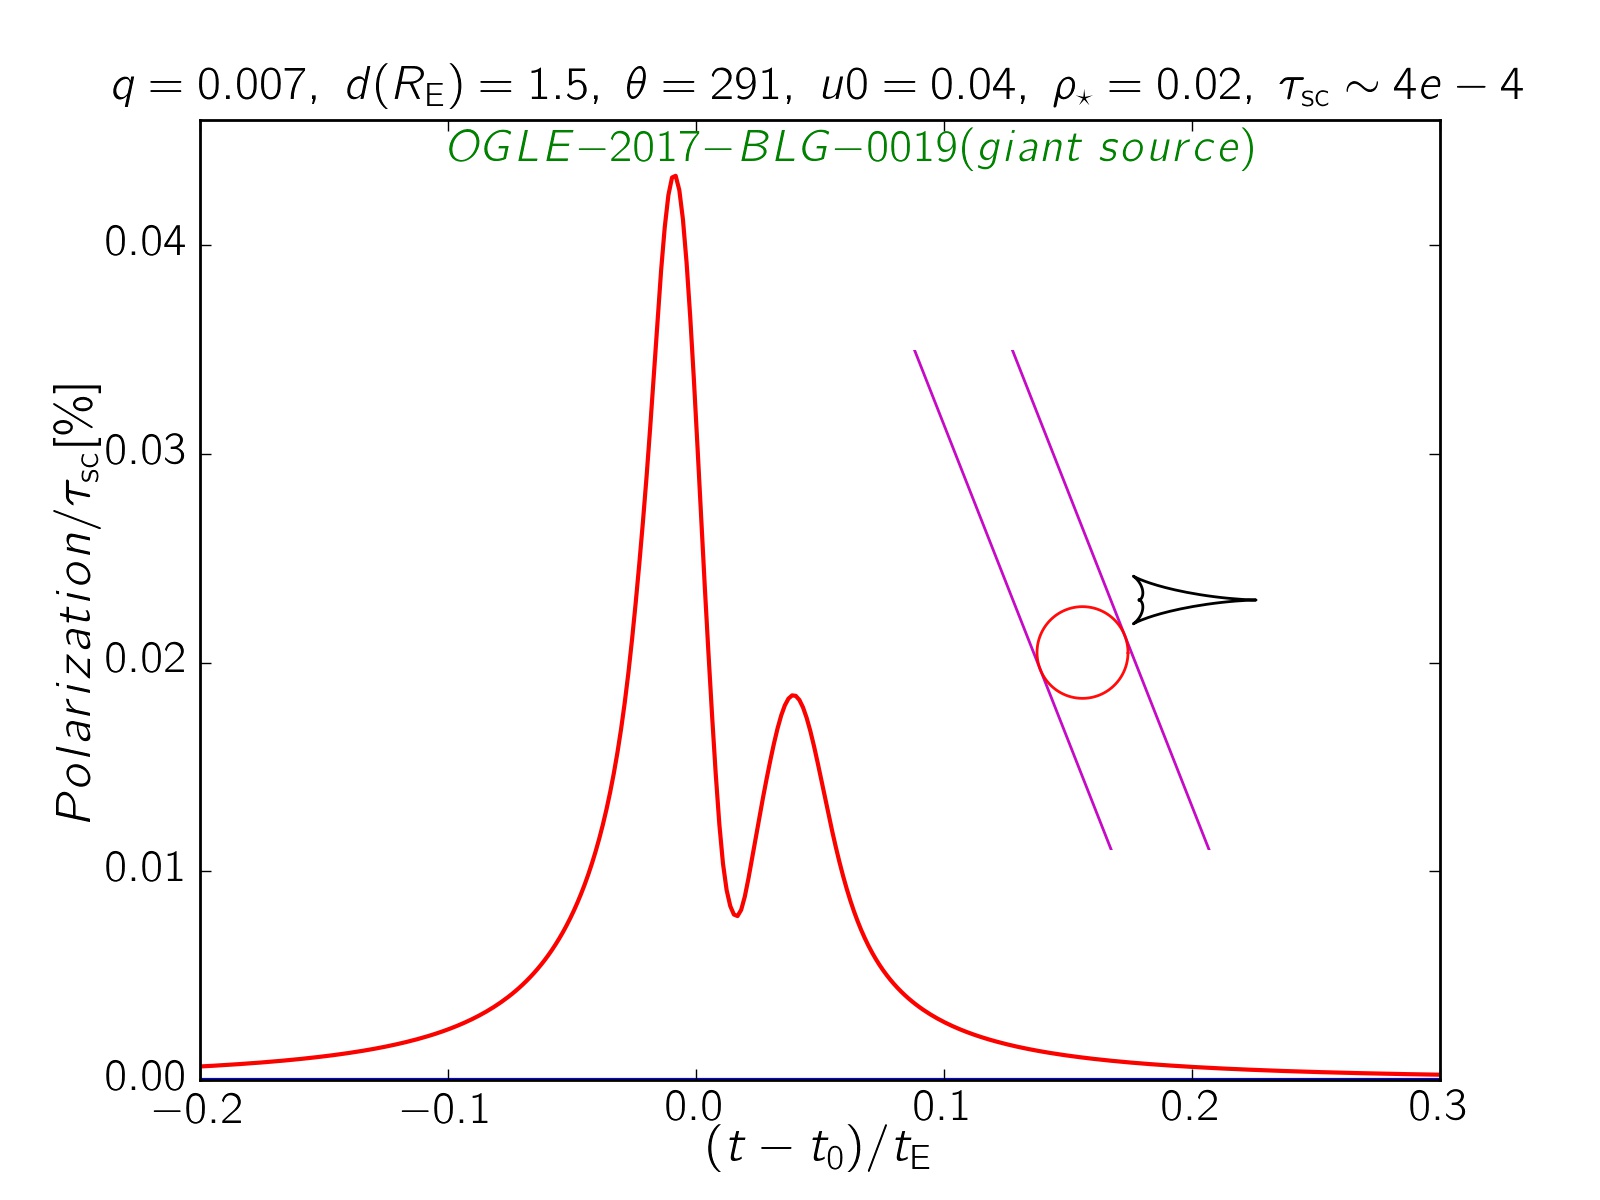
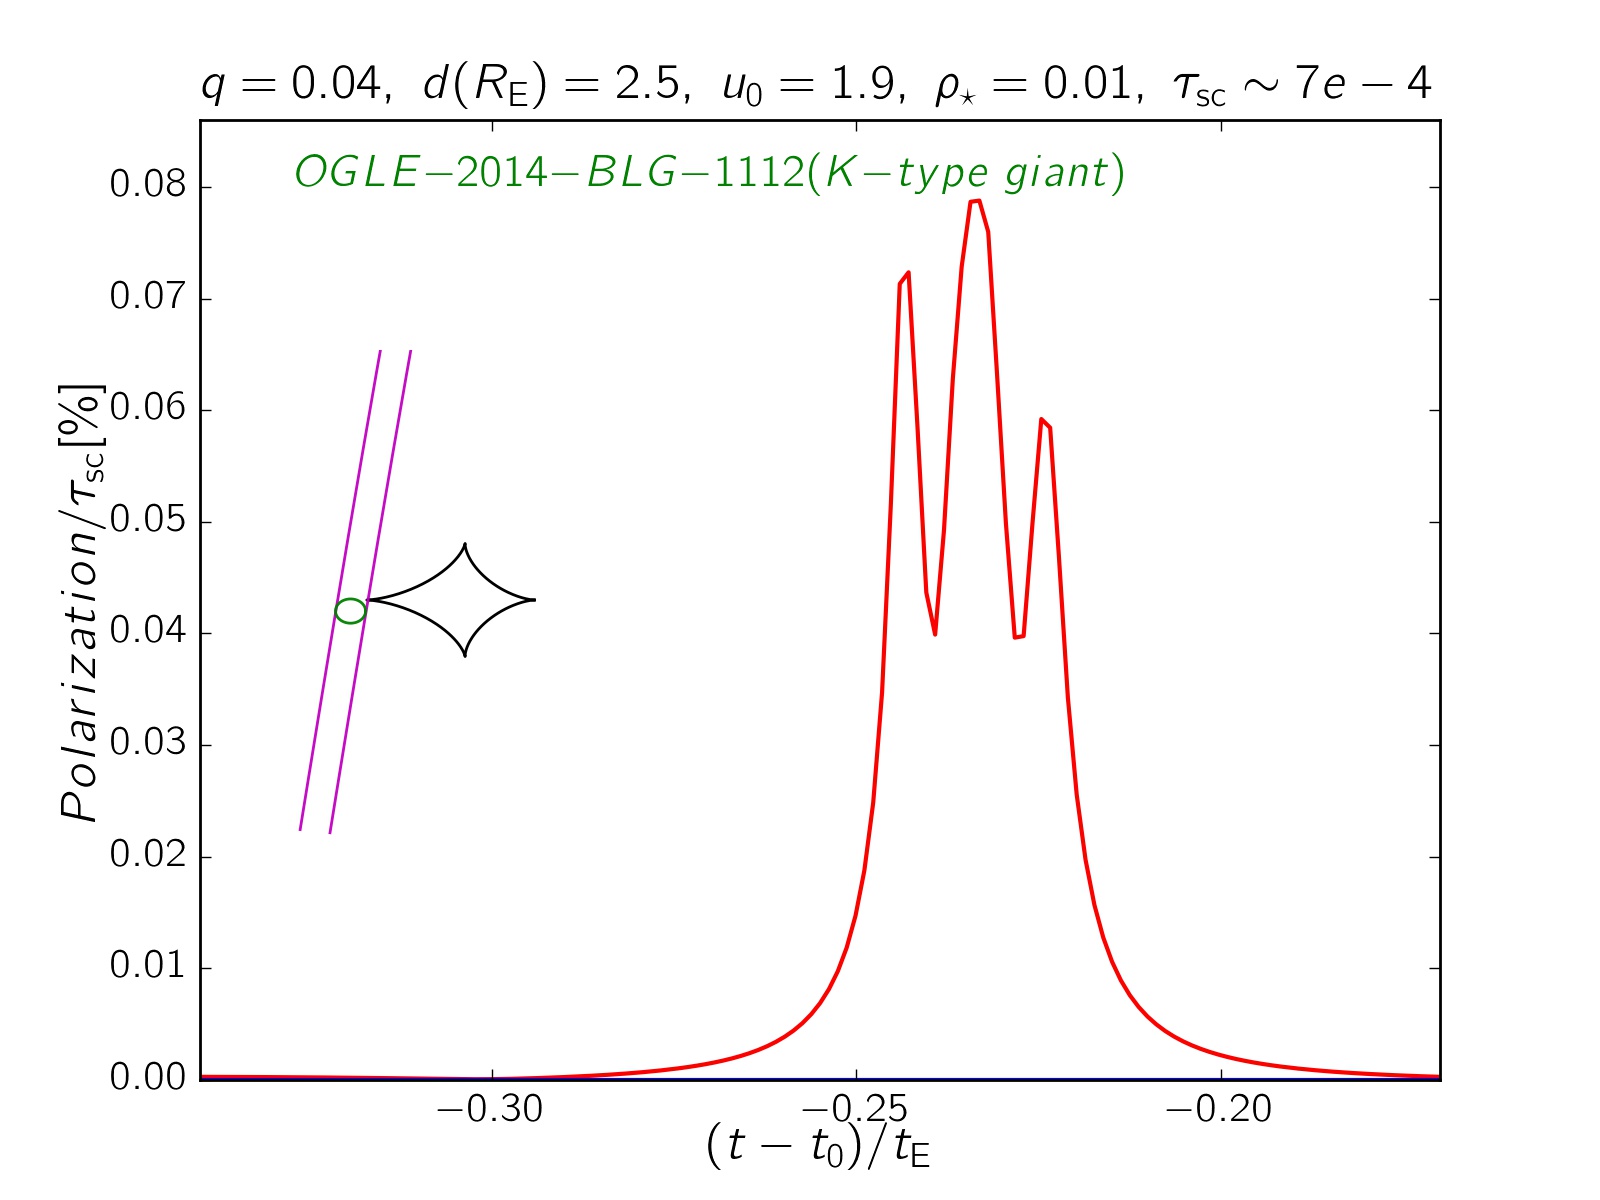
For main-sequence stars, the limb-darkening coefficients strongly depends on the stellar surface temperature which specifies the contributions of Rayleigh and Thomson scatterings (Claret, 2004). More details about their polarization profiles can be found in Ingrosso et al. (2012). Here, we use their models to evaluate the expected polarization curves of six caustic-crossing and confirmed microlensing events. These curves are represented in Figure (7).
The First microlensing event is --- which was characterized by Bachelet et al. (2019). It is a binary-lens microlensing event of a -type and main-sequence star. In this event, the source passes close to the location of the primary. At the time when the source disk is shown with red circle, the polarization signal reaches to .
The second microlensing event is --- whose source is a -type main-sequence star (Calchi Novati et al., 2019). In this event, there is no caustic crossings and the source just travels close to the planetary caustics. The maximum polarization signal, i.e., , is too low to be detected with nowadays polarimeters, e.g., the FOcal Reducer and low dispersion Spectrograph (FORS2) polarimeter at Very Large Telescope (VLT) telescope with the polarimetry accuracy .
The next selected microlensing event is ---, a high-magnification binary microlensing event. This event was characterized by Mróz et al. (2017). The source star is a -type main-sequence star with the apparent magnitude . The highest polarization peak makes when the source edge is tangential to the fold. Noting that the time scale of polarization peaks, , is short, because of small source size.
The fourth microlensing event is --- which was studied by Han et al. (2018). The source star is a -type giant star with the apparent magnitude at the distance . Its absolute magnitude is , so its scattering optical depth is . 555We estimate the -band extinction in the direction of each microlensing event and at the source distances as explained in Sajadian & Poleski (2019) and the scattering optical depth according to Figure (3) of Ingrosso et al. (2015). The vertical axis of this plot is the expected polarization signal normalized to the scattering optical depth. In each fold crossing three polarization peaks produce which are obvious in this plot.
The next event is a binary-lens microlensing of a red giant source, ---. We use the best fitted model recorded by V. Bozza in -model 666http://www.fisica.unisa.it/gravitationAstrophysics/RTModel/2017/OB170019_X1.pdf. The source star should be a red giant, because of its large size, i.e., . Its apparent magnitude is and the scattering optical depth is .
The last event is ---. This event is a binary microlensing event of a -type giant star (Han et al., 2017). The apparent magnitude of the source star is . The absolute magnitude of the source star is which results the scattering optical depth . In this event the source passes very close to the cusp but does not cross it.
Accordingly, most of caustic crossing microlensing events toward the Galactic bulge whose source stars are RGB or main-sequence do not produce enough high polarization signal to be detected with nowadays polarimeters.
3 Summary and conclusions
In this work, we reconsidered the polarization in binary-lens and caustic-crossing microlensing events. In this regard, we introduced the polarization maps which indicated the polarization signal of a source star at every given position projected on the lens plane. These maps display where the polarization signals maximize in binary-lens microlensing events which in turn helps to find the best candidates of on-going binary microlensing events for polarimetry follow-up observation in near future.
According to different polarization maps, when the source radius is sufficiently smaller than the caustic, the highest polarization signal happens when the source is passing the folds which meet at the nearest cusp to the location of the primary. However, while fold caustic crossings three polarization peaks take place at the times when the source edge is tangential to the fold (while fold caustic crossings it happens two times) and when the source center is on the fold. The highest one is when the source edge is upon the fold and its center is out of the caustic. Noting that the maximum magnification signals happen when the source center crosses the on-axis cusp close to the primary.
On the connection line between caustic curves the polarization is considerable, although it is not as high as while the fold caustic crossings. When a source star is crossing this line, three polarization peaks form. While the source passes normal to it, (i)the largest peak takes place when the source center is upon the connection line, (ii) the polarization angle at the time of the largest peak differs by from those at the times of other peaks.
When the source is quite into the caustic curve, there is no considerable polarization signal, although the magnification factor is high. In that case, all points of the source surface are magnified and there is no remarkable symmetry breaking.
When the source size is on the order of the caustic or larger than it, the locus of the source positions with highest polarization signals () make a circular ring whose center is on the primary’s position. Its radius is somewhat smaller than the source radius (). The larger source radius, the higher polarization signal over this ring.
While cusp caustic crossings the behavior of polarization curves depends on the source trajectory with respect to the symmetric axis of cusps. Generally, while cusp crossings there are three polarization peaks, the main (largest and widest) peak always happens when the source center is into the caustic curve and its edge is on the corner of the cusp. One (or two) smaller and narrower peak(s) forms when the source is into the caustic and its edge(s) is tangential to the folds meet at the cusp. When the source passes on the symmetry axis of the cusp, there is a very small peak at the time that the source is completely is out of the caustic and its last edge is upon the corner of the cusp.
The time interval between the magnification peak and one of small polarization peaks which appears at the first time that the source is completely inside the caustic (two edges of the source are tangential to the folds) is exactly .
Acknowledgment I thank R. Ignace and J. P. Harrington for useful comments and also the anonymous Referee for his/her helpful comments and suggestions. The work by the author was supported by a grant (95843339) from the Iran National Science Foundation (INSF).
References
- Agol (1996) Agol E., 1996, MNRAS, 279, 571
- Bachelet et al. (2019) Bachelet E., et al., 2019, ApJ, 870, 11
- Bogdanov et al. (1996) Bogdanov M. B., Cherepashchuk A. M., Sazhin M. V., 1996, Ap&SS, 235, 219
- Bozza (2010) Bozza V., 2010, MNRAS, 408, 2188
- Bozza et al. (2018) Bozza V., Bachelet E., Bartolić F., Heintz T. M., Hoag A. R., Hundertmark M., 2018, MNRAS, 479, 5157
- Calchi Novati et al. (2019) Calchi Novati S., et al., 2019, AJ, 157, 121
- Chandrasekhar (1960) Chandrasekhar S., 1960, Radiative Transfer. New York : Dover Publications
- Chen et al. (1998) Chen S.-Y., Maksimchuk A., Umstadter D., 1998, Nature, 396, 653
- Chung et al. (2005) Chung S.-J., et al., 2005, ApJ, 630, 535
- Claret (2004) Claret A., 2004, A&A, 428, 1001
- Dominik (2004) Dominik M., 2004, MNRAS, 353, 118
- Gaudi (2012) Gaudi B. S., 2012, ARA&A, 50, 411
- Gaudi & Petters (2002a) Gaudi B. S., Petters A. O., 2002a, ApJ, 574, 970
- Gaudi & Petters (2002b) Gaudi B. S., Petters A. O., 2002b, ApJ, 580, 468
- Han et al. (2017) Han C., et al., 2017, ApJ, 843, 87
- Han et al. (2018) Han C., et al., 2018, ApJ, 859, 82
- Harrington (2017) Harrington J. P., 2017, Nature Astronomy, 1, 657
- Ignace (2008) Ignace R., 2008, in Manchester Microlensing Conference. p. 27 (arXiv:0804.2176)
- Ignace et al. (2006) Ignace R., Bjorkman J. E., Bryce H. M., 2006, MNRAS, 366, 92
- Ingrosso et al. (2012) Ingrosso G., Calchi Novati S., De Paolis F., Jetzer P., Nucita A. A., Strafella F., Zakharov A. F., 2012, MNRAS, 426, 1496
- Ingrosso et al. (2015) Ingrosso G., Calchi Novati S., De Paolis F., Jetzer P., Nucita A. A., Strafella F., 2015, MNRAS, 446, 1090
- Lanz & Hubeny (2003) Lanz T., Hubeny I., 2003, ApJS, 146, 417
- Lanz & Hubeny (2007) Lanz T., Hubeny I., 2007, ApJS, 169, 83
- Mróz et al. (2017) Mróz P., et al., 2017, AJ, 153, 143
- Sajadian (2015) Sajadian S., 2015, MNRAS, 452, 2587
- Sajadian & Hundertmark (2017) Sajadian S., Hundertmark M., 2017, ApJ, 838, 157
- Sajadian & Poleski (2019) Sajadian S., Poleski R., 2019, ApJ, 871, 205
- Sajadian & Rahvar (2015) Sajadian S., Rahvar S., 2015, MNRAS, 454, 4429
- Schneider & Wagoner (1987) Schneider P., Wagoner R. V., 1987, ApJ, 314, 154
- Simmons et al. (1995a) Simmons J. F. L., Newsam A. M., Willis J. P., 1995a, MNRAS, 276, 182
- Simmons et al. (1995b) Simmons J. F. L., Willis J. P., Newsam A. M., 1995b, A&A, 293
- Simmons et al. (2002) Simmons J. F. L., Bjorkman J. E., Ignace R., Coleman I. J., 2002, MNRAS, 336, 501
- Skowron & Gould (2012) Skowron J., Gould A., 2012, arXiv[astro-ph.EP]: 1203.1034,
- Tinbergen (1996) Tinbergen J., 1996, Astronomical Polarimetry
- Wyrzykowski et al. (2015) Wyrzykowski Ł., et al., 2015, ApJS, 216, 12
- Yoshida (2006) Yoshida H., 2006, MNRAS, 369, 997
- Young (1981) Young A. T., 1981, Appl. Opt., 20, 533
Appendix A Photometry maps
In order to compare the magnification and polarization behaviors in binary-lens microlensing events, in Figures (8) and (9) we represent the magnification maps on the lens planes for different binary-lens configurations. Their corresponding polarization maps are plotted in Figure (2) and (3), respectively.
