Black Hole – Galaxy Correlations in Simba
Abstract
We examine the co-evolution of galaxies and supermassive black holes in the Simba cosmological hydrodynamic simulation. Simba grows black holes via gravitational torque-limited accretion from cold gas and Bondi accretion from hot gas, while feedback from black holes is modeled in radiative and jet modes depending on the Eddington ratio (). Simba shows generally good agreement with local studies of black hole properties, such as the black hole mass–stellar velocity dispersion () relation, the black hole accretion rate vs. star formation rate (BHAR–SFR), and the black hole mass function. evolves such that galaxies at a given have higher at higher redshift, consistent with no evolution in . For , is anti-correlated with since the BHAR is approximately independent of , while at higher masses flattens and has a larger scatter. BHAR vs. SFR is invariant with redshift, but drops steadily with time at a given , such that all but the most massive black holes are accreting in a radiatively efficient mode at . The black hole mass function amplitude decreases with redshift and is locally dominated by quiescent galaxies for , but for star forming galaxies dominate at all . The distribution is roughly lognormal with a peak at as observed, shifting to higher at higher redshifts. Finally, we study the dependence of black hole properties with H i content and find that the correlation between gas content and star formation rate is modulated by black hole properties, such that higher SFR galaxies at a given gas content have smaller black holes with higher .
keywords:
galaxy evolution – black holes – active galactic nuclei1 Introduction
During periods of strong activity, accreting supermassive black holes (SMBHs) can be optically identified at the nuclei of their host galaxies, and are referred to as active galactic nuclei (AGN). Optical spectroscopic surveys are able to detect a large number of AGN, albeit being biased toward the brighter and less obscured AGN. X-rays are considered the most reliable method of AGN identification, particularly hard X-rays, owing to a significant reduction in obscuration (Rosas-Guevara et al., 2016). Upcoming radio surveys such as MIGHTEE (The MeerKAT International GHz Tiered Extragalactic Exploration Survey; Jarvis et al. 2016) will likewise greatly assist in identifying AGN regardless of obscuration out to high redshifts. Complementary multi-wavelength data enables characterisation of key host galaxy properties such as stellar masses and star formation rates. By examining the relationship between AGN and galaxy properties across cosmic time, we can constrain models and assemble a more comprehensive picture of the co-evolution of galaxies and their central black holes.
It has long been recognised that SMBH properties correlate with larger-scale properties of their host galaxies. Relations between the black hole mass and properties such as the galaxy stellar mass (Kormendy & Ho, 2013), bulge mass (Häring & Rix, 2004), bulge luminosity (Shankar et al., 2004), velocity dispersion (Ferrarese & Merritt, 2000), sérsic index (Graham et al., 2007), and core size of massive ellipticals (Thomas et al., 2016) all show fairly tight relations. There is also substantial evidence that the cosmic history of star formation rate and the evolution of global black hole accretion rate evolve quite similarly (Aird et al., 2010; Rodighiero et al., 2010, 2015; Anglés-Alcázar et al., 2015) showing that galaxies and black holes grow together, albeit with large scatter in individual cases.
A more detailed examination highlights various ways in which galaxies are impacted by their SMBHs. Kormendy & Ho (2013) showed that SMBHs correlate tightly with only classical bulges and elliptical galaxies, not with disk properties, suggesting that the processes creating bulges such as mergers may also drive SMBH growth. However, this connection is much less clear at during what is sometimes called the “quasar era". At that time, the largest SMBHs grow via radiatively efficient accretion, in contrast to locally () where the most efficient SMBH growth happens in lower mass systems. Heckman & Best (2014) reviewed the general population of black hole-galaxy correlations to quantify where the local population of black holes reside. They divide AGN into two populations, “jet" and “radiative" mode AGN, corresponding to low- and high accretion efficiencies, respectively. They find that jet-mode AGN (roughly, AGN with Eddington ratios ) are generally large black holes that reside in massive quenched early-type galaxies, whereas radiative mode AGN arise from moderate sized black holes in large galaxies that often still have some disk component and a pseudobulge (Type 2 Radio Quiet AGN), and that have significant star formation. They also find that the growth of SMBHs occurs predominantly in moderately massive galaxies () with young stellar populations.
The importance of black holes in galaxy formation models has grown substantially in recent years owing to the realisation that they are the most likely drivers for galaxy transformation from star-forming spirals to quenched ellipticals (e.g. Somerville & Davé, 2015). Models that aim to understand global galaxy–black hole co-evolution must first be shown to reproduce observed galaxy population trends within a cosmological context, in order to be physically plausible. This has long been a major challenge for galaxy formation models.
Pioneering work by Springel et al. (2005a) and Di Matteo et al. (2005) incorporated black hole growth and associated feedback into hydrodynamical galaxy formation simulations. Their simulations were able to efficiently grow black holes during galaxy mergers, and the energetic AGN feedback injected thermally was able to clear out the gas and leave a quenched galaxy. By extrapolating results from a library of merger simulations, Hopkins et al. (2006) was able to show that the resulting properties matched a number of key galaxy–black hole observables. The resulting scenario highlighted the importance of mergers in driving rapid growth of both the bulge and black hole, culminating in a final short-lived quasar phase that blows out the remaining gas (Hopkins et al., 2007). Di Matteo et al. (2008) incorporated this model into cosmological runs, which was broadly successful at reproducing galaxy–black hole correlations. However, the feedback from the black holes was ultimately unable to sufficiently quench star formation to the extent required to match observed massive galaxies.
Semi-analytic models (SAMs) of galaxy formation also included black holes and associated feedback in order to quench galaxies. In contrast to the merger-driven scenario, in SAMs quenching was found to be effective when enacted via heating of halo gas (Croton et al., 2006; Bower et al., 2006), called “radio mode" or “maintenance mode" feedback (Somerville et al., 2008). It was found that mergers were not sufficiently frequent and did not release sufficient energy to keep galaxies fully quenched, which was later confirmed using cosmological hydrodynamic simulations (Gabor & Davé, 2012, 2015). Thus the dominant mode for how black holes grow, and how they impact their host galaxies in order to reproduce observed scaling relations, remained controversial.
Over the last five years there has been substantial work in improving models for black hole feedback in hydrodynamic simulations. The key observables that simulations aimed to reproduce are the numbers of quenched galaxies and the exponential cutoff in the stellar mass function, while simultaneously reproducing black hole–galaxy scaling relations. The Illustris simulation (Vogelsberger et al., 2014; Genel et al., 2014) was able to produce some quenched galaxies (Sijacki et al., 2015) by turning up the feedback strength relative to Di Matteo et al. (2008), but was not able to reproduce the correct colour distribution or produce an exponential cutoff, and moreover too strongly evacuated massive halos of their gas (Genel et al., 2014). The EAGLE simulation (Schaye et al., 2015) employed quite a different feedback model, and was able to reproduce both a bimodal colour distribution (Trayford et al., 2017) and a reasonable mass function. Illustris-TNG (Springel et al., 2018) improved upon Illustris’s feedback model by including two-mode feedback (Weinberger et al., 2018) reminiscent of observations (Best & Heckman, 2012), yielding galaxy properties similar to those observed. All these simulations, however, assumed that the black hole feedback was spherical or quasi-spherical; in contrast, the Horizon-AGN simulation (Dubois et al., 2012; Dubois et al., 2014; Volonteri et al., 2016) used bipolar feedback that is more reminiscent of observed AGN feedback, but were unable to produce sufficiently quenched massive galaxies.
All the above simulations modeled black hole growth via Bondi-Hoyle-Lyttleton accretion (Hoyle & Lyttleton, 1939; Bondi & Hoyle, 1944; Bondi, 1952) or variations thereof (Dubois et al., 2012; Choi et al., 2012; Rosas-Guevara et al., 2015). Owing to Bondi accretion’s squared dependence on the mass of the SMBH, black hole growth must be self-regulated by feedback from the black hole itself in order to avoid runaway growth (Anglés-Alcázar et al., 2015). This self-regulation is difficult to achieve without quasi-spherical feedback, yet observations of black hole feedback from jets or outflows generally show bipolar feedback. It is worth noting that even feedback that is implemented spherically at small scales can result in bipolar outflows on larger scales, owing to collimation by the surrounding gas.
The recent Simba simulation (Davé et al., 2019) employed a different model for black hole growth and feedback. Simba’s model is based on the idea that torques owing to disk instabilities are responsible for dissipating angular momentum and allowing the black hole accretion disk to be fed. Hopkins & Quataert (2011) found that non-axisymmetric perturbations in the stellar gravitational potential produce orbit crossings and shocks that efficiently remove angular momentum even at scales pc, and derived analytic equations for the loss of angular momentum in the presence of such shocks, which resulted in a model capable of reproducing gas inflow rates down to pc that matched very high-resolution simulations (orders of magnitude better than the Bondi parameterisation). Simba implements this gravitational torque limited model in a sub-grid manner (Anglés-Alcázar et al., 2013; Anglés-Alcázar et al., 2015, 2017a; Anglés-Alcázar et al., 2017c), for accretion from cold gas, while still using Bondi accretion from hot gas where the Bondi assumption of gravitational capture from a hot medium is more appropriate. Anglés-Alcázar et al. (2013) showed that this so-called torque-limited accretion model results in galaxy–black hole scaling relations even without any self-regulating feedback, and Anglés-Alcázar et al. (2017a) showed that this result holds even in the presence of strong black hole feedback. Because Simba’s accretion model does not require self-regulation, it is possible to implement black hole feedback in a more realistic way. In particular, Simba uses bipolar outflows whose velocity increases rapidly as drops, broadly motivated by the two-mode feedback seen observationally (Heckman & Best, 2014). In Davé et al. (2019), we showed that this model produces a correlation between and that is in good agreement with observations, along with the correct fraction of quenched galaxies as a function of stellar mass.
In this paper, we extend the preliminary results in Davé et al. (2019) to more comprehensively consider a wider range of black hole properties, their relationship to host galaxy properties, and their evolution. We focus primarily on the predictions of black hole masses and accretion rates predicted and their correlation with galaxy properties such as , SFR, and H i mass in Simba. We defer a more careful comparison in the observational plane to future work. We show that in most cases Simba produces good agreement with available observables, and makes interesting predictions for the relationship to host galaxy properties that can be tested in future multi-wavelength surveys.
2 Simulations
We use the Simba simulation (Davé et al., 2019), run with a version of the cosmological gravity+hydrodynamics code Gizmo111www.tapir.caltech.edu/ phopkins/Site/GIZMO.html (Hopkins, 2015) in its Meshless Finite Mesh (MFM) hydrodynamics solver. Simba models a comoving randomly-selected volume down to with dark matter particles and gas elements. Simba includes radiative cooling and photoionisation heating using the Grackle-3.1 package (Smith et al., 2017), assuming a Haardt & Madau (2012) ionising background that incorporates self-shielding on the fly via the prescription in Rahmati et al. (2013). Star formation is modeled by a Schmidt (1959) law on the molecular hydrogen component, where the fraction is computed via a subgrid prescription following Krumholz & Gnedin (2011). Chemical enrichment is followed for 9 metals, from Type II and Type Ia supernovae (SNe) and Asymptotic Giant Branch (AGB) stars. The Type II SN energy is assumed to (instantaneously) drive galactic outflows, implemented via decoupled, kinetic, two-phase winds, with scalings of mass outflow rates with galaxy stellar mass based on the particle tracking results of Anglés-Alcázar et al. (2017b) using the Feedback in Realistic Environments (FIRE) simulations (Hopkins et al., 2014, 2018). Energy from Type Ia and AGB stars is also added at later times by tracking stellar evolution based on the Bruzual & Charlot (2003) stellar population synthesis model.
We adopt a standard CDM cosmology with parameters , , , , , and (Planck Collaboration et al., 2016). Cosmological initial conditions are generated using Music (Hahn & Abel, 2011) with the minimum comoving softening length set to of the mean interparticle distance for dark matter particles, corresponding to a full minimum softening radius of with a 64-neighbour cubic spline kernel. The minimum gas smoothing length is half the minimum softening length. Further modeling details are available in Davé et al. (2019). Given the centrality of the black hole model to the results of this work, we present the Simba black hole growth and feedback models in more detail in the following sections.
2.1 Black Hole Seeds
Many uncertainties still remain with regards to black hole seeding (Volonteri, 2010). For simplicity, we do not attempt to mimic the physics of any seed formation mechanism in detail, and instead assume that a black hole appears at the center of each galaxy once it exceeds a mass where efficient black hole growth can occur, which we take to be . Below this mass, higher resolution simulations have shown local stellar feedback disrupts black hole accretion and suppresses growth (e.g. Dubois et al., 2015; Rosas-Guevara et al., 2016; Anglés-Alcázar et al., 2017c; Habouzit et al., 2017). An on-the-fly fast friends-of-friends (FoF) algorithm is used to identify galaxies. If the FoF galaxy does not already include a black hole particle and is above the threshold stellar mass, we insert a seed of mass \textcolorblack at the location of the most bound gas particle. This places the black hole well below the observed relation, but as discussed in Anglés-Alcázar et al. (2013) and also shown below, the black hole grows fairly rapidly onto the relation via torque-limited accretion.
2.2 Black Hole Accretion
We employ a two-mode accretion model for the growth of black holes in Simba. The first mode follows the torque-limited accretion model presented by Anglés-Alcázar et al. (2017a) for cold gas (), while the second mode models Bondi accretion solely from hot gas ().
2.2.1 Gravitational Torque-Limited Model
Accretion rates are based on the gravitational torque model of Hopkins & Quataert (2011) which estimates the gas inflow rate, , driven by gravitational instabilities from galactic scales down to the accretion disk surrounding the black hole as
| (1) |
where is the radiative efficiency (Marconi et al., 2004) and is estimated from properties of the host galaxy within a distance of the black hole by \textcolorblack
| (2) |
where is the disk fraction for the combined gas and stellar disk mass within such that:
| (3) |
while and represent the total gas and stellar masses within . is the gas fraction relative to the disk mass
| (4) |
and
| (5) |
We define , where is the normalization of proposed by Hopkins & Quataert (2011) and is a free parameter introduced to account for processes that affect the radial transport of gas at unresolved scales. We tune this to in order to match the amplitude of the relation at \textcolorblack. is taken to be the radius enclosing 256 gas elements, with an upper limit of 2. Evaluating equation 2 requires the separation of spheroidal and disk components within , which is done by means of a kinematic decomposition (Anglés-Alcázar et al., 2013; Anglés-Alcázar et al., 2015).
2.2.2 Bondi-Hoyle-Lyttleton Parameterisation
The Bondi model has been widely used as a prescription for black hole growth in galaxy formation simulations (e.g. Springel et al., 2005a; Dubois et al., 2012; Choi et al., 2012). For a black hole mass moving at a velocity relative to a uniform distribution of gas with density and sound speed , the Bondi rate is given by
| (6) |
where is a dimensionless parameter usually used to boost accretion rates and partially compensate for high mean gas temperatures as a consequence of the multi-phase subgrid model of star formation and/or the lack of resolution required to resolve the Bondi radius. We do not use a boost factor and rather suppress by the same factor as for consistency ().
2.2.3 Numerical Implementation
We apply the torque-limited accretion formula to all the gas within that has a temperature K, while for K gas we employ the Bondi formula, computing and from the hot gas only within . A given black hole can thus accrete gas in both Bondi and torque-limited modes at any given timestep. The total accretion onto the black hole is then
| (7) |
We limit Bondi accretion to the Eddington rate, while torque-limited accretion is capped at the Eddington rate. Black holes are further limited to not grow beyond of their mass in a single simulation time step to avoid large stochastic fluctuations, but this limit is very rarely invoked.
Black hole accretion proceeds stochastically (Springel et al., 2005b). Gas particles within get a fraction of their mass subtracted and added to the black hole, with a probability that statistically satisfies the mass growth (eq. 7). If a particle is sufficiently small compared to its original mass, it is swallowed completely.
2.3 Black Hole Feedback
Simba employs three black hole feedback mechanisms: (a) Radiative feedback in high- black holes; (b) Jet feedback in low- black holes; (c) X-ray feedback. The first two are implemented purely kinetically and purely bipolar, with the direction set as the direction of the angular momentum of gas within . Albeit that Whittam et al. (2018) reports a more continuous distribution of if the radio AGN sample are selected from deeper radio observations, the motivation for this is based on the observed dichotomy of black hole accretion rates and the corresponding properties of their outflows (Heckman & Best, 2014). At high (few percent), AGN are observed to drive multi-phase winds at velocities of that include warm molecular and ionised gas. At low Eddington ratios, AGN mostly drive hot gas in collimated jets at velocities , that can be seen to inflate super-virial temperature bubbles in the surrounding hot gas. Within jet modes, this dichotomy can be seen between “high excitation" (HERG) and “low excitation" radio galaxies (LERG). The former are found typically in lower mass, bluer host galaxies, and the latter in more massive, earlier types. Simba thus models AGN feedback in such a way as to directly mimic the energy injection into large scale surrounding gas using bipolar feedback with properties taken as much as possible from AGN outflow observations.
2.3.1 Kinetic Feedback
For high mode outflows, an outflow velocity is chosen based on ionised gas linewidth observations of X-ray detected AGN from SDSS (Perna et al., 2017) and parameterised in terms of the black hole mass such that
| (8) |
and are referred to as AGN winds.
If , we slowly transition to the jet mode where the velocity becomes increasingly higher as drops:
| (9) |
with a cap to the velocity increase at 7000. Additionally, a criterion requiring is added and motivated by observations that show that jets only arise in galaxies with velocity dispersions corresponding to black holes with (McLure & Jarvis, 2004; Barišić et al., 2017). We conservatively choose . This mass limit prevents small black holes with temporary low accretion rates from driving high powered jets.
AGN-driven outflows are modelled by stochastically kicking particles around the black holes with velocity with probability
| (10) |
where is a kernel weight and is the fraction of mass accreted by the black hole and subtracted from the gas particle before ejection. This gives an outflow mass loading factor of . We set for each outflow event such that the momentum ejected by the black hole is , where .
2.3.2 X-ray Feedback
The energy input rate due to X-rays emitted by the accretion disk is computed according to Choi et al. (2012), assuming a radiative efficiency . In gas-rich galaxies, severe radiative losses are expected in the ISM, hence we only apply X-ray feedback below a galaxy gas fraction threshold of \textcolorblack, and in galaxies with full velocity jets (). For further details see Davé et al. (2019).
2.4 Analysis of Simulations
Simba outputs 151 snapshots to , but here we will be primarily concerned with snapshots at . Galaxies are identified as gravitationally bound collections of gas and star particles using a friends-of-friends galaxy-finder. Black holes are assigned to the galaxy to which they are most gravitationally bound and thus galaxies may have many black holes. We consider the largest black hole within the galaxy to be the central black hole and refer to this as the black hole mass. Typically, the other black holes are much smaller and add no significant mass relative to the central black hole. Galaxies are post-processed using the YT-based package caesar222caesar.readthedocs.io/ which outputs all pre-computed galaxy information and key properties in a convenient hdf5 catalogue. All results here are obtained from caesar catalogues which are generated from simulation snapshots at specified redshifts.
3 Results
Black hole properties are observed to be correlated with properties of their host galaxy. In this section we show predictions for key black hole–galaxy scaling relations, as well as distributions of black hole properties. The goal is to assess how well Simba reproduces the observed supermassive black hole population, and to identify trends in black hole properties arising from the input physics.
In Simba, black hole particles carry two properties: the black hole mass , and the instantaneous black hole accretion rate (eq. 7). From these, it is possible to compute the Eddington ratio
| (11) |
In this paper, we will focus on relating these intrinsic black hole properties to the global galaxy properties such as stellar mass , stellar velocity dispersion , star formation rate (SFR), and H i fraction . We defer a comparison in terms of observational quantities such as AGN luminosities in various bands to future work.
3.1 Black hole growth history
Black holes and galaxies appear to grow at commensurate rates when viewed globally over cosmic time (Aird et al., 2010; Madau & Dickinson, 2014), even though there is only a weak correlation between the instantaneous growth rates for individual systems (e.g. Hickox et al., 2014). In this section we examine the global growth of galaxies relative to black holes over cosmic time, in order to situate the forthcoming discussion of the relationship between black holes and their host galaxies.
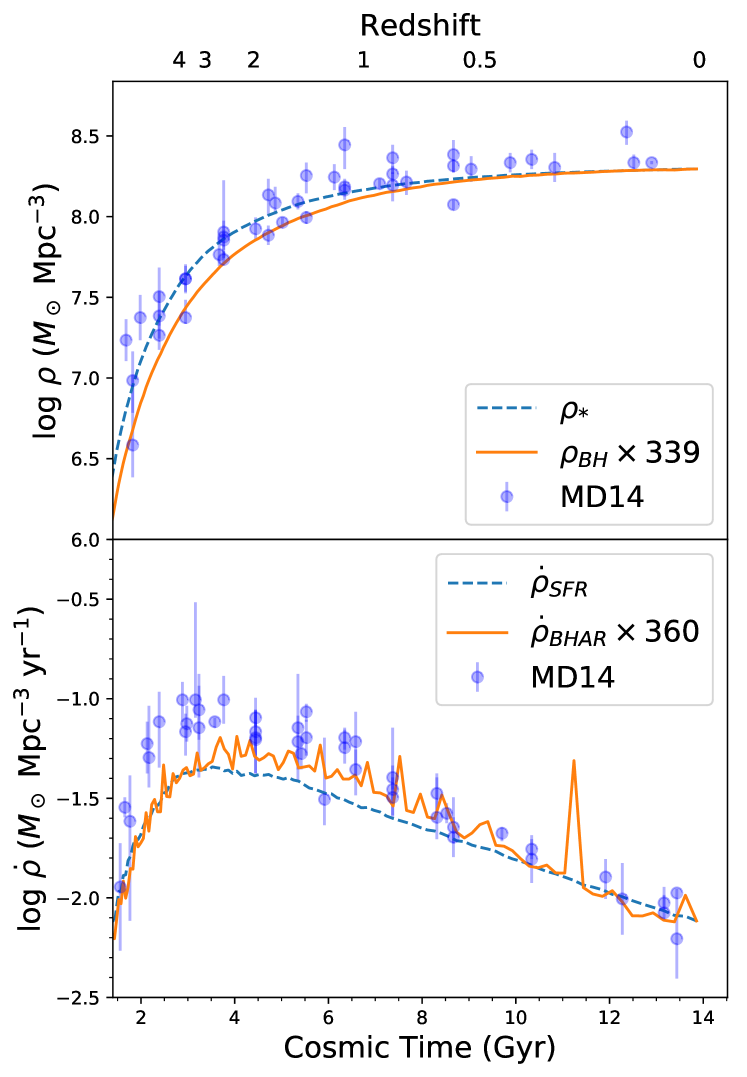
Figure 1, top panel, shows the global mass density in black holes vs. that in stars in Simba’s resolved galaxy population over cosmic time. The bottom panel shows the global SFR density vs. the BHAR density. In each case, the galaxy quantity is shown as the blue dashed line, and the black hole quantity is shown as the orange solid line. The black hole curves have been multiplied by a factor that results in these quantities being equal at , and this factor is indicated in the legend. Data points are shown for the galaxy quantities, namely the stellar mass density and the SFR density, from Madau & Dickinson (2014), so should be compared with the blue dashed curves. Note that the bottom panel is similar to the Lilly-Madau plot shown in Davé et al. (2019), except here we are considering only resolved galaxies; this makes a very minor difference.
In a globally averaged sense, the black holes and galaxies in Simba track each others’ growth fairly closely. Since black holes are only seeded once a galaxy reaches a certain mass, the mass density in black holes lags slightly behind the stellar density at early epochs. Conversely, once the black hole is seeded, it has to grow a bit more rapidly than the stars in order to catch up, as seen in the bottom panel. Comparing to observations of the stellar mass density growth, Simba shows excellent agreement. For the SFR density evolution, Simba falls short by a factor of two during Cosmic Noon (as discussed in Davé et al., 2019).
The values of the multiplicative factors are interesting. Overall, it is observed that typically (Sun et al., 2015), which would suggest the required multiplicative factor should be about 670. Instead, it is lower. This arises because there is substantial scatter in the relation (Figure 2), and the over-massive black holes contribute more than their share to the black hole mass density budget. Overall, the prediction is thus within the expected range.
In contrast, for the global instantaneous growth rate, the multiplicative factor is an order of magnitude lower in Simba than inferred from observations (Aird et al., 2010; Madau & Dickinson, 2014). This may arise because in Simba, essentially all galaxies that have black holes are “active", in the sense that their SMBHs are accreting at a nonzero rate. However, many of these may not have sufficient accretion to be observable as AGN, and hence their accretion would not be counted observationally towards the global BHAR. Indeed, during much of cosmic time, the most rapidly growing black holes are the ones in moderate-mass star-forming systems, for which it is quite difficult to identify a black hole unless it is in a (rare) Seyfert phase. In Simba, a substantial amount of accretion occurs in such galaxies, as we will discuss later. Since the integral of the SFRD and BHARD should give the cosmic stellar mass and black hole mass density (modulo stellar evolution effects), the factor for mass growth and that for instantaneous growth should be comparable, which it is for Simba, but not so for observed values. This suggests that there is substantial instantaneous black hole growth missed by current surveys of AGN across cosmic time (Hickox & Alexander, 2018). Other simulations have found similar results: Illustris (Sijacki et al., 2015) find a BHARD/SFRD , while Weinberger et al. (2017) used the Arepo code (Springel, 2010) to model AGN and black hole growth, which produces a SFRD 0.3 dex lower than observations and BHARD/SFRD of a few hundred.
Overall, black holes in Simba grow commensurately with galaxies in a globally-averaged sense, which is qualitatively consistent with observations. A naive quantitative comparison suggests that Simba overproduces the global accretion rate density at all epochs, but observational selection effects may play a significant role in this; we will look at this more closely in future works. We next examine the scaling relations for individual galaxies, to identify the galaxies where black holes have grown and are still growing.
3.2 Black Hole–Galaxy Scaling Relations
3.2.1 relation
A basic property of galaxies is their total stellar mass. There is a correlation between and that is fairly tight and roughly linear for bulge-dominated galaxies, while disk-dominated systems show a large scatter and tend to lie below the relation (Häring & Rix, 2004; McLure et al., 2006; Reines & Volonteri, 2015; Kormendy & Ho, 2013; McConnell & Ma, 2013; Graham, 2016). Local black hole mass measurements based on stellar and gas kinematics can introduce uncertainties, but here we will compare to derived black hole masses without considering such observational effects.
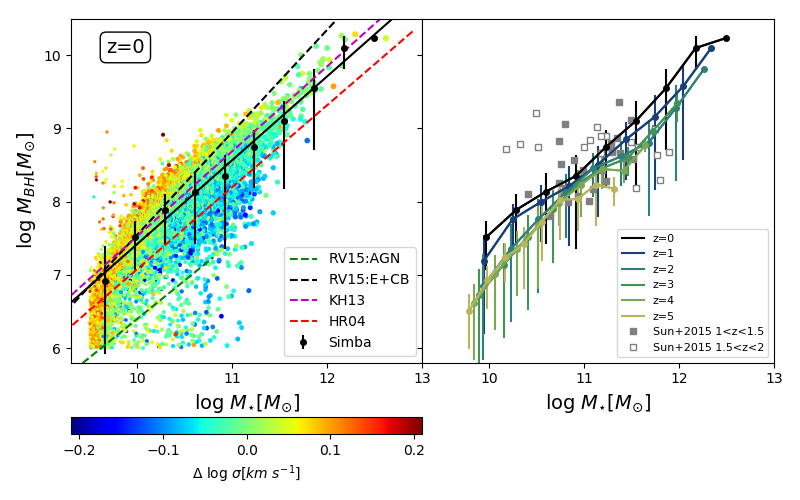
The left panel of Figure 2 shows the relation at produced by Simba. This is as shown in Davé et al. (2019), except here each galaxy is coloured by \textcolorblackthe deviation of its stellar velocity dispersion , from the median relation. The black circles with error bars show the median in a given bin with scatter around the median. The green, black, magenta, and red dashed lines show observations from Reines & Volonteri (2015) for AGN as well as for ellipticals and classical bulges, Kormendy & Ho (2013), and Häring & Rix (2004) respectively. From here on, we consider only and as this is roughly the point above which black holes are approaching the relation, and thus become broadly insensitive to the details of the seeding prescription (for a full description see Davé et al., 2019, Figure 13).
Simba produces a clear correlation between the stellar mass of a galaxy and the mass of its black hole. For a best-fit linear relation \textcolorblackto the median in the form , we find \textcolorblack and for all galaxies. If we divide the sample into star-forming and quenched at sSFRyr-1, we obtain for the quenched sample . This is in the range of observations of early-type galaxies, from Kormendy & Ho (2013) who find to Häring & Rix (2004) who find , as is evident from the Simba data mostly lying in between these two observational fits. For the star-forming sample, the slope is poorly constrained because there is large scatter, but if we fix the slope to the observational value of (Reines & Volonteri, 2015), then our amplitude \textcolorblack is somewhat higher than the value of obtained by Reines & Volonteri (2015) for AGN.
blackThere is also a strong connection between the mass of the central black hole and the deviation of the stellar velocity dispersion of its host galaxy, , from the median relation. At a given stellar mass, larger black holes live in galaxies with higher stellar velocity dispersions. This trend is indicative of the tight correlation between and that we will discuss in §3.2.2.
The right panel of Figure 2 shows the evolution of the relation for redshifts . We compare to observations by Sun et al. (2015) of Herschel-detected broad line AGN (BLAGN) for , shown as the squares. Simba predicts very little evolution in the relation, less than a factor of two over this redshift range. This is generally in agreement with the observations shown here, as well as with Shields et al. (2003) who found no distinct evolution in the relation for quasars out to , and Mullaney et al. (2012) who used X-ray stacking analyses to determine that was approximately constant and independent of redshift. In contrast, McLure et al. (2006) looked at massive () early type galaxies and found a change in the ratio of (where is the spheroidal mass component, for massive galaxies) increasing by out to . However, AGN selection tends to bias high- samples increasingly towards over-massive black holes, which can mimic evolution (Lauer et al., 2007). Thus the actual amount of evolution is not precisely determined, but appears to be generally modest, as Simba predicts.
3.2.2 Relation
It has long been recognised that present-day black holes correlate more closely with properties of a galaxy’s bulge mass than its total stellar mass (see Kormendy & Ho, 2013, and references therein). Kormendy & Ho (2013) argue that since bulges and elliptical systems formed from galaxy mergers, this argues for a connection between black hole growth and galaxy mergers. In contrast, pseudobulges, which are more related to the secular evolution of a disk galaxy, do not satisfy the tight BH-galaxy correlations. Ferrarese & Merritt (2000) and Gebhardt et al. (2000) showed that the correlation with black hole mass is tightest with galaxy stellar velocity dispersion, the so-called relation. Hence it is instructive to examine this relation in Simba as a test of this connection.
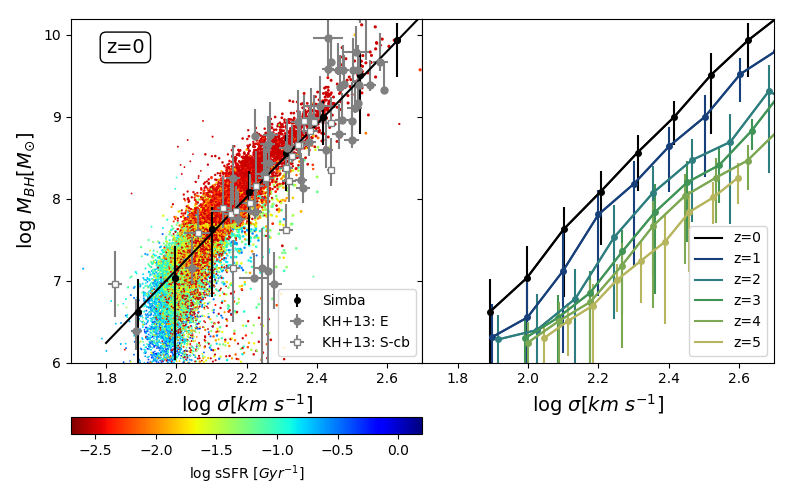
Figure 3, left panel, shows the relation for Simba galaxies. The 1-D velocity dispersion is calculated from individual star particles that are members of each galaxy; \textcolorblackwe have not applied an aperture correction. The individual galaxy points are coloured by sSFR, with the black circles with errorbars showing the median in a given bin. The observed values for ellipticals (filled grey circles) and spirals with classical bulges (empty grey squares) from Kormendy & Ho (2013) are overlaid, with errorbars. Due to the large scatter in the relation for spirals with pseudobulges, these were not plotted here.
Simba produces a reasonably tight relation that is in the range of the observations for massive galaxies with km/s. Fitting \textcolorblackthe median sample to , \textcolorblack we find best-fit values of and . Observations by Gebhardt et al. (2000) found a somewhat shallower slope and which is more consistent with the simulations results from DeGraf et al. (2015) (, ). Nonetheless, the simulated galaxies seem to lie in the same region as the Kormendy & Ho (2013) data, with a comparable scatter. At low-, there are few observed true bulges, but the Simba galaxies may have somewhat over-massive black holes in this range. We note that smaller galaxies in our simulations can have potentially inaccurate stellar velocity dispersions owing to lower particle numbers with which to compute the dispersions, which may bias the values low. Nonetheless, for bulge-dominated galaxies the predicted relation in Simba nicely tracks observations. \textcolorblackThis agreement may be surprising because Shankar et al. (2016) argued that, owing to biases in the measurements of black hole masses, the observed relation and the relation are inconsistent with each other, so it is surprising that Simba can match both simultaneously, which other models have had some difficulty doing (Barausse et al., 2017). A relevant aspect of Simba is that at a given , large black holes live in higher- galaxies, as shown by the colour-coding in Figure 2. This bias qualitatively mimics that seen in observations, and implies that the relation in Simba is not fully described by the relation convolved with the mean relation.
Notably, the scatter in the relation is clearly higher, typically by , compared with the scatter in the relation (Figure 2). This is opposite to the trend generally inferred from observations (Ferrarese & Merritt, 2000). Since responds to total mass while only measures the stellar mass, there can be scatter introduced between these owing to variations in the dark matter content within the stellar region. In observations, the tight trend with velocity dispersion as well as central ( kpc) surface density (Zolotov et al., 2015) suggests that central spheroidal growth is connected to black hole growth, indicative of structurally disruptive processes such as mergers driving both. At face value, this seems inconsistent with the growth of black holes via torque-limited accretion that associates black hole growth primarily with disk instabilities. However, we note that recent observations tend to paint a picture where only the brightest AGN are fueled by mergers, whereas most (Seyferts-like) AGN are not (e.g. Donley et al., 2018).
Figure 3, right panel, shows the evolution of the running median of the relation. There is a clear evolution, in that galaxies at a given have lower at higher redshift. This can be understood as a consequence of the invariance of the relation with redshift together with size evolution, related via . If is the dominant mass component, or at least is a good tracer thereof, then this equation implies that the typical galaxy size at a given mass must decrease with redshift. Indeed, Conselice (2014) describes the change in the effective radius for galaxies by a power-law where depending on whether one is observing disk-like or spheroid-like galaxies. Such a trend is qualitatively seen in Simba, and will be detailed in a forthcoming paper (Appleby et al., in preparation). Other simulations have also found a similar trend. DeGraf et al. (2015) find increasing slope and decreasing normalisation of the relation along with insignificant evolution in the relation for . Sijacki et al. (2015), on the other hand, find a flattening of the best-fit slope and decrease in the normalisation of the relation with a relation that increase from 1.21 to 1.28 in slope but staying roughly constant in normalisation for .
Overall, Simba reproduces the observed relationship between stellar velocity dispersion and black hole mass, for moderate mass galaxies and larger. However, the scatter in this relationship is clearly larger than that in the relation, which may be in tension with observations. We will investigate this further in future work with higher-resolution simulations that can more robustly model galaxy kinematic structure along with black hole growth.
3.2.3 BHAR-SFR relation
Since galaxies and black holes grow commensurately in a globally-averaged sense, one expects that the SFR and BHAR should be correlated. Indeed, such a correlation has been observed (Mullaney et al., 2012; Chen et al., 2013; Delvecchio et al., 2015), although measuring BHARs accurately remains challenging and time variability may obscure a direct, instantaneous SFR-BHAR connection (Hickox et al., 2014). For torque-limited accretion, Anglés-Alcázar et al. (2015) found via post-processing of a cosmological simulation a reasonably tight connection between the SFR and nuclear activity of galaxies when averaged over galaxy dynamical timescales, although instantaneous measures could still have a large scatter. In this section we examine the instantaneous BHAR–SFR correlation in Simba, to determine whether this connection persists in the self-consistent black hole accretion model, and how it fares versus observations.
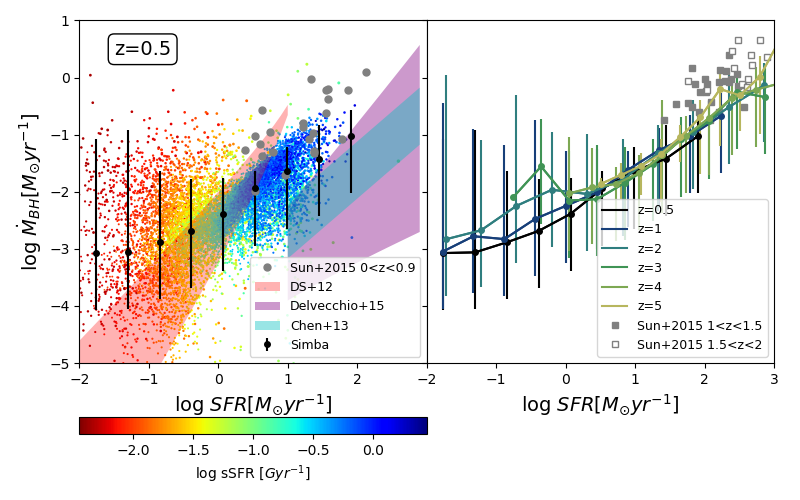
Figure 4, left panel, shows the relationship between BHAR and SFR for Simba galaxies, at . Each galaxy is represented by a circle colour-coded by sSFR. The black circles with errorbars show the median BHAR in a given SFR bin. The red band shows the total SFR–BHAR relation obtained by Diamond-Stanic & Rieke (2012) for Seyfert galaxies and the cyan and purple bands show results from Chen et al. (2013) and Delvecchio et al. (2015) respectively for star forming galaxies. The grey filled circles are observations of BLAGN from Sun et al. (2015) We choose to show our results at as it is comparable to the observations that we compare to, but Simba predicts little evolution in this relation as can be seen from the right panel.
In Simba, the SFR broadly traces the BHAR. Note that the slope obtained by Simba is flatter than that of the observations. At , a fit to \textcolorblackthe median in the form for star forming galaxies yields \textcolorblack and . The relation clearly flattens at the lowest SFR values, owing to Bondi accretion starting to contribute significantly, which breaks the connection between star formation and black hole growth from torque-limited accretion. The scatter around the median relation is dex at the highest SFRs, increasing somewhat to lower SFRs.
Observations of the BHAR–SFR relation tend to focus on star-forming galaxies. The Simba predictions broadly lie within the region spanned by the observations. Chen et al. (2013) studied IR selected star forming galaxies at with AGN selected by X-ray and mid-IR criteria and found a slope of and normalisation, . Diamond-Stanic & Rieke (2012) estimates the BHAR from O iv () flux measurements and the SFR from the aromatic feature for Seyfert galaxies at a median distance of 22 Mpc, while Sun et al. (2015) uses X-ray and IR data to infer the SFR and BHAR for BLAGN. Delvecchio et al. (2015) also uses IR selected star forming galaxies and have AGN identified by X-ray criteria, similarly to the Chen et al. approach. In detail, the observations typically show lower BHAR at a given SFR in the SFR range overlapping with Simba predictions. It is worth noting that the observations are generally for highly star-forming galaxies, as indicated by the shaded region for Chen et al. (2013), except for Diamond-Stanic & Rieke (2012) which samples SFRs from yr-1. Given the uncertainties in determining BHARs from data at particular wavelengths, such as the difficulty in disentangling AGN emission from SF-produced IR emission or X-ray binary contributions, it remains to be seen if this discrepancy is serious. Nonetheless, for star-forming systems, the predicted and observed slopes are quite similar.
The right panel of Figure 4 shows the evolution of the BHAR-SFR relation, which remains roughly unchanged from . The main evolutionary trend is that the low-SFR tail becomes populated at lower redshifts, but in all cases it appears that there is a gradual upturn towards the lowest SFR values. This generally agrees with the Sun et al. (2015) observations represented by grey squares. A similar lack of evolution has been found out to by Mullaney et al. (2012), who found a constant BHAR–SFR ratio up to which then produces the relation found in Figure 2. It is interesting that this “AGN main sequence", as denoted by Mullaney et al. (2012), constrained to match a roughly non-evolving relation, requires higher accretion rates than other observational determinations, and even higher than Simba predictions. As mentioned earlier, the integral of the BHAR and SFR should reflect the correlation between and . Simba satisfies this constraint by construction, but applying it to observations may provide valuable constraints on BHAR evolution.
Overall, the BHAR–SFR relation in Simba shows a reasonable correlation, but with substantial scatter. This is consistent with the idea that black holes and galaxies grow commensurately on cosmological timescales, but not necessarily on inner galactic timescales. The BHARs in Simba are broadly in the range of observed values, although they appear to be somewhat higher than some recent observations; it remains to be seen whether this discrepancy constitutes a significant failing of the model.
3.2.4 Eddington Ratios
The Eddington ratio (eq. 11) appears to play a critical role in governing black hole accretion and feedback processes (Heckman & Best, 2014). Observationally, AGN are often split into two broad categories, radiatively efficient with few percent, and radiatively inefficient with . Simba’s AGN feedback model is motivated by this observed dichotomy, with being the key quantity that transitions from the radiative feedback mode that has a relatively minimal impact on galaxy growth, to the jet feedback mode which plays a crucial role in quenching (Davé et al., 2019). Observations of span a wide range, from quasars that approach values of unity and beyond (Liu et al., 2019), to inefficiently accreting black holes in massive ellipticals that have as low as , yet are still active as evidenced by their radio jets. Hence the Eddington ratio is an important quantity to examine.
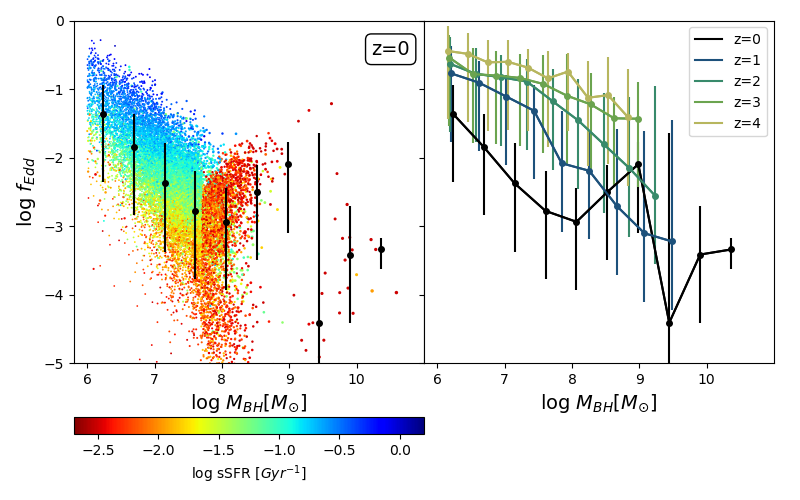
Figure 5, left panel, shows versus for Simba galaxies colour-coded by their sSFR. The black circles with errorbars shows the median value in a given black hole mass bin. The right panel shows the running median of this relation at redshifts from .
Simba produces a wide range of Eddington ratios, qualitatively consistent with observations. There is a clear anti-correlation of with black hole mass for . Above this mass, the scatter blows up, and there is a much wider range of . There is a shelf at around dividing these two regions, above which there is a strong increase in low-sSFR galaxies. This is our minimum black hole mass for the onset of jet feedback, and shows that the jet feedback is directly responsible for quenching galaxies.
For lower-mass black holes, one can see a strong dependence in the on sSFR, where black holes in star forming galaxies accrete more efficiently at a given black hole mass. This is consistent with torque-limited accretion (eq. 2), in which increasing disk mass and gas fraction drive black hole accretion, accompanying an increase in star formation which is driven by these same factors (except over the entire disk, rather than the inner disk). In this regime, AGN feedback has only a minor impact (Anglés-Alcázar et al., 2017a; Davé et al., 2019), so the growth of both stars and black holes is supply-limited.
At high black hole masses, is typically well below Simba’s jet feedback threshold of 0.02, so jet feedback is prevalent. Hence the low Eddington ratios are strongly correlated with quenched galaxies. In these systems, there is little cold gas, which means that torque-limited accretion becomes small. Meanwhile, hot gas is prevalent, making Bondi accretion efficient. In Anglés-Alcazár et al. (in preparation) we will examine these growth modes in more detail, but here we already see that Bondi-dominated accretion results in significantly more variability in the accretion rate, and hence . In this regime, there is no obvious correlation of with .
The right panel of Figure 5 shows the evolution of the median Eddington ratios as a function of \textcolorblack. The obvious trend is that, overall, is higher at higher redshifts. This arises from the higher gas fractions and surface densities at high redshift (Anglés-Alcázar et al., 2015). Observations generally suggest that the Eddington ratios of accreting black holes increase with redshift (Kauffmann & Heckman, 2009; Lusso et al., 2012; Aird et al., 2012), qualitatively consistent with these predictions.
Examining the evolution more carefully, one can see that the anti-correlation slope flattens with increasing redshift, particularly from . At low masses, black holes are always in the radiative mode (as observed; e.g. Hale et al., 2018), while at higher masses, the Eddington ratios drop more quickly. Black holes with are already in place at , but they have accretion rates of Eddington, whereas at they have %. From , the growth of hot gas in high-mass halos results in Bondi accretion starting to become dominant for those black holes, and the anti-correlation between and is less clear.
In summary, the Eddington ratio predicted in Simba drops with both black hole mass and cosmic time. The criterion for jet feedback that quenches galaxies thus kicks in for very high mass black holes at high redshift, and the black hole mass scale for jets (and thus quenching) drops with time. Inasmuch as black hole mass is correlated with stellar mass and thus halo mass, this suggests that the halo mass scale where quenching occurs should be higher at high redshift, which agrees with Hale et al. (2018) who found that the halo masses of efficient accretors flattens at high redshift. This is broadly consistent with expectations from the data-constrained equilibrium analytic galaxy formation model of Mitra et al. (2015), as well as empirical galaxy formation modeling such as Moster et al. (2018). In this way, the dropping efficiency of torque-limited accretion at both high masses and low redshifts, along with Bondi accretion from the hot gas, helps to enact and maintain quenching in Simba galaxies.
3.3 Distribution Functions
We have seen that Simba’s black hole–galaxy scaling relations as a function of , SFR, or broadly agree with observations, albeit with some potentially interesting discrepancies. Here we examine the number densities of black holes of a given mass and Eddington ratio . Observationally, these can be challenging to determine owing to completeness issues, nevertheless some general trends are evident to which we can compare Simba predictions.
3.3.1 Black Hole Mass Function
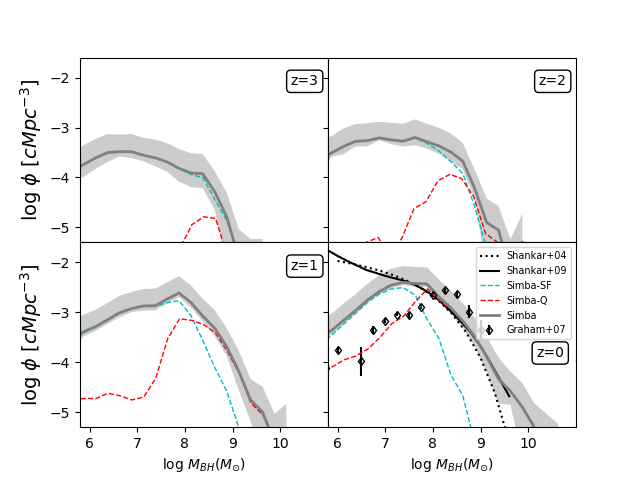
We first consider the black hole mass function (BHMF). Observational estimates of the BHMF usually involve employing correlations of with global galaxy properties. Shankar et al. (2009) used a compilation of X-ray and optical data to determine the AGN luminosity function and model the average growth rate of black holes, making predictions for the local BHMF assuming a single radiative efficiency and Eddington ratio for all black holes, which they compared to observational determinations of the local BHMF based on the and relations. Graham et al. (2007) used the measured Sérsic indices of galaxies from the Millennium Galaxy Catalogue to estimate the BHMF based on the empirical relation between and Sérsic index from Graham & Driver (2007). We do not attempt to mimic these criteria in detail, owing principally to the fact that this requires structural decomposition of Simba galaxies which could potentially be compromised by resolution effects. Instead, we assume the observations are properly characterising the black hole masses, and compare to these directly.
Figure 6 shows the BHMF predicted by Simba, at (upper left to lower right). The solid grey line shows the mass function, and the grey band shows the uncertainty determined via jackknife subsampling among the 8 simulation sub-octants. At , we compare to observations by Shankar et al. (2004) (black dotted line), Shankar et al. (2009) (solid black line) and Graham et al. (2007) (black circles with errorbars). Finally, we subdivide the black hole population into star-forming and quenched populations above and below \textcolorblack sSFR Gyr-1 (as in Davé et al., 2019), shown as the cyan (Simba-SF) and red (Simba-Q) dashed lines, respectively.
Overall, Simba produces a black hole mass function that is in very good agreement with observations for . There is some variance among the different observational determinations, but these are generally within the range of Simba predictions. Simba produces a turnover at low black hole masses, which is intermediate between the lack of turnover in the Shankar et al. (2004, 2009) determinations, and the Graham et al. (2007) measurements. In Simba, we get this turnover because we seed black holes at , and the torque-limited accretion model grows them very quickly until they join the relation, which results in a small number of rapidly-growing small black holes. If the numbers of these black holes are under-predicted, it could be that Simba’s somewhat arbitrary initial seeding and resulting rapid growth phase may not be fully representative of true black hole growth, which would be unsurprising. Once black holes grow sufficiently large and are stably evolving upwards on the relation, it appears Simba produces a black hole population that is in good agreement with data.
The evolution of the BHMF in Simba is such that, in general, it decreases towards higher redshift. In detail, the lowest mass black holes always have a similar number density, owing to seeding at a given whose number density also does not evolve much with redshift (Davé et al., 2019). As time evolves, the black hole population builds up towards a peak at , above which efficient torque-limited accretion becomes less efficient owing to quenching and the diminution of cold gas, resulting in a dropping BHMF above this mass. The peak in the BHMF at is therefore a consequence of the interplay between black hole accretion modes and galaxy quenching. As can be seen, current observational determinations even at are not conclusive on whether such a peak exists, so this represents a reasonably generic prediction of the currently implemented Simba accretion model.
The drop in the BHMF to higher redshifts is broadly consistent with observational findings. Kelly & Merloni (2012) studied the evolution of the BHMF and compare several models including those from Shankar et al. (2009); Cao (2010); Merloni & Heinz (2008) and find that, with redshift, the mass function amplitude decreases. Rosas-Guevara et al. (2016) find that with an increase in redshift, the black hole mass function decreases in amplitude as well as width, similar to Simba predictions. They also find that between and the change in amplitude of the black hole mass function is much less rapid than at higher redshifts; this is also consistent with our predictions. A more detailed quantitative comparisons would involve properly accounting for measurement techniques and selection effects which we leave for future work, but it appears that the broad characteristics of observed BHMF evolution are reproduced in Simba.
Finally, we consider the BHMF split into star forming and quenched galaxies. The local BHMF is dominated by quiescent galaxies for , because the black hole itself is responsible for quenching those galaxies via jet feedback. At higher redshifts, the crossover mass scale grows, so that quenched galaxies dominate for at . As discussed in §3.2.4, the quenching scale drops with time owing to dropping with time, combined with Simba’s assumption that only lower- black holes can give rise to jets that are responsible for quenching galaxies. Smaller black holes, in contrast, tend to live in star-forming galaxies. Galaxies with smaller black holes such as the Milky Way are thus predicted to be predominantly star-forming by Simba.
In summary, the BHMF predicted in Simba agrees well with observations for . Simba predicts a peak in the BHMF around this mass owing to black holes growing rapidly below this mass but slowly above it; observations are inconclusive in the shape of the BHMF at lower masses. The BHMF is lower at higher redshift, with a less prominent peak owing to less quenching. Large black holes tend to live in quenched galaxies, with a crossover at below which star-forming galaxies dominate at ; this crossover moves to higher at higher redshifts. These results are broadly in agreement with various observational constraints, showing that Simba plausibly grows black holes over time.
3.3.2 Eddington Ratio Distribution
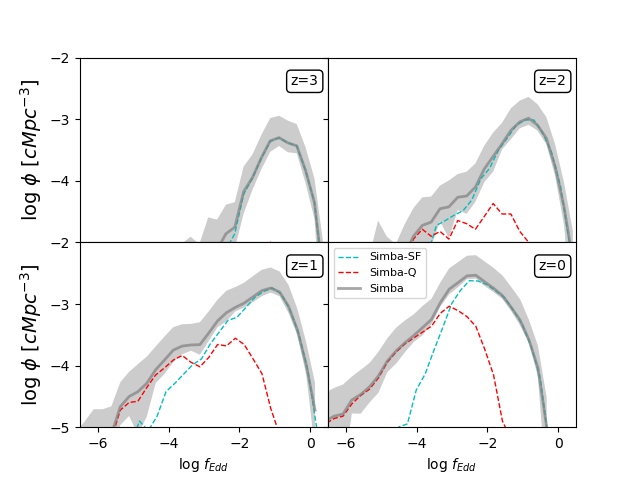
Figure 7 shows the distribution of Eddington ratios of all galaxies with black holes in Simba, represented by the grey band (based on jackknife resampling), at . A breakdown into star-forming and quiescent populations is shown by the cyan and red lines, respectively.
The distribution at every redshift is peaked, with a rapid dropoff to high and a slower, power-law dropoff to low . The peak occurs at at , dropping to at . This drop in the characteristic Eddington ratio with time was noted in Figure 5, and is partly responsible for the increase in jet feedback activity and quenching at later epochs. Black holes in star-forming galaxies accrete more efficiently than those in quenched galaxies. The growing quenched galaxy population creates a tail to low values that becomes quite prominent at low redshifts, and causes the overall distribution to broaden.
We compare to observations of the Eddington ratio distribution from Kauffmann & Heckman (2009), who use the [OIII] luminosity of SDSS galaxies to derive assuming a bolometric correction factor of . With this, L[OIII]/ can be converted to by adding dex. Their sample is separated by the amplitude of the 4000Å break, , showing that galaxies with , which are galaxies with recent or ongoing star-formation, follow a lognormal distribution while galaxies with , which are galaxies with little or no star formation, have a power law distribution. With this, it is deduced that when there is cold gas in the bulge of a galaxy, the central black hole regulates its own growth, and when this cold gas is depleted, the growth of the black hole is regulated by the rate at which evolved stars lose their mass.
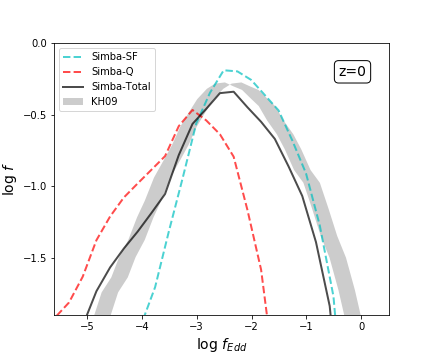
Figure 8 shows the fractional distribution of in Simba. The total distribution is represented by the black solid line and the red and cyan dashed lines are the quiescent and star-forming fraction distributions respectively split by the same sSFR cut used throughout this paper. The grey band shows observations by Kauffmann & Heckman (2009) of galaxies assuming a range of bolometric corrections . These generally correspond to star-forming systems, so it is more appropriate to compare to the dashed cyan star-forming galaxy predictions from Simba.
For high , the star-forming population in Simba is in good agreement with the observations; in Kauffmann & Heckman (2009), this regime is dominated by low- galaxies indicative of star-forming systems. At low , we see discrepancies in which the values of star-forming galaxies in Simba are somewhat overpredicted. The differences may partly be explained by the fact that we use a sSFR cut and not a cut to separate the galaxies.
For quenched galaxies, Simba follows a log-normal distribution shifted to lower from the star-forming systems. This is, however, inconsistent with the power-law distribution at low seen by Kauffmann & Heckman (2009). This may be a consequence of the selection effect since the low objects tend to be the larger elliptical galaxies that are typically more easily identified in SDSS and thus the low end is typically more biased. Also, because our black hole accretion model occurs from a kpc-sized region, it is dynamically limited in its ability to capture variability on small timescales. One might regard the accretion rates in Simba as reflective of time-averages over a typical inner disk dynamical time ( Myr), which would tend to turn an intrinsic power-law distribution in dominated by short-term variability into a lognormal distribution.
Overall, Simba produces a fair agreement with observations of Eddington ratios for star-forming systems, and generally produces lower values for quenched systems. Issues with selection effects and variability could be impacting these comparisons, which we will investigate in future work.
3.4 Black hole dependence on HI
In Simba, the growth phase of black holes is roughly commensurate with that of the stellar content, resulting in a global co-growth of galaxies and their black holes. This co-growth breaks at late epochs when massive, quenched galaxies appear, whose black holes can grow via Bondi accretion from hot gas that cannot form stars. Since our star formation model is directly tied to molecular gas content, one expects these trends to also broadly hold for the content of galaxies. However, the H i cold gas reservoir is not directly tied to star formation, and hence its correlation with black hole mass and accretion is not immediately evident. Still, the Mufasa simulation showed a significant correlation between H i content and SFR (Davé et al., 2017), and this persists in Simba (Davé et al., 2019), which suggests that H i is a reservoir of gas that will ultimately form stars, which should ultimately be also correlated to black hole growth. The detailed connection between the H i and black hole growth is thus an interesting prediction that connects gaseous fuel in galaxy outskirts with feeding and feedback in the centre of the galaxy.
Owing to present observational challenges, there have been a relatively limited number of studies connecting H i and black holes. Fabello et al. (2011) showed that the H i content of galaxies does not appear to be correlated with black hole accretion in Seyfert galaxies. Heckman & Best (2014) argue that this is expected because the H i lies on larger scales, and is often conspicuously absent in the cores of disk galaxies where the hydrogen is mostly in molecular form. Hence there is not expected to be an instantaneous connection between H i and black hole growth, just as the instantaneous connection between SFR and is also weak. However, in the near future, upcoming radio surveys such as MIGHTEE (Jarvis et al., 2016) and LADUMA (Holwerda et al., 2012) with the new MeerKAT array will soon provide significantly improved data on both H i-21cm emission as well as black hole accretion than has been available previously. This will enable larger statistical studies that can identify correlations over longer timescales, and more accurately measure the scatter between gas reservoirs and black hole growth. It is thus interesting to make predictions for the connection between H i and black hole properties.
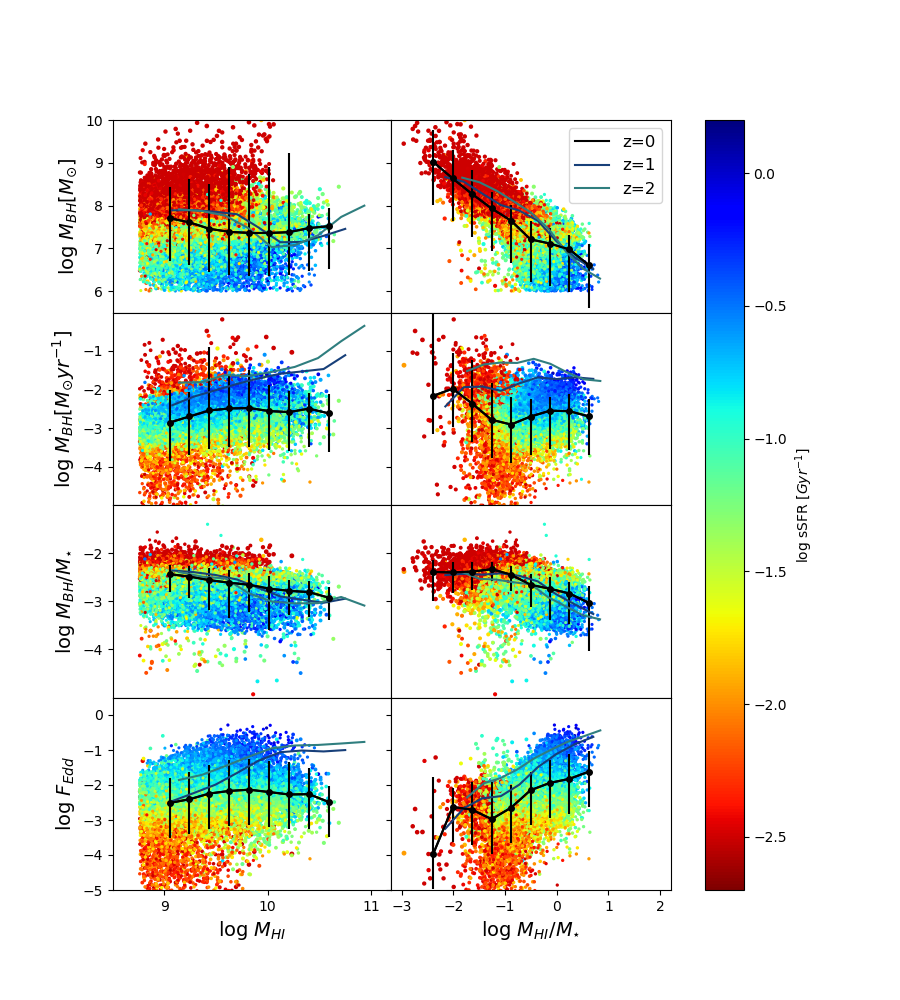
Figure 9 shows how black hole properties depend on the H i content of galaxies in Simba, specifically the total H i mass (left column), and the H i mass fraction (right column). The rows show various black hole properties, from top to bottom: , , , and . All galaxies are colour-coded by sSFR. The running median at is shown as the black line with uncertainties from jackknife resampling. The blue and turqoise lines show the running medians at respectively; the individual galaxy points are not shown at those redshifts.
The top left panel shows that the black hole mass is essentially uncorrelated with H i mass, and there is little evolution in this relation. More interestingly, at a given H i mass, larger black holes populate more quiescent galaxies. This shows that there is a strong connection between black hole growth and gas removal in galaxy outskirts, likely owing to suppression of cooling to feed the H i reservoir. The most star-forming galaxies primarily have the lowest , but there is also a weaker trend that they have the highest . Hence star formation is enhanced in galaxies that have both small black holes and high gas content. The top right panel shows vs. , which displays a strong anti-correlation, reflecting a tight relation at late times, with the most star-forming galaxies having concurrently the smallest black holes and highest gas fractions. There is modest evolution upwards in this relation with time, such that galaxies at a given black hole mass have higher at earlier times, reflecting the overall increase in gas content in galaxies at earlier epochs (Davé et al., 2019).
The second row shows the dependence of BHAR on H i content. At , BHAR shows little correlation with H i mass, but there is an evident correlation at such that black hole accretion is stronger for higher H i masses. At these earlier epochs, the accretion is dominated by the torque-limited mode, which depends on gas fraction. Even though torque-limited accretion is computed within the core of the galaxy while the H i is more diffusely distributed, the overall enhanced gas content appears to drive black hole accretion. By , in contrast, the emergence of quenched galaxies dominated by Bondi accretion results in no obvious correlation with H i mass. Even at , the star-forming galaxies appear to follow the relations at higher redshift; however, a large population of low-sSFR galaxies overwhelms that trend. Interestingly, at low-, there is a larger scatter of accretion rates in the quenched galaxies, suggesting that Bondi accretion is more stochastic. For (right panel), we see that there is no correlation at any redshift with H i fraction, but the most star-forming galaxies have both high along with higher BHAR. As discussed previously, the enhanced gas content commensurately drives both stellar and black hole growth.
The third row of Figure 9 shows the dependence of on H i properties. The values are at every redshift. In detail, there is a weak anti-correlation, with the highest H i masses having slightly lower , independent of redshift. A stronger trend is seen when examining SFR properties, where at a given , galaxies with under-massive black holes are clearly more star-forming. Quenched galaxies, on the other hand, sit well above the mean relation, with . This plot most starkly shows that black hole mass is a key governor of whether a galaxy is star-forming or quenched. The right panel, versus , tells a similar story as the top right panel: galaxies that have the lowest sSFRs have the largest black holes and lowest gas content, and vice versa.
The bottom row shows the Eddington ratio, which is just a scaled version of (eq. 11), versus H i properties. At , just like with the BHAR (second row), there is no trend with H i mass, while a trend emerges at higher redshifts. However, unlike for the BHAR, there is a clear trend with . In terms of , the contours of constant sSFR are essentially horizontal, showing that is a strong and clear predictor of sSFR at a given H i mass, independent of . It is interesting that the highest SFR galaxies have both the most undermassive black holes and the highest specific black hole accretion rates, showing that they are in the process of “catching up" to the typical galaxy in terms of both their black hole and stellar content. The origin of why some galaxies end up in this state, relative to other galaxies with overmassive black holes that quench more quickly, will be examined in forthcoming work (Cui et al., in preparation).
These trends represent predictions that can be tested against forthcoming large-scale H i surveys, where ancillary data can provide other global galaxy quantities such as the stellar mass, SFR, and black hole mass. The strong trends relating the black hole mass and accretion rate with SFR at a given H i mass, and as we saw earlier also at a given stellar mass, are direct outcomes of Simba’s black hole growth and feedback models. Confirming or falsifying these predictions will be an important test of Simba’s black hole evolution model and quenching feedback.
4 Summary and Discussion
We have presented results from the Simba cosmological hydrodynamic simulation (Davé et al., 2019). Simba employs a novel two-mode subgrid black hole accretion model: gravitational torque-limited accretion (Anglés-Alcázar et al., 2017a) from cold gas based on the analytic model of Hopkins & Quataert (2011), and Bondi accretion from hot gas as widely used in other galaxy formation simulations. In this paper we examine the predictions of Simba for the growth and evolution of the black hole population relative to their host galaxies, in order to assess the model’s broad plausibility and characterise basic predictions of galaxy–black hole co-evolution. Our main results are as follows:
-
•
The global black hole mass density and black hole accretion rate density trace the stellar mass and star formation rate densities, respectively. On average, black holes and galaxies grow commensurately, which is broadly consistent with observations. At in Simba, the ratio of the total to density, and also that of SFR to BHAR density, is , which is fairly constant throughout cosmic time. For stellar to black hole mass density this is mostly in agreement with observations, but for SFR to BHAR density it is an order of magnitude lower than observed, suggesting that current surveys may miss a large fraction of black hole accretion.
-
•
The mass of black holes is strongly correlated with , and there is no significant evolution in the relation for . There is larger scatter at lower masses, in the regime where black hole seeds are converging onto the relation.
-
•
The black hole mass also correlates with stellar velocity dispersion in galaxies, though not quite as tightly as with . The predictions agree with observational determinations from Kormendy & Ho (2013). evolves with redshift, but only in a manner that is expected for a universal relation, assuming the expected size evolution of galaxies.
-
•
The black hole accretion rate increases with the SFR of its host galaxy for high SFRyr-1, but the relation flattens with significantly more scatter at lower SFR. The relatively tight correlation for star-forming galaxies arises from a common gas reservoir driving both star formation and black hole growth in the torque-limited mode (Anglés-Alcázar et al., 2015, 2017a). Bondi accretion dominates for massive black holes in gas poor galaxies, which does not yield a strong correlation with SFR. The predictions are broadly consistent with observations of BHAR in star forming galaxies, with a hint that it may be slightly higher () than observed. The predicted relation shows no evolution for .
-
•
Black hole Eddington rates are strongly anti-correlated with black hole mass at , with power-law slope nearly , showing that BHAR is mostly uncorrelated with black hole mass; this is broadly consistent with observations (Kauffmann & Heckman, 2009). This is expected in the torque-limited model owing to the weak dependence on (eq. 2). At higher , Bondi accretion dominates, and the BHAR scales more strongly with black hole mass, resulting in a flatter slope. The scatter in becomes very large, indicating that Bondi accretion from hot gas is quite stochastic in Simba. The relation evolves fairly strongly towards higher at a given , with a mild trend for a flattering of the slope at higher . At , the most massive black holes are accreting at reasonably high , broadly consistent with observations of quasars at those epochs.
-
•
The BHMF predicted by Simba shows an increase at the low mass end, and an exponential truncation at the massive end. This gives a broad peak at , which is where the jet mode feedback in Simba kicks in and begins to quench galaxies that also have low . Splitting galaxies by quenched vs. star-forming clearly shows a dichotomy at this black hole mass scale. The existence of a BHMF peak is thus a direct prediction of Simba’s black hole feedback model. The Simba BHMF is in quite good agreement with observations above this peak, but current observational determinations to lower masses are inconclusive about whether there is a peak or not. We note that the low-mass prediction in Simba may owe in part to our seeding prescription, which causes small black holes to grow rapidly; a different seeding prescription may alter the predictions below this peak. The peak also is less prominent at higher redshifts, because jets are rarer and thus quenching is less effective. The mass scale at which quenched galaxies dominate also increases in to higher redshifts, showing that Simba predicts that the quenching mass scale downsizes in , and by association, also in and .
-
•
The Eddington rate function at shows a power-law rise up to , and then an exponential cutoff above this. Star-forming galaxies dominate at , and quenched galaxies only appear at , by which point the jets in Simba are ejected at maximum velocity. The distribution is in reasonable agreement with SDSS observations from Kauffmann & Heckman (2009) for star-forming galaxies. At higher redshifts, the distribution shifts towards higher values, with a diminishing tail of quenched galaxies resulting in a sharper peak; at , typically, and we start to see some black holes accreting at the full Eddington rate or even slightly above.
-
•
The H i content of galaxies shows interesting correlations with black hole mass and accretion rate. There are at best weak correlations in , , , and with H i mass, but there is always a clear trend that galaxies that are quenched at a given H i mass tend to have large black holes that are accreting inefficiently, while the most star-forming galaxies have undermassive black holes that are accreting efficiently. By examining the H i fraction in galaxies, we see that galaxies are highly star-forming if they have both high gas content and small black holes. The interplay between gas content, star formation, and black holes is a prediction from Simba that can be tested in detail with upcoming multi-wavelength surveys.
In general, for where there is observational data, Simba reproduces observed black hole–galaxy correlations fairly well, with potential discrepancies such as an overprediction of BHARs at a given SFR or the underprediction of the BHMF at . This shows that the new black hole accretion and feedback models in Simba are plausible as a platform for studying galaxy–black hole co-evolution and the role of black hole feedback in quenching galaxies. In upcoming work, we will focus on tracking indvidual black holes to better understand the modes by which black holes grow, examine in more detail how black hole feedback is responsible for quenching, and compare to observational-plane properties such as AGN luminosity functions while more carefully modeling sub-populations of AGN such as high- and low-excitation radio galaxies. By bringing together results from Simba and upcoming surveys of AGN and galaxy evolution, we have a powerful tool to put constraints on the physical mechanisms driving black hole accretion and the extent of its effect on large scale properties of galaxies.
Acknowledgements
The authors acknowledge helpful discussions with Philip Best, Weiguang Cui, Katarina Kraljic, \textcolorblack and Francesco Shankar. We thank Philip Hopkins for making Gizmo public, and providing our group with early access. We thank Robert Thompson for developing Caesar, and the yt team for development and support of yt. NT acknowledges support from the South African Radio Astronomy Observatory, which is a facility of the National Research Foundation, an agency of the Department of Science and Technology. NT and RD acknowldedge support from Newton Mobility Grant NMG-R1-180195 from the U.K. Royal Society. RD acknowledges support from Wolfson Research Merit Award WM160051 from the U.K. Royal Society. DAA acknowledges support by a Flatiron Fellowship. The Flatiron Institute is supported by the Simons Foundation. The Simba simulation was run on the DiRAC@Durham facility managed by the Institute for Computational Cosmology on behalf of the STFC DiRAC HPC Facility. The equipment was funded by BEIS capital funding via STFC capital grants ST/P002293/1, ST/R002371/1 and ST/S002502/1, Durham University and STFC operations grant ST/R000832/1. DiRAC is part of the National e-Infrastructure.
References
- Aird et al. (2010) Aird J., et al., 2010, MNRAS, 401, 2531
- Aird et al. (2012) Aird J., et al., 2012, ApJ, 746, 90
- Anglés-Alcázar et al. (2013) Anglés-Alcázar D., Özel F., Davé R., 2013, ApJ, 770, 5
- Anglés-Alcázar et al. (2015) Anglés-Alcázar D., Özel F., Davé R., Katz N., Kollmeier J. A., Oppenheimer B. D., 2015, ApJ, 800, 127
- Anglés-Alcázar et al. (2017a) Anglés-Alcázar D., Davé R., Faucher-Giguère C.-A., Özel F., Hopkins P. F., 2017a, MNRAS, 464, 2840
- Anglés-Alcázar et al. (2017b) Anglés-Alcázar D., Faucher-Giguère C.-A., Kereš D., Hopkins P. F., Quataert E., Murray N., 2017b, MNRAS, 470, 4698
- Anglés-Alcázar et al. (2017c) Anglés-Alcázar D., Faucher-Giguère C.-A., Quataert E., Hopkins P. F., Feldmann R., Torrey P., Wetzel A., Kereš D., 2017c, MNRAS, 472, L109
- Barausse et al. (2017) Barausse E., Shankar F., Bernardi M., Dubois Y., Sheth R. K., 2017, MNRAS, 468, 4782
- Barišić et al. (2017) Barišić I., et al., 2017, ApJ, 847, 72
- Best & Heckman (2012) Best P. N., Heckman T. M., 2012, MNRAS, 421, 1569
- Bondi (1952) Bondi H., 1952, MNRAS, 112, 195
- Bondi & Hoyle (1944) Bondi H., Hoyle F., 1944, MNRAS, 104, 273
- Bower et al. (2006) Bower R. G., Benson A. J., Malbon R., Helly J. C., Frenk C. S., Baugh C. M., Cole S., Lacey C. G., 2006, MNRAS, 370, 645
- Bruzual & Charlot (2003) Bruzual G., Charlot S., 2003, MNRAS, 344, 1000
- Cao (2010) Cao X., 2010, ApJ, 725, 388
- Chen et al. (2013) Chen C.-T. J., et al., 2013, ApJ, 773, 3
- Choi et al. (2012) Choi E., Ostriker J. P., Naab T., Johansson P. H., 2012, ApJ, 754, 125
- Conselice (2014) Conselice C. J., 2014, ARA&A, 52, 291
- Croton et al. (2006) Croton D. J., et al., 2006, MNRAS, 365, 11
- Davé et al. (2017) Davé R., Rafieferantsoa M. H., Thompson R. J., Hopkins P. F., 2017, MNRAS, 467, 115
- Davé et al. (2019) Davé R., Anglés-Alcázar D., Narayanan D., Li Q., Rafieferantsoa M. H., Appleby S., 2019, arXiv e-prints, p. arXiv:1901.10203
- DeGraf et al. (2015) DeGraf C., Di Matteo T., Treu T., Feng Y., Woo J.-H., Park D., 2015, MNRAS, 454, 913
- Delvecchio et al. (2015) Delvecchio I., et al., 2015, MNRAS, 449, 373
- Di Matteo et al. (2005) Di Matteo T., Springel V., Hernquist L., 2005, Nature, 433, 604
- Di Matteo et al. (2008) Di Matteo T., Colberg J., Springel V., Hernquist L., Sijacki D., 2008, ApJ, 676, 33
- Diamond-Stanic & Rieke (2012) Diamond-Stanic A. M., Rieke G. H., 2012, ApJ, 746, 168
- Donley et al. (2018) Donley J. L., et al., 2018, ApJ, 853, 63
- Dubois et al. (2012) Dubois Y., Devriendt J., Slyz A., Teyssier R., 2012, MNRAS, 420, 2662
- Dubois et al. (2014) Dubois Y., Volonteri M., Silk J., 2014, MNRAS, 440, 1590
- Dubois et al. (2015) Dubois Y., Volonteri M., Silk J., Devriendt J., Slyz A., Teyssier R., 2015, MNRAS, 452, 1502
- Fabello et al. (2011) Fabello S., Kauffmann G., Catinella B., Giovanelli R., Haynes M. P., Heckman T. M., Schiminovich D., 2011, arXiv e-prints, p. arXiv:1104.0414
- Ferrarese & Merritt (2000) Ferrarese L., Merritt D., 2000, ApJ, 539, L9
- Gabor & Davé (2012) Gabor J. M., Davé R., 2012, MNRAS, 427, 1816
- Gabor & Davé (2015) Gabor J. M., Davé R., 2015, MNRAS, 447, 374
- Gebhardt et al. (2000) Gebhardt K., et al., 2000, ApJ, 539, L13
- Genel et al. (2014) Genel S., et al., 2014, MNRAS, 445, 175
- Graham (2016) Graham A. W., 2016, in Laurikainen E., Peletier R., Gadotti D., eds, Astrophysics and Space Science Library Vol. 418, Galactic Bulges. p. 263 (arXiv:1501.02937), doi:10.1007/978-3-319-19378-6_11
- Graham & Driver (2007) Graham A. W., Driver S. P., 2007, ApJ, 655, 77
- Graham et al. (2007) Graham A. W., Driver S. P., Allen P. D., Liske J., 2007, MNRAS, 378, 198
- Haardt & Madau (2012) Haardt F., Madau P., 2012, ApJ, 746, 125
- Habouzit et al. (2017) Habouzit M., Volonteri M., Dubois Y., 2017, MNRAS, 468, 3935
- Hahn & Abel (2011) Hahn O., Abel T., 2011, MNRAS, 415, 2101
- Hale et al. (2018) Hale C. L., Jarvis M. J., Delvecchio I., Hatfield P. W., Novak M., Smolčić V., Zamorani G., 2018, MNRAS, 474, 4133
- Häring & Rix (2004) Häring N., Rix H.-W., 2004, ApJ, 604, L89
- Heckman & Best (2014) Heckman T. M., Best P. N., 2014, ARA&A, 52, 589
- Hickox & Alexander (2018) Hickox R. C., Alexander D. M., 2018, ARA&A, 56, 625
- Hickox et al. (2014) Hickox R. C., Mullaney J. R., Alexander D. M., Chen C.-T. J., Civano F. M., Goulding A. D., Hainline K. N., 2014, ApJ, 782, 9
- Holwerda et al. (2012) Holwerda B. W., Blyth S. L., Baker A. J., 2012, in Tuffs R. J., Popescu C. C., eds, IAU Symposium Vol. 284, The Spectral Energy Distribution of Galaxies - SED 2011. pp 496–499 (arXiv:1109.5605), doi:10.1017/S1743921312009702
- Hopkins (2015) Hopkins P. F., 2015, MNRAS, 450, 53
- Hopkins & Quataert (2011) Hopkins P. F., Quataert E., 2011, MNRAS, 415, 1027
- Hopkins et al. (2006) Hopkins P. F., Somerville R. S., Hernquist L., Cox T. J., Robertson B., Li Y., 2006, ApJ, 652, 864
- Hopkins et al. (2007) Hopkins P. F., Richards G. T., Hernquist L., 2007, ApJ, 654, 731
- Hopkins et al. (2014) Hopkins P. F., Kereš D., Oñorbe J., Faucher-Giguère C.-A., Quataert E., Murray N., Bullock J. S., 2014, MNRAS, 445, 581
- Hopkins et al. (2018) Hopkins P. F., et al., 2018, MNRAS, 480, 800
- Hoyle & Lyttleton (1939) Hoyle F., Lyttleton R. A., 1939, Proceedings of the Cambridge Philosophical Society, 34, 405
- Jarvis et al. (2016) Jarvis M., et al., 2016, in Proceedings of MeerKAT Science: On the Pathway to the SKA. 25-27 May. p. 6 (arXiv:1709.01901)
- Kauffmann & Heckman (2009) Kauffmann G., Heckman T. M., 2009, MNRAS, 397, 135
- Kelly & Merloni (2012) Kelly B. C., Merloni A., 2012, Advances in Astronomy, 2012, 970858
- Kormendy & Ho (2013) Kormendy J., Ho L. C., 2013, ARA&A, 51, 511
- Krumholz & Gnedin (2011) Krumholz M. R., Gnedin N. Y., 2011, ApJ, 729, 36
- Lauer et al. (2007) Lauer T. R., Tremaine S., Richstone D., Faber S. M., 2007, ApJ, 670, 249
- Liu et al. (2019) Liu H., et al., 2019, arXiv e-prints, p. arXiv:1904.12876
- Lusso et al. (2012) Lusso E., et al., 2012, MNRAS, 425, 623
- Madau & Dickinson (2014) Madau P., Dickinson M., 2014, Annual Review of Astronomy and Astrophysics, 52, 415
- Marconi et al. (2004) Marconi A., Risaliti G., Gilli R., Hunt L. K., Maiolino R., Salvati M., 2004, MNRAS, 351, 169
- McConnell & Ma (2013) McConnell N. J., Ma C.-P., 2013, ApJ, 764, 184
- McLure & Jarvis (2004) McLure R. J., Jarvis M. J., 2004, MNRAS, 353, L45
- McLure et al. (2006) McLure R. J., Jarvis M. J., Targett T. A., Dunlop J. S., Best P. N., 2006, MNRAS, 368, 1395
- Merloni & Heinz (2008) Merloni A., Heinz S., 2008, MNRAS, 388, 1011
- Mitra et al. (2015) Mitra S., Davé R., Finlator K., 2015, MNRAS, 452, 1184
- Moster et al. (2018) Moster B. P., Naab T., White S. D. M., 2018, MNRAS, 477, 1822
- Mullaney et al. (2012) Mullaney J. R., et al., 2012, ApJ, 753, L30
- Perna et al. (2017) Perna M., Lanzuisi G., Brusa M., Mignoli M., Cresci G., 2017, A&A, 603, A99
- Planck Collaboration et al. (2016) Planck Collaboration et al., 2016, A&A, 594, A13
- Rahmati et al. (2013) Rahmati A., Pawlik A. H., Raičević M., Schaye J., 2013, MNRAS, 430, 2427
- Reines & Volonteri (2015) Reines A. E., Volonteri M., 2015, ApJ, 813, 82
- Rodighiero et al. (2010) Rodighiero G., et al., 2010, A&A, 515, A8
- Rodighiero et al. (2015) Rodighiero G., et al., 2015, ApJ, 800, L10
- Rosas-Guevara et al. (2015) Rosas-Guevara Y. M., et al., 2015, MNRAS, 454, 1038
- Rosas-Guevara et al. (2016) Rosas-Guevara Y., Bower R. G., Schaye J., McAlpine S., Dalla Vecchia C., Frenk C. S., Schaller M., Theuns T., 2016, MNRAS, 462, 190
- Schaye et al. (2015) Schaye J., et al., 2015, MNRAS, 446, 521
- Schmidt (1959) Schmidt M., 1959, ApJ, 129, 243
- Shankar et al. (2004) Shankar F., Salucci P., Granato G. L., De Zotti G., Danese L., 2004, MNRAS, 354, 1020
- Shankar et al. (2009) Shankar F., Weinberg D. H., Miralda-Escudé J., 2009, ApJ, 690, 20
- Shankar et al. (2016) Shankar F., et al., 2016, MNRAS, 460, 3119
- Shields et al. (2003) Shields G. A., Gebhardt K., Salviander S., Wills B. J., Xie B., Brotherton M. S., Yuan J., Dietrich M., 2003, ApJ, 583, 124
- Sijacki et al. (2015) Sijacki D., Vogelsberger M., Genel S., Springel V., Torrey P., Snyder G. F., Nelson D., Hernquist L., 2015, MNRAS, 452, 575
- Smith et al. (2017) Smith B. D., et al., 2017, MNRAS, 466, 2217
- Somerville & Davé (2015) Somerville R. S., Davé R., 2015, ARA&A, 53, 51
- Somerville et al. (2008) Somerville R. S., Hopkins P. F., Cox T. J., Robertson B. E., Hernquist L., 2008, MNRAS, 391, 481
- Springel (2010) Springel V., 2010, MNRAS, 401, 791
- Springel et al. (2005a) Springel V., Di Matteo T., Hernquist L., 2005a, MNRAS, 361, 776
- Springel et al. (2005b) Springel V., Di Matteo T., Hernquist L., 2005b, MNRAS, 361, 776
- Springel et al. (2018) Springel V., et al., 2018, MNRAS, 475, 676
- Sun et al. (2015) Sun M., et al., 2015, ApJ, 802, 14
- Thomas et al. (2016) Thomas J., Ma C.-P., McConnell N. J., Greene J. E., Blakeslee J. P., Janish R., 2016, Nature, 532, 340
- Trayford et al. (2017) Trayford J. W., et al., 2017, MNRAS, 470, 771
- Vogelsberger et al. (2014) Vogelsberger M., et al., 2014, MNRAS, 444, 1518
- Volonteri (2010) Volonteri M., 2010, A&ARv, 18, 279
- Volonteri et al. (2016) Volonteri M., Dubois Y., Pichon C., Devriendt J., 2016, MNRAS, 460, 2979
- Weinberger et al. (2017) Weinberger R., et al., 2017, MNRAS, 465, 3291
- Weinberger et al. (2018) Weinberger R., et al., 2018, MNRAS, 479, 4056
- Whittam et al. (2018) Whittam I. H., Prescott M., McAlpine K., Jarvis M. J., Heywood I., 2018, MNRAS, 480, 358
- Zolotov et al. (2015) Zolotov A., et al., 2015, MNRAS, 450, 2327