Slowing down of cosmic growth of supermassive black holes: Theoretical prediction of the Eddington ratio distribution
Abstract
We show the Eddington ratio distributions of supermassive black holes at a wide redshift range obtained with a semi-analytic model of galaxy formation. The distribution is broadly consistent with observational estimates at low redshift. We find that the growth rate of black holes at higher redshift is more likely to exceed the Eddington limit because the typical gas fraction of the host galaxies is higher at higher redshift. We also find that the super-Eddington growth is more common for less massive supermassive black holes, supporting an idea that supermassive black holes have been formed via super-Eddington accretion. These results indicate the “slowing down” of cosmic growth of supermassive black holes: the growth of supermassive black holes with a higher Eddington ratio peaks at higher redshift. We also show the effect of the sample selection on the shape of the Eddington ratio distribution functions and find that shallower observations will miss active galactic nuclei with not only the smaller but also higher Eddington ratios.
keywords:
methods: analytical – galaxies: active – galaxies: evolution – galaxies: nuclei – (galaxies:) quasars: supermassive black holes – galaxies: statistics1 Introduction
Previous studies suggest that almost all galaxies at have a supermassive black hole (SMBH) at their centre (e.g. Magorrian et al., 1998). It is believed that SMBHs grow mainly via the gas accretion (Salpeter, 1964; Lynden-Bell, 1969). 111SMBHs would also grow by the BH-BH coalescence (e.g. Kauffmann & Haehnelt, 2000). However, the contribution would be negligible for the cosmic growth of SMBHs, based on the statistical spin estimation for the observed local SMBHs (Marconi et al., 2004) and semi-analytic approach (at least ; Enoki et al., 2004). The growth can be observed as an active galactic nucleus (AGN), which emits light when the material gets accreted onto the SMBH. AGNs also have the kinetic jet and/or outflow, which possibly affect the gas kinematics surrounding the SMBHs and the star formation activity in AGN host galaxies.
As an indicator for how rapid an SMBH grows, the accretion rate and luminosity, which are normalised by the Eddington limit, has been employed. The Eddington luminosity and Eddington accretion rate are defined as
| (1) | |||
| (2) |
where , , and are the gravitational constant, proton mass, cross-section for the Thomson scattering, the speed of light, and the mass of a BH, respectively. The gravitational force balances radiative pressure on the accreted gas in a spherical accretion and illumination case, when the accretion rate, , is (i.e. , assuming that the radiation efficiency of sub-Eddington accretion rate is about ).
Sołtan (1982) finds that the mass density of local SMBHs is explained by integrating luminosity functions (LFs) of QSOs (i.e. the brightest class of AGNs) with the radiation efficiency, ( is the bolometric luminosity of AGNs). This argument also includes the important suggestion for the SMBH growth: the “super-Eddington growth” is not required. The accretion rate normalised by the Eddington accretion rate, , affects the properties of the accretion discs and determines the value of because the structure and temperature distribution of the accretion discs depend on . The value of is for the standard accretion disc (Shakura & Sunyaev, 1973) with a sub-Eddington accretion rate, while a super-Eddington accretion () results in a much smaller (Abramowicz et al., 1988). The Sołtan’s argument and updated results later on (e.g. Yu & Tremaine, 2002), thus, suggest that local SMBHs have grown mainly via sub-Eddington accretions.
However, based on observed accretion rates and inferred durations of super-Eddington AGNs together with the observed trend of higher Eddington ratios at higher redshift (McLure & Dunlop, 2004), Kawaguchi et al. (2004) argue that SMBHs have grown via super-Eddington accretion in the early Universe. The number density of QSOs at the “knee” of the QSO LFs mostly governs the integrated energy density. Namely, little information at other luminosity ranges (such as lower luminosity than the “knee”) is included in the integrated values, resulting in little constraints on less massive SMBHs. The luminosity at the knee corresponds to about , assuming that all AGNs radiate at the Eddington luminosity. Therefore, the Sołtan’s argument seems not to reject the super-Eddington growth of SMBHs with and the contribution of the super-Eddington accretion for the cosmic growth of less massive SMBHs, which are the majority of SMBHs, is unclear.
Estimations of the Eddington ratio distribution functions (ERDFs) based on observational data suffer severely from a flux-limit, a matter of completeness, and a priori assumptions (e.g. log-normal distribution of ERDFs). For instance, ERDFs at estimated by Kelly & Shen (2013, hereafter KS13) have a uncertainty in the number density for a given of more than 2 dex. Despite the difficulties for obtaining the Eddington ratio, observations reveal the evolution of the ERDFs and relations between Eddington ratio and properties of the AGNs and their host galaxies. KS13 estimate the “growth timescale” defined as , where , and are the Salpeter time, the seed BH mass and the mean value of at a fixed and , respectively, and and . They find that the timescale for type-1 QSOs with at , is comparable to or longer than the age of the Universe, which suggests that such an SMBH population would have grown with the higher Eddington ratio at higher redshift. Indeed, recent observations find QSOs at with which are growing at (Mortlock et al., 2011; Wu et al., 2015; Bañados et al., 2018). Other observations (e.g. Nobuta et al., 2012; Shen & Kelly, 2012; Lusso et al., 2012; Bongiorno et al., 2016; Aird et al., 2018) also show the Eddington ratio becomes higher at higher redshift. Theoretical studies for the formation of galaxies and SMBHs (i.e. cosmological simulations and semi-analytic models of galaxy formation; hereafter SA models) also investigate the evolution of the ERDFs and find that super-Eddington growth is more common for SMBHs at higher redshift (e.g. Hirschmann et al., 2014; Sijacki et al., 2015).
The contribution of the super-Eddington accretion to the cosmic growth of SMBHs is important to discuss the mass of seed black holes. Observations have found luminous quasars at , of which SMBH masses estimated as (e.g. Mortlock et al., 2011; Wu et al., 2015; Bañados et al., 2018). There are three possibilities for explaining the existence of such massive SMBHs in the early Universe: (1) their seed BH masses are large, namely, , (2) their seed BHs are small () and formed soon after the birth of the Universe, and then grow continuously with the Eddington-limited accretion, and (3) their seed BHs are small () and grow via super-Eddington accretion. However, “heavy seed BHs” should form only in special conditions (e.g. Omukai et al., 2008) and thus such “heavy seed BHs” should not be dominant (see also Shirakata et al., 2016). Although the formation time of the seed BH of SMBHs with at is unclear, the super-Eddington growth might play a key role in the early growth of SMBHs since the typical Eddington ratio becomes higher at higher redshift (Wu et al., 2015).
In this paper, we present a theoretical prediction for the ERDFs obtained with an SA model, “New Numerical Galaxy Catalogue ()” that has explained many observational properties of galaxies and AGNs, such as the evolution of LFs and stellar mass functions, local – relation, and size/velocity – magnitude relations of local galaxies. We focus on the importance of the super-Eddington growth for different SMBH mass ranges. We also show the effect of the sample selection for obtaining the ERDFs and the dependence of the ERDFs on AGN host galaxies, which has not been studied in depth. The modelling and values of adjustable parameters are the same as Shirakata et al. (2019), which present the detailed model description. This paper is organised as follows. In Sec. 2, we briefly describe the growth model of SMBHs. In Sec. 3, we show the ERDF obtained with the fiducial model (Shirakata et al., 2019) and show the effect of the sample selections. In Sec. 4, we discuss the properties of host galaxies and their relations to the Eddington ratio. Finally, we summarise the results in Sec. 5. Unless otherwise stated, we employ the -body simulation (Ishiyama et al., 2015) with the largest box size Mpc and particles (the smallest halo mass is ).
2 SMBH Growth Model
We briefly describe the modelling of the SMBH growth (Shirakata et al., 2019, for more details). The seed BH mass is for all seed BHs which are placed when a galaxy newly forms. We assume that an SMBH grows with its host bulge via starbursts induced by galaxy mergers and/or disc instabilities. The accreted gas mass onto the SMBH, , and stellar mass formed by a starburst, , have the following relation:
| (3) |
where is chosen to reproduce the local – relation.
The gas accretion rate is described as follows:
| (4) |
where and are the starting time of the accretion and the accretion timescale per one accretion event, respectively. We use the same model of the accretion timescale as Shirakata et al. (2019), . The first term of the right-hand side is proportional to the dynamical time of their host bulges, , where the values of free parameter, , is . The second term represents the timescale for the angular momentum loss in the “gas reservoir” (e.g. circumnuclear discs) and accretion disc. We define as , where the free parameters, , , and , are 1.0 Gyr, 3.5, and -4.0, respectively (see Shirakata et al., 2019).
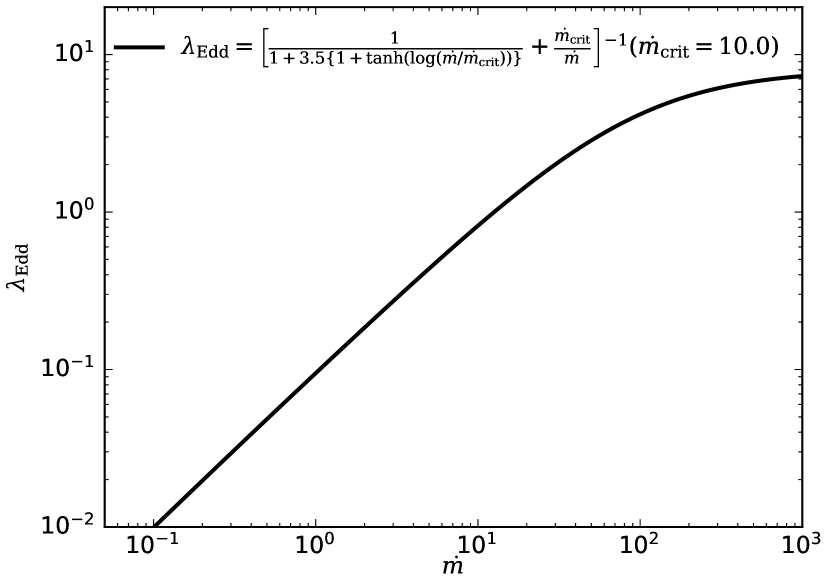
The AGN bolometric luminosity is described with () as
| (5) |
The luminosity of a super-Eddington disc is expected to scale in a logarithmic way (e.g. Mineshige et al., 2000), in principle. Here we employ the formula, Eq. 5, based on Kawaguchi (2003), which takes into account various corrections (e.g. gravitational redshift, transverse Doppler effect, etc.). In this paper, is assumed. The behaviour of the formula is shown in Fig. 1. The radiation efficiency, is defined as . In the super-Eddington regime (i.e. ), gradually decreases from at . The value of is until , and at . For deriving the hard -ray (2-10 keV) luminosity of AGNs, , we employ a bolometric correction obtained by the Marconi et al. (2004). For broad-band luminosities in the optical bands, the bolometric correction of AGNs, , is calculated with a template spectral energy distribution of AGNs presented in Kawaguchi et al. (2001), considering the Doppler shift of the wavelength. For - and - bands (the effective wavelengths are 4700 and 7472 Å, respectively), and , respectively, at .
3 The Eddington Ratio Distribution Functions
3.1 Theoretical Predictions
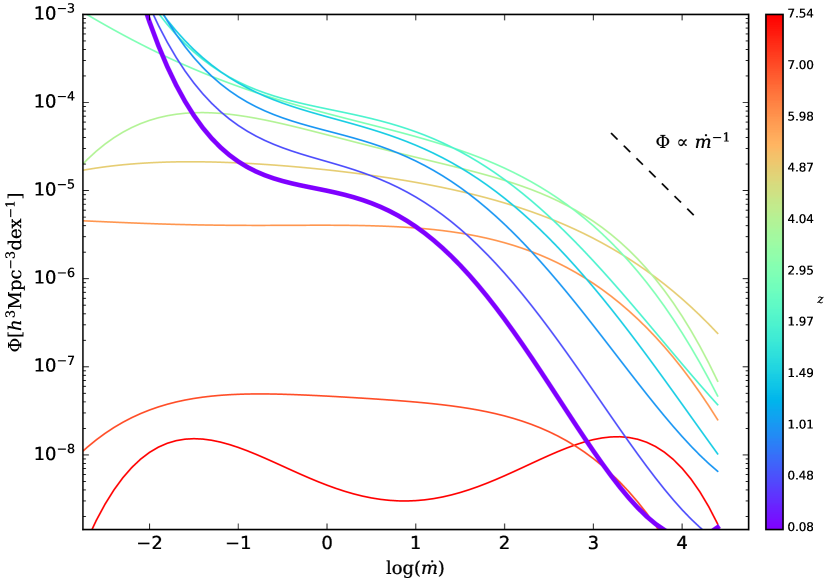
In Fig. 2, we show the ERDFs at with the fiducial model. In this paper, the ERDF is defined as , or , which is the number density with a fixed or . The left and right panels show the distribution of and , respectively, for all AGNs (i.e. and ). The bolometric luminosity corresponds to the Eddington luminosity when . The dashed line in the left panel indicates a critical slope () at which the gas accretion with different contributes to SMBH growth equally (i.e. ). The thick solid lines describe the ERDFs at . The values of monotonically increases from to with a similar shape and decreases at higher redshift with a flatter slope at and . The slope of the ERDFs becomes flatter at higher redshift, meaning that the relative number of AGNs with higher Eddington ratio increases at higher redshift. Upper label in Fig. 2 shows SMBH growth timescale, . If the growth timescale is shorter than the age of the Universe at a given redshift, then the SMBH can acquire their mass by gas accretion until that redshift without requiring heavy (i.e. ) seed BH. Thanks to the super-Eddington accretion, SMBHs can grow much faster than Myr (i.e. Salpeter timescale with ), which is much less than the age of the Universe at which the SMBHs exist.
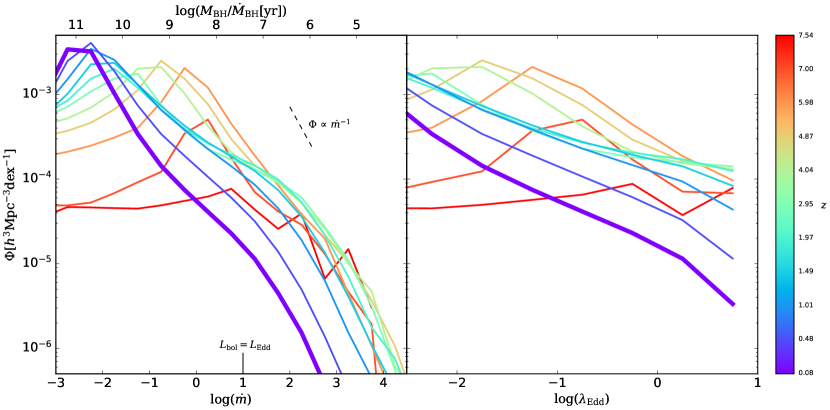
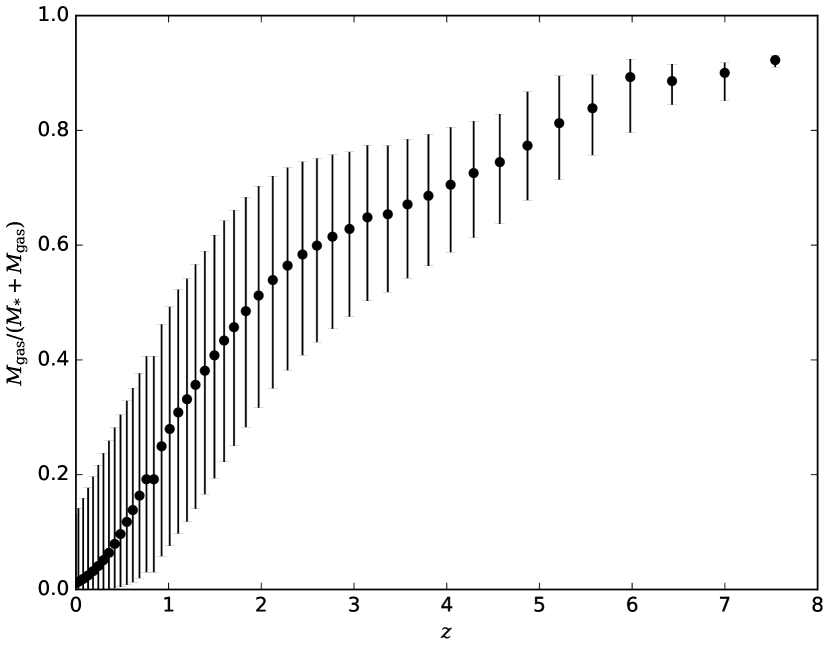
The reason why SMBH growths at higher redshift have higher Eddington ratio is shown in Fig. 3. The figure shows the evolution of the gas fraction of AGN host galaxies, defined as , where and are the cold gas and stellar masses of a galaxy (disc bulge), respectively. The gas fraction is higher at higher redshift, e.g. at . A higher gas fraction leads to a high , in general. Therefore, the Eddington ratio tends to be higher at higher redshift even if the SMBH mass is the same.
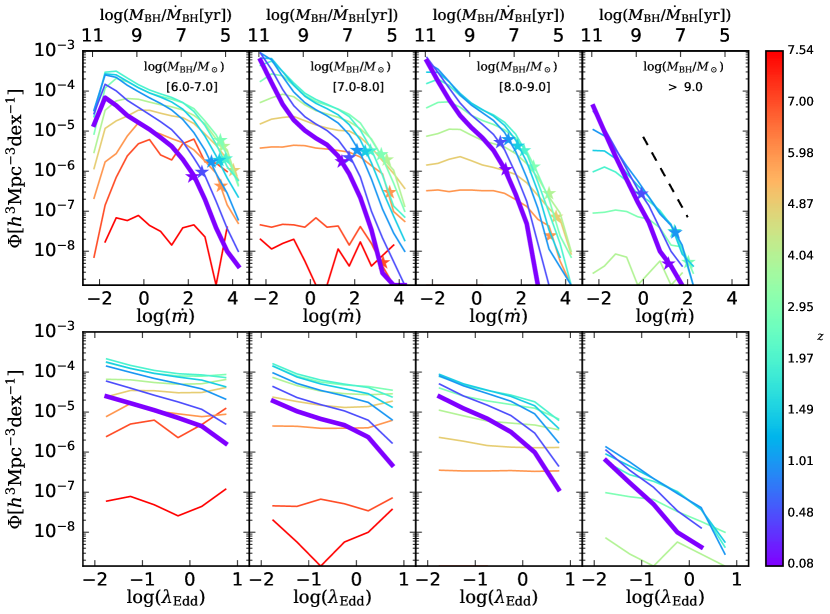
To present the mass dependence on the ERDFs, we show the ERDFs of AGNs with erg/s for different SMBH mass bins, , , , and , respectively, in Fig. 4. The colour of each line indicates the redshift, , as shown in the colour bar. The thick solid lines describe the ERDFs at . The values of for subsample with , and monotonically increases with a similar shape from to , , , and , respectively, and decreases at higher redshifts with a flatter slope at and . Our calculation shows that ERDFs, not only at higher redshift but also with less massive BHs tend to have flatter slopes, indicating that present day SMBHs are formed via super-Eddington accretion at higher redshifts.
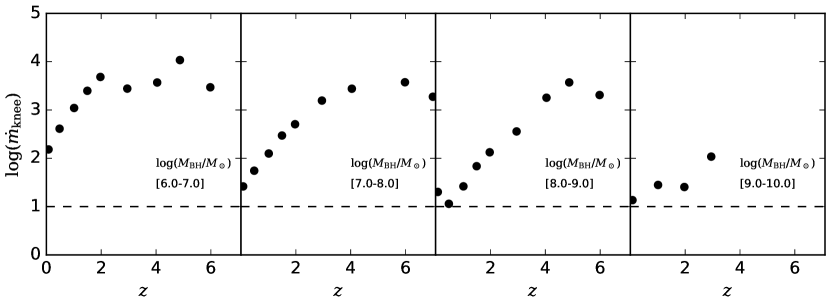
We then define as at which the ERDF has the critical slope () and has the largest value. Accretion with contributes to the SMBH growth most at that redshift and at that range. We obtain the points of contact by fitting ERDFs of with fourth-order functions at . An example of the fitting results is shown in Fig. 5 for . Because of the difficulties for obtaining smooth curves of ERDFs, the fitting result has a larger uncertainty at higher redshift.
Fig. 6 shows the relation between and redshift of the same subsample as Fig. 4. In all SMBH mass ranges, increases towards higher redshift. Besides, is larger for less massive SMBHs when we compare AGNs at a fixed redshift. These evolutions in redshift and mass indicate that super-Eddington accretion is more common for less massive SMBHs and AGNs at higher redshift. These results of the Eddington ratio evolution are consistent with another approach to constraining the SMBH growth by integrating the AGN LFs and the SMBH MFs (Sołtan, 1982; Chokshi & Turner, 1992), showing that the sub-Eddington accretion is responsible for SMBH growth at (e.g., Yu & Tremaine, 2002; Fabian & Iwasawa, 1999). For lower SMBH masses and higher redshifts, in contrast, our model shows that the super-Eddington accretion is the primary growth mode of SMBHs.
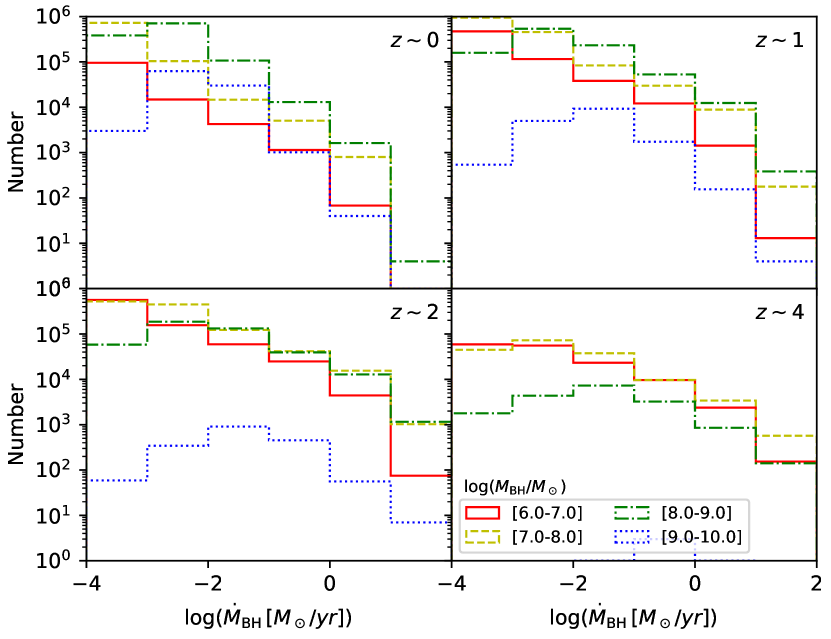
The dependence of ERDFs on the SMBH mass comes from the denominator of , i.e. itself, which is proportional to the SMBH mass. Fig. 7 shows the distribution of with four SMBH mass bins at and . The accretion rate, , which is not normalised by the Eddington accretion rate, has no clear trends with the SMBH mass. The distribution of and means that the accretion rate is not regulated by the SMBH mass nor the Eddington limit. We note that the accretion rate irrespective of the SMBH mass nor the Eddington limit is also supported observationally (Collin & Kawaguchi, 2004), where the maximum accretion rate of AGNs with different SMBH masses are similar at .
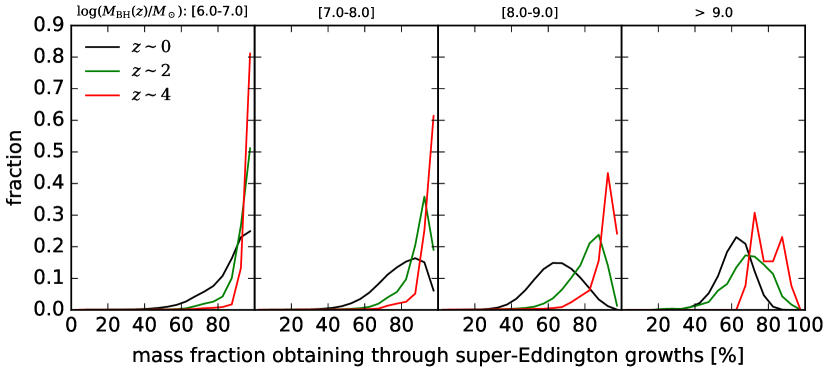
In this section, we have shown that the number fraction of AGNs with super-Eddington growth is higher at higher redshift or for less massive SMBHs, as suggested from the slope of ERDFs. Here, we show this trend in a different view. Each SMBH has a certain relative fraction of the mass acquired via super-Eddington growth out of the total SMBH mass. Fig 8 shows the distribution of such mass fraction, for SMBHs at different mass ranges and different redshift. As seen in Figs. 2, 4, and 6, super-Eddington growth becomes more dominant at higher redshift for a given SMBH mass range. Also, for a given redshift, SMBHs with smaller masses have larger fractions of the mass obtained by super-Eddington accretion. Further analysis, in the context of the Sołtan’s argument, will be presented in a subsequent paper.
3.2 Comparisons with Observations
Here we compare our results with observations. We note that we do not assume the obscuration of AGNs for simplicity: we assume the obscured fraction is zero since it could depend on the bolometric luminosity and the Eddington ratio itself (e.g. Lusso et al., 2012) and the dependencies are unclear. The equivalent comparisons with observations cannot be made now, and we leave them for future studies.
Fig. 9 shows the comparison of the fiducial model with observations of the ERDF (Schulze & Wisotzki, 2010; Nobuta et al., 2012). We select AGNs with a similar sample selection to each observational study (black lines). In this case, the model ERDF is roughly consistent with observations. Without the SMBH mass limit, however, the slope of the model ERDFs become flatter than observed since the accretion rate of less massive SMBHs in the model can easily reach and exceed the Eddington limit. The difference of the slope becomes larger at higher redshift, which suggests the importance of deeper observations (resulting in a weaker mass limit) to obtain ERDFs more accurately.
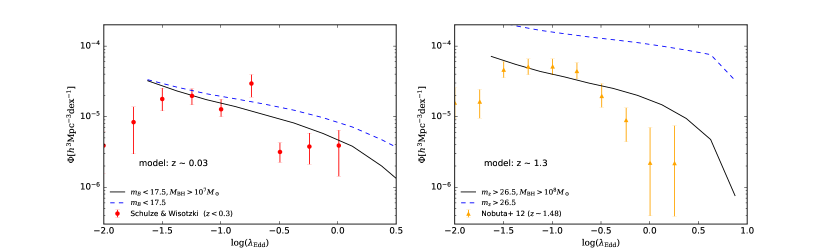
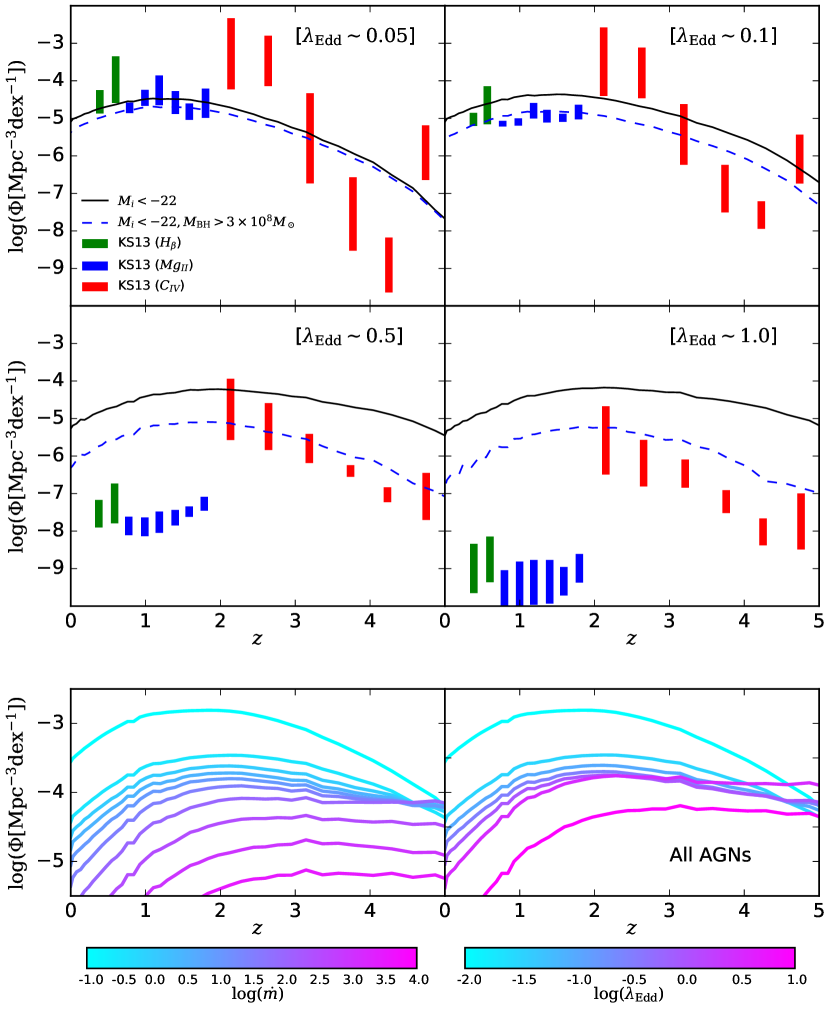
Fig. 10 shows the evolution of the number density of AGNs for different ranges. The model results for AGNs with and those with and are shown in the upper four panels, where is the absolute magnitude in -band. The latter selection is similar to that of KS13, based on SDSS data. Our results, especially with the latter sample selection, are consistent with the estimates of KS13. However, the results of KS13 have a discontinuous shape, which is likely to be originated from the difference of the emission lines used for the estimation. Since their typical equivalent-widths are different from line to line, the effective depth of spectroscopic surveys changes when one changes the emission line to use. In other words, observational determination of ERDFs at high redshift is very uncertain and is not yet ready for comparison with models. Deeper surveys such as those with the Subaru Prime Focus Spectrograph (Takada et al., 2014) are needed. We find that there is a trend that higher ranges present their peak number density at higher redshift, which is qualitatively consistent with KS13. Namely, the more rapid growth occurres at higher redshift, indicating the slowing down, decelerating or slacking of cosmic SMBH growth. This trend can be seen in the bottom panels of Fig. 10, in which we present the redshift evolution of the number density of AGNs for each and (left and right panels, respectively) indicated by the colour of lines. In these panels, we select all AGNs with erg/s. While the number density of the higher Eddington ratio remains constant at and decreases at lower redshift, that of the lower Eddington ratio gradually increases towards lower redshift, clearly indicating the slowing down of cosmic SMBH growth.
As shown in Fig. 4, our model predicts that super-Eddington accretion becomes more important at higher redshift and for relatively lesser massive SMBHs. Observational determinations of ERDFs tend to underestimate the number density of super-Eddington accreting AGNs, whose optical flux is under the observational limit and/or whose SMBH mass has not been evaluated, and undervalue the importance of the super-Eddington growth (see also Fig. 9).
Fig. 11 shows the ERDF at varying the sample selection. We show the results with different absolute luminosity cuts, , , and erg/s, and flux cuts, (SDSS-DR7 catalogue; Schneider et al. 2010), (SDSS-DR10 catalogue; Pâris et al. 2017), and (Subaru HSC-SSP wide layer; Aihara et al. 2017). We include all AGNs which satisfy the above cuts without considering the type-2 fraction or obscured fraction. We note that the model predicts the consistent ratio of local sub- and super-Eddington AGNs suggested by various low- observations (Kawaguchi et al., 2004). In Kawaguchi et al. (2004), ranges for are estimated from the disc model by Fig. 11 of Kawaguchi (2003), resulting in % objects in , and % in . When the shallower sample selections are applied, the number density of the AGNs with smaller Eddington ratios decreases. Also, the slope and the normalisation at a higher Eddington regime are affected by the sample selection since our model predicts that super-Eddington growth is more common for less massive SMBHs. The effect of the sample selection becomes more critical at higher redshift. The results imply that spectroscopic follow up observations and SMBH mass measurements including less luminous AGNs play a crucial role in obtaining nearly “complete” ERDFs and understanding the cosmic growth of SMBHs.
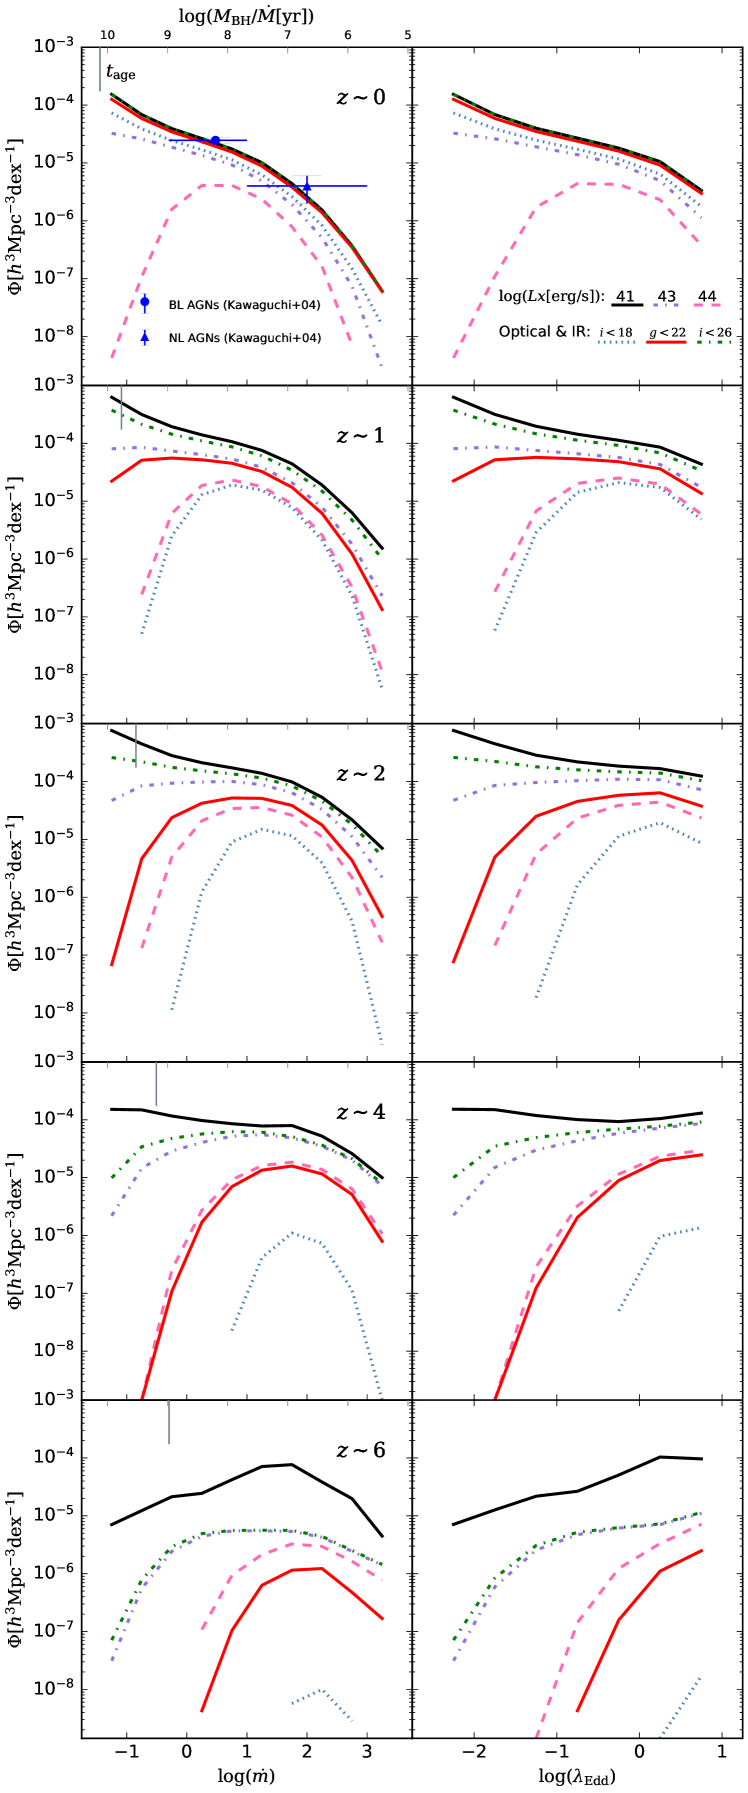
The shape of ERDFs with a luminosity/flux cut would change by the bolometric correction. We employ the bolometric correction independent from the Eddington ratio and SMBH mass (Marconi et al., 2004), although Jin et al. (2012) suggest that it depends on the Eddington ratio and SMBH mass. With the type-1 AGN sample at , Jin et al. (2012) also suggest that more luminous AGNs tend to radiate a smaller amount of optical and -ray light, which is the opposit trend to that presented in Marconi et al. (2004). When we employ the -dependency of the bolometric correction of Jin et al. (2012), model ERDFs with a luminosity/flux cut will become steeper at high regime and become more consistent with current observations. Since the bolometric correction has large uncirtainty, we simply employ Marconi et al. (2004) in this paper.
4 Discussion
In Sec. 3.2, the shape of the ERDFs with a luminosity/flux cut would change by the bolometric correction. The shape could also change by the effect of winds/outflows with super-Eddington accretions. Takeo et al. (2018) perform two dimensional radiation hydrodynamic simulations of gas accretions for BHs with and with , whose initial gas distribution is uniform and the gas is in the neutral state. For BHs with , the radiation by the gas accretion heats up the surrounding gas to due to the recombination by hydrogen. Takeo et al. (2018) conclude that in this case, the outflow rate becomes % of the mass accretion rate. Jiang et al. (2017) employ the three dimensional radiation magneto-hydrodynamical simulations and find that the outflow rate decreases % of the mass accretion rate for a BH with and with . Although the shape of ERDFs would change by the winds, the effects are expected not to be significant and beyond the scope of this paper. We leave the introduction of the wind effect for future studies for diminishing the degree of freedom.
Previous studies with SA models have also presented the ERDFs. Fanidakis et al. (2012) give the evolution of ERDFs with . Their ERDFs show almost no evolution of the slope for the high Eddington ratio, in contrast to our study. Hirschmann et al. (2012, 2014), on the other hand, predict flatter ERDFs at higher redshift, which is broadly consistent with our result. In Hirschmann et al. (2012, 2014), they employ constant () Eddington ratio for AGNs triggered by disc instabilities and an Eddington ratio distribution for AGNs triggered by mergers obtained by merger simulations, where an AGN host galaxy with a higher cold gas fraction produces an AGN with a higher Eddington ratio. Both Fanidakis et al. (2012) and Hirschmann et al. (2014) show the bimodal distribution of ERDFs, which are caused by the different accretion disc properties (i.e. advection-dominated accretion flow and standard disc) and/or different accretion modes (i.e. hot-halo mode and starburst/QSO mode). The evolution of the peak in the ERDF in the standard disc regime is broadly consistent with our results; the peak move to lower Eddington ratio at lower redshift. Since the advection-dominated accretion flow regime is out of the observable regime and the bolometric correction in this regime is unclear, we leave the detailed analysis in this regime for future studies. We note that the model of the gas accretion is different in different SA models. To discriminate the models, ERDFs, which will be obtained by future observations, are required.
In Sec. 3, we have shown that the shape of ERDFs depends on the redshift and mass of SMBHs. The mass dependence of the ERDFs is still unclear in observations. Observationally, there have been some studies about the relation between the Eddington ratio and properties of AGN host galaxies, 222Since the “true” Eddington ratio is difficult to estimate, the AGN luminosity (-ray luminosity, especially) divided by the stellar mass of the host galaxy is sometimes used as a proxy for the Eddington ratio. which are also essential for understanding the cosmic growth and coevolution of SMBHs and their host galaxies. As an example, Bongiorno et al. (2016) obtain and its distribution instead of the Eddington ratio. They argue that the shape of the distribution is independent of the stellar mass although the normalisation is different. Although Bongiorno et al. (2016) find no dependence of the shape of ERDFs on the stellar mass, their results are obtained with the assumption of at . This assumption is reasonable and can be compared with our model results for local bulge-dominated galaxies. However, since the host galaxies of AGNs have various morphologies (e.g. Bruce et al., 2015) and the fraction of disc-dominated galaxies becomes higher with less massive galaxies (e.g. Lang et al., 2014), the mass of SMBHs could be smaller than especially for less massive galaxies at higher redshift. Therefore, the assumption of the mass ratio between SMBHs and their host galaxies can affect the mass dependence on the ERDFs.
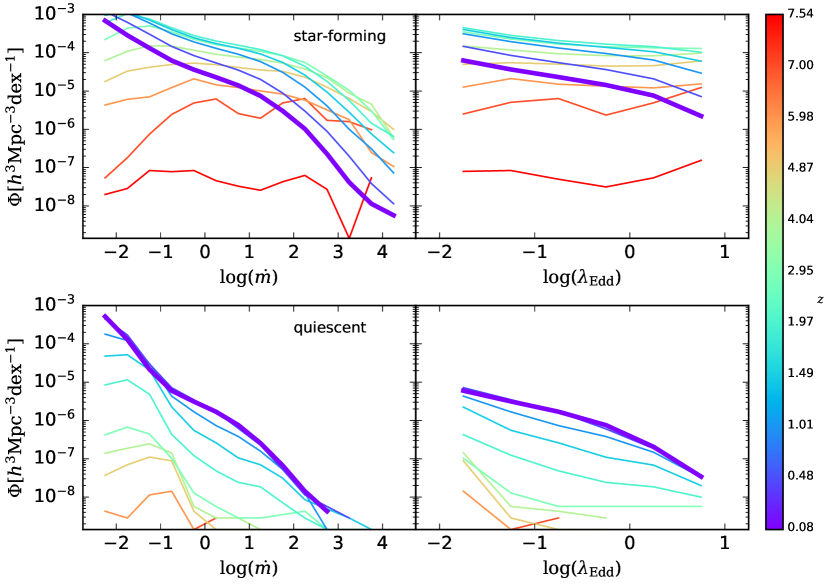
Bernhard et al. (2018), in contrast to Bongiorno et al. (2016), suggest the suppression of AGNs with in galaxies with to explain both observed AGN LFs and relationship between star formation rate and . Bernhard et al. (2018) estimate ERDFs separately for star-forming/quiescent host galaxies by requiring to explain both observed AGN LFs in hard -ray and stellar mass functions. They use the same assumption of as Bongiorno et al. (2016) for obtaining the Eddington ratio. They find that ERDFs of AGNs in star-forming galaxies at have peaky shape and the peak shifts toward higher value with redshift. In their estimate, the peak is at at and at when the mass-independent ERDFs are assumed. However, the Eddington ratio for star-forming host galaxies obtained by our fiducial model has a broad distribution (in contrast to the suggestion by Bernhard et al. 2018) as shown in Fig. 12. We define star-forming galaxies by their specific star formation rate (sSFR) larger than (Ilbert et al., 2013), which is the similar definition to Bernhard et al. (2018). The slope of ERDFs for star-forming host galaxies in our model becomes flatter at higher redshift in agreement with Bernhard et al. (2018) in the sense that becomes larger at higher redshift on average. Similar to the whole sample (Figs. 2 and 4), the ERDFs of AGNs in star-forming galaxies show that larger is more common at higher redshift. ERDFs for quiescent galaxies, on the other hand, are biased to low Eddington ratio range. Also, quiescent galaxies at do not host AGNs with erg/s. Since the methods for obtaining ERDFs are different, the direct comparison with Bernhard et al. (2018) is still difficult although it is important for constraining the triggering mechanisms and the duty cycle of AGNs. We leave further investigation for future studies.
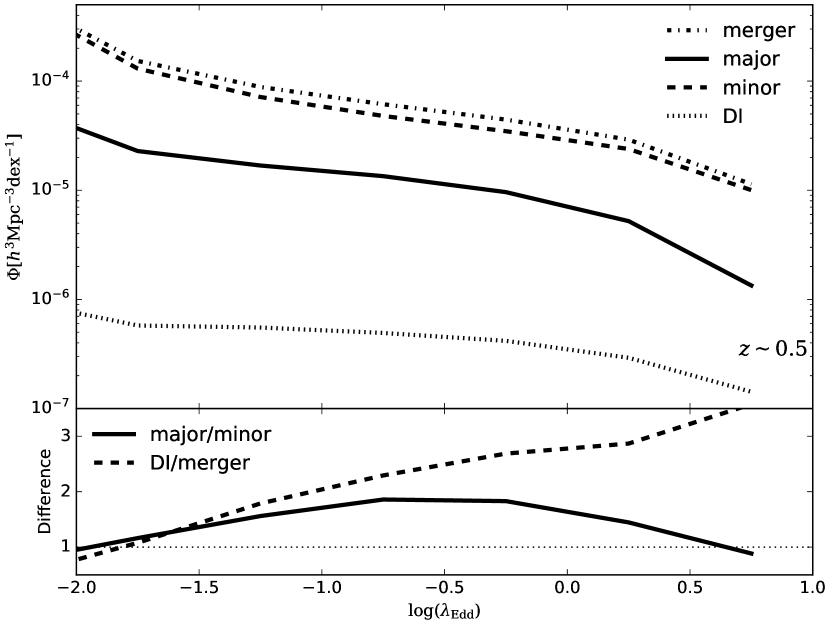
Finally, we focus on the difference of the ERDF caused by the different triggering mechanisms of AGNs. Weigel et al. (2018), based on a phenomenological model, obtain ERDFs of AGNs triggered by galaxy mergers to reproduce observed AGN LFs and the relation between AGN luminosity and the AGN merger fraction. They find that although mergers of galaxies are important for triggering AGNs, AGNs in merging galaxies do not have higher Eddington ratios compared with those in galaxies without mergers. To check the effect of triggering mechanisms on the shape of ERDFs, we perform a Kolmogorov-Smirnov test and check the statistical difference of ERDFs in our calculations by triggering mechanisms at (since the sample size is small at larger redshift). We compare AGNs with erg/s and by their triggering mechanisms in the following two ways: (1) major mergers and minor mergers, and (2) mergers (major minor) and disc instabilities. We find that in both cases, the -value is less than 3 percent, which means that two distributions have different shape at all redshift bins. We show the ERDFs of AGNs with different triggering mechanisms at in the top panel of Fig. 13. Dotted line shows AGNs triggered by disc instabilities and dashed and solid lines are AGNs triggered by minor and major mergers, and dot dashed line describes the sum of dashed and solid lines (i.e. AGNs triggered by mergers), respectively. As for merger-driven AGNs, we find that the ERDF shape is similar independent of the merging mass ratio, although the -value is small. On the other hand, AGNs triggered by disc instabilities tend to have a flatter distribution. To show these differences more clearly, we show the ratio of the normalised ERDFs in the bottom panel of Fig. 13. Since ERDFs of AGNs triggered by disc instabilities have a flatter shape, the difference (DI/merger) becomes larger at larger .
Our result shows that AGNs triggered by major mergers do not have higher than those triggered by other mechanisms, which is broadly consistent with Weigel et al. (2018). The relation between the shape of the ERDFs and the triggering mechanisms of AGN activities will provide an important information for the cosmic growth of SMBHs and galaxies. If the major mergers tend to induce AGNs with higher Eddington ratio, it means that the SMBH growth via major mergers are more rapid and the SMBH growth rate will depend on the environment of its host galaxy.
5 Conclusion
We have presented a theoretical prediction for the ERDFs. The calculation is based on our SA model that has explained many observational properties of galaxies and AGNs, such as LFs, stellar mass functions, – relation, and size/velocity – magnitude relations of galactic discs and bulges.
We have found that SMBH growths via super-Eddington accretions become more significant at higher redshift because the typical gas fraction of the host galaxies is higher at higher redshift. This tendency has been also suggested by observational studies (e.g. Nobuta et al., 2012) at . Also, Wu et al. (2015) show that QSOs at grow with . Our model provides the detailed evolution of the Eddington ratio distribution beyond and support the observed trend continues from to . We have also found that the SMBH growth with the higher Eddington ratio contributes to the SMBH growth of less massive SMBHs, indicating that SMBHs have grown via super-Eddington accretion. We have also found the slowing down of cosmic growth of SMBHs; a trend that higher ranges present their peak number density at higher redshift.
To compare the model results with observations and to understand the SMBH growth, it is important to take the observed sample selection into account. Shallower observations tend to underestimate the number density of AGNs not only with lower but also higher Eddington ratios. The slope of ERDFs, therefore, is sensitive to the sample selection. ERDFs of AGNs with different properties of their host galaxies would provide the information on the co-evolution. Such detailed analysis will be observationally available in the era of deep spectroscopic surveys with a larger sample size.
Acknowledgements
We appreciate the detailed review and useful suggestions by the referee, which have improved our paper. We appreciate the fruitful comments from the observational side by M. Akiyama, W. He, and T. Kawamuro. We also thank T. Ishiyama, M. A. R. Kobayashi, R. Makiya, M. Enoki, and K. Okoshi for the development of GC and discussions. H. Shirakata has been supported by the Sasakawa Scientific Research Grant from the Japan Science Society (29-214), JSPS KAKENHI (18J12081), and a grant from the Hayakawa Satio Fund awarded by the Astronomical Society of Japan. T. Kawaguchi was supported in part by JSPS KAKENHI (17K05389), grant from the Japan research institute of industrial science, and Japan Foundation for Promotion of Astronomy. T. Okamoto is financially supported by MEXT KAKENHI Grant (18H04333). M. Nagashima has been supported by the Grant-in-Aid (25287041 and 17H02867) from the MEXT of Japan. This work was also supported in part by World Premier International Research Center Initiative (WPI), MEXT, Japan, by MEXT Priority Issue 9 on Post-K Computer (Elucidation of the Fundamental Laws and Evolution of the Universe), and by JICFuS.
References
- Abramowicz et al. (1988) Abramowicz M. A., Czerny B., Lasota J. P., Szuszkiewicz E., 1988, ApJ, 332, 646
- Aihara et al. (2017) Aihara H., et al., 2017, Publications of the Astronomical Society of Japan, 70
- Aird et al. (2018) Aird J., Coil A. L., Georgakakis A., 2018, MNRAS, 474, 1225
- Bañados et al. (2018) Bañados E., et al., 2018, Nature, 553, 473
- Bernhard et al. (2018) Bernhard E., Mullaney J. R., Aird J., Hickox R. C., Jones M. L., Stanley F., Grimmett L. P., Daddi E., 2018, MNRAS, 476, 436
- Bongiorno et al. (2016) Bongiorno A., et al., 2016, A&A, 588, A78
- Bruce et al. (2015) Bruce V., Dunlop J., Mortlock A., Kocevski D., McGrath E., Rosario D., 2015
- Chokshi & Turner (1992) Chokshi A., Turner E. L., 1992, MNRAS, 259, 421
- Collin & Kawaguchi (2004) Collin S., Kawaguchi T., 2004, A&A, 426, 797
- Enoki et al. (2004) Enoki M., Inoue K. T., Nagashima M., Sugiyama N., 2004, ApJ, 615, 19
- Fabian & Iwasawa (1999) Fabian A. C., Iwasawa K., 1999, MNRAS, 303, L34
- Fanidakis et al. (2012) Fanidakis N., et al., 2012, MNRAS, 419, 2797
- Hirschmann et al. (2012) Hirschmann M., Somerville R. S., Naab T., Burkert A., 2012, MNRAS, 426, 237
- Hirschmann et al. (2014) Hirschmann M., Dolag K., Saro A., Bachmann L., Borgani S., Burkert A., 2014, MNRAS, 442, 2304
- Ilbert et al. (2013) Ilbert O., et al., 2013, A&A, 556, A55
- Ishiyama et al. (2015) Ishiyama T., Enoki M., Kobayashi M. A. R., Makiya R., Nagashima M., Oogi T., 2015, PASJ, 67, 61
- Jiang et al. (2017) Jiang Y.-F., Stone J., Davis S. W., 2017, arXiv e-prints,
- Jin et al. (2012) Jin C., Ward M., Done C., 2012, MNRAS, 425, 907
- Kauffmann & Haehnelt (2000) Kauffmann G., Haehnelt M., 2000, MNRAS, 311, 576
- Kawaguchi (2003) Kawaguchi T., 2003, ApJ, 593, 69
- Kawaguchi et al. (2001) Kawaguchi T., Shimura T., Mineshige S., 2001, ApJ, 546, 966
- Kawaguchi et al. (2004) Kawaguchi T., Aoki K., Ohta K., Collin S., 2004, A&A, 420, L23
- Kelly & Shen (2013) Kelly B. C., Shen Y., 2013, ApJ, 764, 45
- Lang et al. (2014) Lang P., et al., 2014, ApJ, 788, 11
- Lusso et al. (2012) Lusso E., et al., 2012, MNRAS, 425, 623
- Lynden-Bell (1969) Lynden-Bell D., 1969, Nature, 223, 690
- Magorrian et al. (1998) Magorrian J., et al., 1998, AJ, 115, 2285
- Marconi et al. (2004) Marconi A., Risaliti G., Gilli R., Hunt L. K., Maiolino R., Salvati M., 2004, MNRAS, 351, 169
- McLure & Dunlop (2004) McLure R. J., Dunlop J. S., 2004, MNRAS, 352, 1390
- Mineshige et al. (2000) Mineshige S., Kawaguchi T., Takeuchi M., Hayashida K., 2000, PASJ, 52, 499
- Mortlock et al. (2011) Mortlock D. J., et al., 2011, Nature, 474, 616
- Nobuta et al. (2012) Nobuta K., et al., 2012, ApJ, 761, 143
- Omukai et al. (2008) Omukai K., Schneider R., Haiman Z., 2008, ApJ, 686, 801
- Pâris et al. (2017) Pâris I., et al., 2017, Astronomy & Astrophysics, 597, A79
- Salpeter (1964) Salpeter E. E., 1964, ApJ, 140, 796
- Schneider et al. (2010) Schneider D. P., et al., 2010, AJ, 139, 2360
- Schulze & Wisotzki (2010) Schulze A., Wisotzki L., 2010, A&A, 516, A87
- Shakura & Sunyaev (1973) Shakura N. I., Sunyaev R. A., 1973, A&A, 24, 337
- Shen & Kelly (2012) Shen Y., Kelly B. C., 2012, ApJ, 746, 169
- Shirakata et al. (2016) Shirakata H., et al., 2016, MNRAS, 461, 4389
- Shirakata et al. (2019) Shirakata H., et al., 2019, MNRAS, 482, 4846
- Sijacki et al. (2015) Sijacki D., Vogelsberger M., Genel S., Springel V., Torrey P., Snyder G. F., Nelson D., Hernquist L., 2015, Monthly Notices of the Royal Astronomical Society, 452, 575
- Sołtan (1982) Sołtan A., 1982, MNRAS, 200, 115
- Takada et al. (2014) Takada M., et al., 2014, PASJ, 66, R1
- Takeo et al. (2018) Takeo E., Inayoshi K., Ohsuga K., Takahashi H. R., Mineshige S., 2018, MNRAS, 476, 673
- Weigel et al. (2018) Weigel A. K., Schawinski K., Treister E., Trakhtenbrot B., Sanders D. B., 2018, MNRAS, 476, 2308
- Wu et al. (2015) Wu X.-B., et al., 2015, Nature, 518, 512
- Yu & Tremaine (2002) Yu Q., Tremaine S., 2002, MNRAS, 335, 965