∎
e1e-mail: stefano.cali@cern.ch \thankstexte2e-mail: suzanne.klaver@cern.ch \thankstexte3e-mail: marcello.rotondo@cern.ch \thankstexte4e-mail: barbara.sciascia@cern.ch
Impacts of radiative corrections on measurements of lepton flavour universality in decays
Abstract
Radiative corrections to decays may have an impact on predictions and measurements of the lepton flavour universality observables and . In this paper, a comparison between recent calculations of the effect of soft-photon corrections on and , and corrections generated by the widely used package Photos is given. The impact of long-distance Coulomb interactions, which are not simulated in Photos, is discussed. Furthermore, the effect of high-energy photon emission is studied through pseudo-experiments in an LHCb-like environment. It is found that over- or underestimating these emissions can cause a bias on as high as 7%. However, this bias depends on individual analyses, and future high precision measurements require an accurate evaluation of these QED corrections.
1 Introduction
The Standard Model (SM) assumes lepton universality (LU) implying that once the mass difference is taken into account, all SM interactions treat the three charged leptons identically. The mass difference results in a different phase space between decays involving and the lighter and leptons111Throughout this paper, the inclusion of charge-conjugate processes is implied and natural units with are used.. LU can be tested by measuring the ratio of decay rates, ensuring that the Cabibbo-Kobayashi-Maskawa matrix elements, as well as most of the form factors, cancel in the ratio. This results in more accurate theoretical predictions and in the cancellation of many experimental systematic uncertainties. One type of these LU measurements is performed using semileptonic decays of the form , commonly known as measurements of , defined as
| (1) |
where and are a and hadron, respectively, and is either an electron or muon.
Several measurements of have been performed by the LHCb, Belle and BaBar experiments. For , on which this paper is focused, the predicted value Bigi:2016mdz ; Bernlochner:2017jka ; Jaiswal:2017rve ; Aoki:2019cca is
| (2) |
which assumes isospin symmetry. The average of the measured value of is Lees:2012xj ; Huschle:2015rga ; Abdesselam:2019dgh , where the first uncertainty is statistical and the second systematic. Even though differs from the SM prediction by only 1.4, it is remarkable that the deviation from the SM of the combined and observables is 3.1 HFLAV16 .
Radiative corrections were long thought to be negligible at the level of precision of measurements and predictions of . Recently, however, de Boer et al. deBoer:2018ipi presented a new evaluation of the long-distance electromagnetic (QED) contributions to and decays, where . They point out that these soft-photon corrections are different for and decays, such that they do not cancel in the ratios and . According to the authors of Ref. deBoer:2018ipi , the proper evaluation of the radiative corrections alters the SM predictions of the and values and increases their uncertainty. The current tension between the SM and measurements could be weakened or strengthened if radiative corrections are not properly taken into account.
All experiments measuring these types of LU are dependent on the simulation of QED radiative corrections in decays of particles and resonances. The widely used package to simulate these corrections is Photos Barberio:1993qi ; Golonka:2005pn , which is used by all three experiments measuring and .
This paper starts by comparing the radiative corrections on and from Ref. deBoer:2018ipi with those simulated by Photos in Sect. 2. The sensitivity of measurements of and to radiative corrections in the and decay modes is studied with pseudo-experiments in an LHCb-like environment, with different assumptions on the shape of the total energy of the radiated photons. The method and the results of this study are reported in Sect. 3. Conclusions and recommendations are summarised in Sect. 4.
2 Radiative corrections in PHOTOS
Photos Golonka:2005pn ; Golonka:1379813 is a universal Monte Carlo algorithm that simulates the effects of QED corrections in decays of particles and resonances. It exploits the factorisation property of QED coming from the exponentiation method used to improve the convergence of the perturbative expansion. Any particle-decay process accompanied by bremsstrahlung photons can be factorised into a tree term and bremsstrahlung factor. The latter depends only on the four-momenta of those particles taking part in the decay, and not on the underlying process. This approximation, which takes into account both real and virtual corrections, converges to an exact expression in the soft-photon region of phase space. It is worth noting that Photos does not incorporate the emission of photons depending on the hadronic structure. These so called structure-dependent (SD) photons impact the spin of the decay particle, and may also interfere with bremsstrahlung photons. The effect of SD photons depends on the specific decay under study and, as was the case for kaon decays Bijnens:1994me , may not be negligible.
The latest versions of Photos include multi-photon emissions, and interference between final-state photons. The validity of Photos has been tested successfully by comparing its results to full calculations available in various processes involving , and hadronic decays into scalar mesons Golonka:2005pn ; Nanava:2006vv . Because of the universal treatment of photon emission in Photos, its performances in specific processes should always be checked, especially when high precision is desired or when signal extraction is sensitive to detailed simulation of a phase space corner of the decay.
The calculation by de Boer et al. in Ref. deBoer:2018ipi is the first that studies the impact of soft-photon corrections on and . It is valid in the regime in which the maximum energy of the radiated photons is smaller than the lepton mass, which is the muon mass in this case. This calculation includes more effects than Photos does, in particular the interference between initial- and final-state photons, and the Coulomb correction. The latter increases the decay rate of decays with charged particles in the final state. It should be noted that the contribution of the Coulomb correction is singular for null relative velocity between final-state charged particles.
To compare QED corrections between Photos and Ref. deBoer:2018ipi , four samples ( and , where ) with three million -meson decays are generated by Pythia 8 Sjostrand:2006za ; Sjostrand:2007gs . The decays are simulated by EvtGen Lange:2001uf , and the radiative corrections by Photos v.3.56, with the “option with interference” switched on. QED corrections are applied by Photos by modifying the charged track’s four-momentum in the event record filled by EvtGen every time a photon is added.
The four-momentum of the total radiated photons, , is defined as
| (3) |
where , , , and are the four-momenta of the , , and particles, respectively, taken from the event record updated by Photos. This means that, in agreement with Ref. deBoer:2018ipi , the radiation of the decay products is not taken into account. The total energy of the radiated photons, , is computed in the rest frame. As in Ref. deBoer:2018ipi , the variable is defined as the maximum value that is allowed to have to consider as signal.
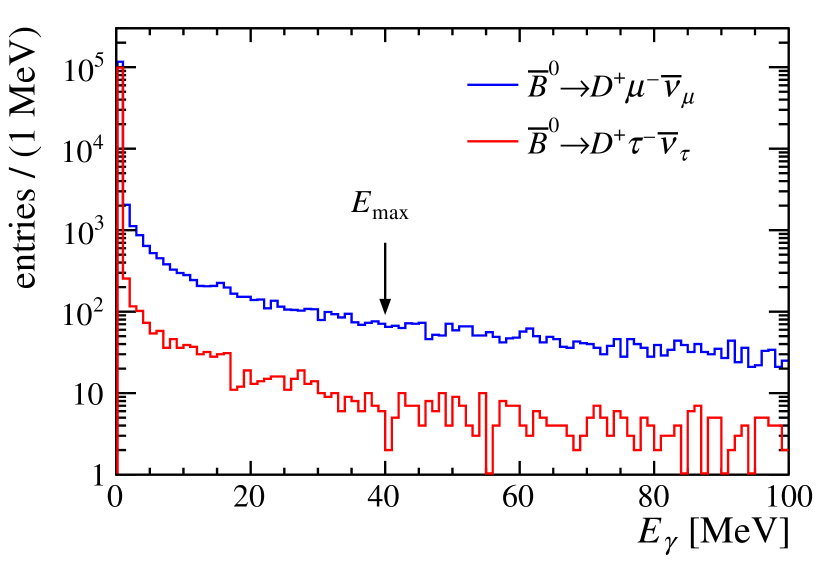
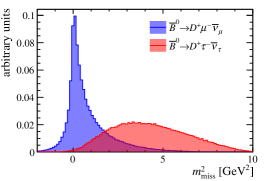
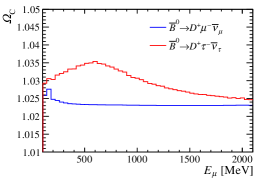
The QED correction, , is given by the relative variation of the branching ratio when events with total radiated energy greater than are discarded. This can be calculated as follows:
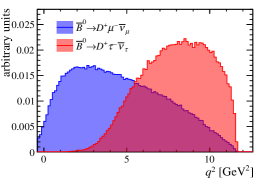
| (4) |
where is the distribution of events with . This distribution is shown for and decays in Fig. 1. The considered energy range is up to 100 MeV, which covers the majority of radiative photons, namely 98% of the decays and 99.7% for the decays generated by Photos.
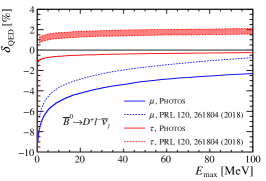
Comparisons between radiative corrections from Photos and Ref. deBoer:2018ipi are shown in Fig. 2 for the (left panel) and (middle panel) branching fractions. These plots show differences of up to 2% for decays, and for decays. Unfortunately, the effect does not cancel in the ratios of branching fractions. This is clearly visible from the right panel of Fig. 2 where radiative corrections on , , are shown as a function of . Photos predicts a QED correction that is 0.5% lower than the one in Ref. deBoer:2018ipi for , while it is 0.5% higher than the one in Ref. deBoer:2018ipi for .
2.1 Coulomb correction
A significant part of the radiative corrections in Ref. deBoer:2018ipi originates from Coulomb interactions, which are not included in Photos. Note that the Coulomb correction is relevant for the mode, but not for the mode. For a fermion-scalar (and fermion-fermion) pair, this correction is given by
| (5) |
where and is the relative velocity between the meson and the lepton, defined as
| (6) |
where . A well-known approximation of the Coulomb correction by Atwood and Marciano Atwood:1989em , yields which occurs when . This is accurate for decays with light leptons, but not for those with leptons. For the semitauonic mode, the typical relative velocity is 0.5-0.9, resulting in a Coulomb correction between 2.5 and 5.0%.
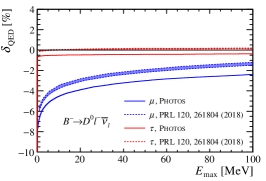
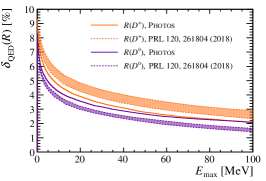
QED corrections from Photos for the mode are also compared with predictions not including the Coulomb correction from Ref. deBoer:2018ipi . This reduces the difference of the corrections to the branching ratios between Photos and the theoretical calculations to about 1% and brings the corrections on in close agreement, as shown in Fig. 3 (left and middle, respectively).
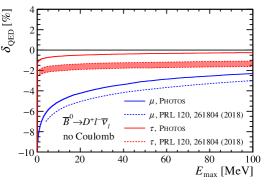
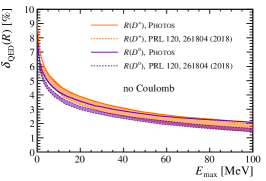
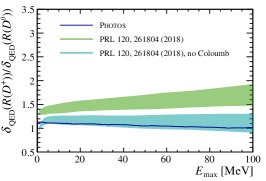
Fig. 3 (right) shows the ratio of QED corrections on over those on . It is worth noting that both Photos and the calculation in Ref. deBoer:2018ipi without Coulomb correction conserve isospin symmetry ( values for and agree within the errors), while the Coulomb correction introduces an isospin-breaking term.
3 Effects on LHCb-like analysis
The comparison in the previous section only holds for values of up to 100 MeV. For higher energies, no calculations relevant to are available222In Ref.Bernlochner:2010yd a calculation of the high-energy SD contribution to is reported. This is not relevant to this study because of the missing lepton-mass dependent effects.. Nevertheless, Photos generates photons with energies larger than those treated in Ref. deBoer:2018ipi , which is the range where the effect of SD photons might be relevant.
To study the effect of under- or overestimating radiative corrections in simulations used for measurements of , a simplified analysis is performed in an LHCb-like environment. Also here, the radiation emitted by the decay products of the mesons is neglected because their contributions largely cancel out in the ratio.
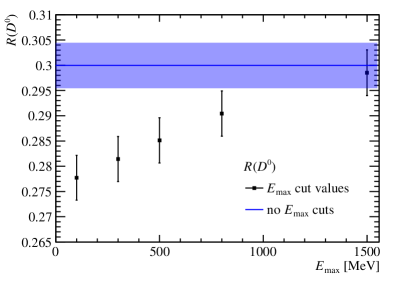
The strategy of this study consists of fitting a data sample with templates describing the and components. The fits are performed with templates built under the hypothesis that no radiation with above a certain value is emitted. In particular, five values were chosen to cut on : 100, 300, 500, 800 and 1500 MeV. The bias on , determined from these fits, is an indication of the importance of the simulation of the distribution in the high-energy region.
This analysis follows a strategy similar to the one used in Ref. Aaij:2015yra , where is measured using a three-dimensional templated fit. The data samples, referred to as pseudo-experiments in the following text, are generated from a mixture of and decays, with radiative corrections generated by Photos. Here is assumed to be 0.3 as predicted by the SM.
The variables used in the templated fit performed to extract the and yields from the pseudo-experiments are: the muon energy computed in the meson rest frame, ; the missing mass squared, ; and the squared four-momentum transferred to the lepton system, . The variables are binned as follows: four bins in in the range GeV, 40 bins in between GeV2, and 30 bins in muon energy in the range MeV, consistent with Ref. Aaij:2015yra . In this case study, only the signal () and normalisation () components are considered, while all backgrounds are ignored.
Basic selection requirements are applied to mimic the acceptance of the LHCb detector and its trigger following Ref. Ciezarek:2016lqu . Both production and -decay vertex positions are smeared to simulate the resolution of the LHCb detector. The resolution on the production vertices is 13 in and , and 70 in direction. For the -decay vertices a resolution of 20 in and , and 200 in direction is used, after which the direction is computed. The mesons decay as and , the lepton as . The muons and all decay products from the mesons are required to be in the pseudorapidity range between and . In addition, the momentum of each of these particles is required to be larger than GeV, and its component transverse to the beam direction must be larger than MeV. The distance between the production and -decay vertex should be at least 3 mm, similar to the requirements applied in a typical trigger selection.
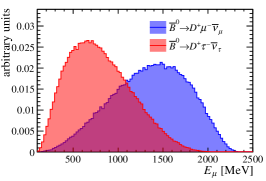
Due to the missing neutrino and unknown effective centre-of-mass energy of the collision, the -meson momentum cannot be reconstructed in an analysis at LHCb. Therefore the momentum of the meson in the direction, , is approximated as , where is the mass, and and are the momentum in the direction and the mass of the visible decay products of the meson, respectively. This directly follows the approach from Ref. Aaij:2015yra . After computing the momentum with the above approximation and applying the selection criteria described in this section, , and are calculated. The distributions for the signal and control samples are shown in Fig. 4. Even using this simplified detector description, these distributions show the same key features as those in Ref. Aaij:2015yra .
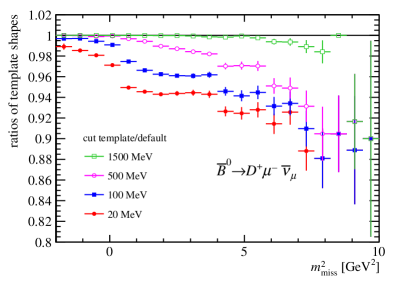
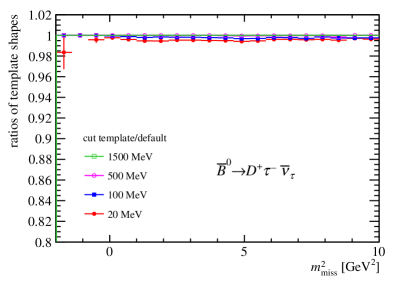
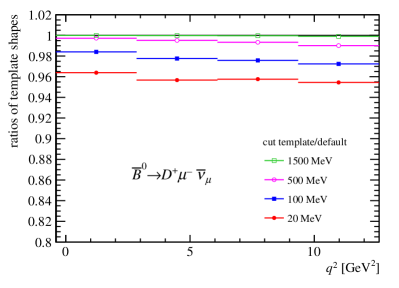
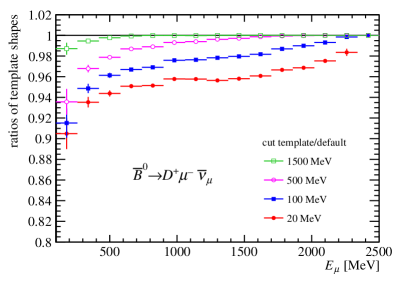
When applying cuts on , the templates shapes change. This is most clearly seen in the distributions of , shown for the decay in Fig. 5. Especially in the decay mode the effect is large, altering the shape at high values of . Since this feature is not present in the mode, this does not cancel when measuring the ratio . For completeness, changes in the shape of and for the mode are shown in A.
The number of events generated to simulate data is determined from the estimated number of events that LHCb gathered during their Run II data-taking period. The estimate takes into account the -production cross-section at 13 TeV, branching fractions, and assumes the average reconstruction efficiency is the same as in Ref. Aaij:2015yra . This results in data samples of and for the decays, and and for the decays, where the first yield represents the sample, and the second the sample. In an actual analysis, the efficiencies for decays are likely higher than those for decays, where is reconstructed in the decay mode.
The measured value of is determined from two components. The first is the ratio of reconstruction efficiencies and for the and samples, respectively, which takes into account the selection requirements described earlier in this section. The second component is the fraction of semitauonic decays in the sample, , determined from the three-dimensional template fit (the absence of background events in the simulated samples implies that the fraction of and components add up to one). These are combined to measure as
| (7) |
The exercise of generating pseudo-experiments is repeated 10.000 times after which the spread of the measured values of is taken as the statistical uncertainty.
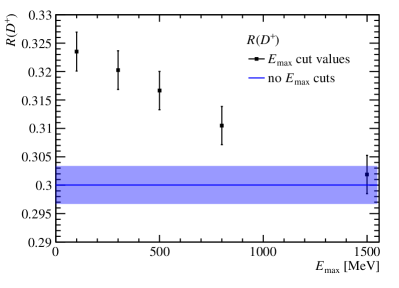
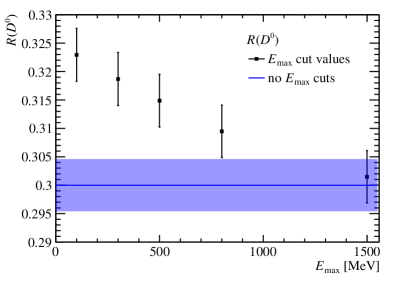
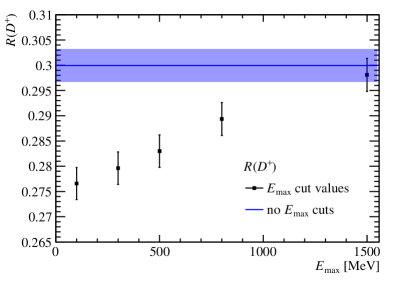
The resulting values of and as a function of are shown in Fig. 6. From here it is clear that there is a significant effect in underestimating the QED radiative corrections which could be up to 0.02 for both and values, corresponding to a relative bias of 7.5%. The largest contribution to the observed bias is due to the fit fraction , which is strongly affected by the shapes of the templates. Instead, the ratio of efficiencies is only marginally dependent on . However, this last statement holds only for this specific case study. Different sets of selection cuts or different experimental environments could indeed introduce a significant bias also in the ratio of efficiencies. The observed bias can be understood when looking at the distribution in Fig. 4 and Fig. 5. When cutting on , part of the tail of the distribution is removed, which is compensated by a higher fraction in the fit.
In an actual analysis there are radiative corrections in MC and radiated photons in data. Therefore, it is useful to check the above approach using an alternative strategy. In this case, the templates include all QED corrections predicted by Photos while an cut is applied on the pseudo-experiments. This approach leads to an overestimate on the QED corrections, resulting in a negative bias on the values. The results for and as a function of are reported in A. The corrections are of the exact same size as those in the baseline approach.
It is worth to note that, despite the fact that LHCb does not cut explicitly on in its analyses, indirect cuts on the total radiated energy are applied through e.g. requirements on isolation variables or inefficient reconstruction algorithms for low momentum particles. This could alter the observed bias if is not simulated correctly.
These studies show that radiative corrections play a crucial role in measurements. Since part of these corrections are already simulated in Photos, the above exercise shows the effect of a worst-case scenario. Nevertheless, additional effects such as the Coulomb correction, as detailed in next section, or the calculation for energies greater than 100 MeV are becoming fundamental in view of the increased experimental precision expected in the coming years. Also, these quantitative effects strongly depend on explicit or implicit cuts on radiative photons and must be carefully evaluated for each analysis measuring .
3.1 Coulomb correction
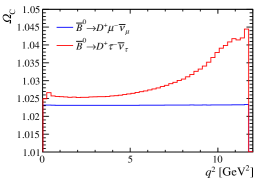
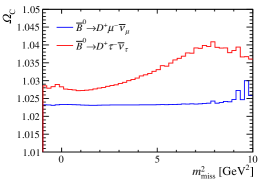
Beyond affecting the SM prediction of , the Coulomb correction impacts the experimental results by changing the shape of the fit templates. This is evaluated in the decay by weighting each event by the term .333The contribution due to the non-factorizable loop corrections to the tree-level differential decay rate, called in Ref.deBoer:2018ipi , is small and not implemented in Photos. For this reason, the Coulomb correction can be introduced in Photos as a global factor to the uncorrected differential decay rate. The changes in the shape of the , and distributions are shown in Fig. 7. While for the mode is mostly constant, for the mode there is a dependence on each of the three variables due to the smaller relative velocity. To quantify the effect of the Coulomb correction, the above analysis is repeated, without including any cuts. The Coulomb correction is applied to the pseudo-experiments, but not to the fit templates, resulting in a relative shift of about -1.0% on . This effect can even be amplified by selecting certain regions of phase space.
4 Conclusions and recommendations
The work in Ref. deBoer:2018ipi describes QED corrections which are not fully included in Photos. These corrections affect the semimuonic and semitauonic modes differently at the level of a few percent. Ignoring the Coulomb correction, there is more radiated energy in the calculation in Ref. deBoer:2018ipi than in Photos for the decays, while this is the other way around for the decays. In the ratio , this small discrepancy mostly cancels out. However, the main difference between the QED corrections on and , which is up to 1%, is due to the Coulomb correction that only affects .
Coulomb interactions are not simulated by Photos and mainly affect the kinematics of semitauonic decays, which in turn influence the shape of distributions used to determine the signal yields in LHCb, BaBar, and Belle analyses. These effects can alter values of up to 1% in an LHCb-like analysis, and should be evaluated precisely for each measurement.
Using a simplified LHCb-like analysis, it is shown that over- or underestimating radiative corrections could bias measurements of up to 7% in an extreme case. This results in a bias of 0.02 on the value of , and should be studied further when performing these types of measurements, including a realistic evaluation of cuts on . These effects could potentially be enhanced in measurements from Belle II Kou:2018nap where the resolution on the kinematic variables is better than at LHCb.
When measuring values of with higher precision, additional calculations of QED corrections for decays are necessary. Especially calculations involving high-energy and structure-dependent photons are currently mostly missing.
Acknowledgements.
We are grateful to S. de Boer, T. Kitahara, and I. Nisandzic for the fruitful collaboration, and to U. Egede for his thoughtful comments. In addition, we thank the Semileptonics decays working group of the LHCb collaboration, and in particular M. De Cian and L. Grillo, for their useful feedback throughout the development of this paper. Finally, we thank Z. Was for his helpful insights into the Photos package.Appendix A Additional Plots
The fits on the pseudo-experiments are performed on the three variables , and , as described in Sect. 3. The effect of cutting on on the shape of the and templates is shown in Fig. 8 for the decay. Analogous plots for the semitauonic mode show a negligible dependence on the cut.
The results of performing the simplified LHCb-like analysis with the alternative strategy are shown in Fig. 9. These results are obtained using templates with an distribution in agreement with Photos predictions, and pseudo-experiments with cuts on applied.
References
- (1) D. Bigi and P. Gambino, Revisiting , Phys. Rev. D94 (2016) 094008, arXiv:1606.08030
- (2) F. U. Bernlochner, Z. Ligeti, M. Papucci, and D. J. Robinson, Combined analysis of semileptonic decays to and : , , and new physics, Phys. Rev. D95 (2017) 115008, arXiv:1703.05330
- (3) S. Jaiswal, S. Nandi, and S. K. Patra, Extraction of from and the Standard Model predictions of , JHEP 12 (2017) 060, arXiv:1707.09977
- (4) Flavour Lattice Averaging Group, S. Aoki et al., FLAG Review 2019, arXiv:1902.08191
- (5) BaBar, J. P. Lees et al., Evidence for an excess of decays, Phys. Rev. Lett. 109 (2012) 101802, arXiv:1205.5442
- (6) Belle, M. Huschle et al., Measurement of the branching ratio of relative to decays with hadronic tagging at Belle, Phys. Rev. D92 (2015) 072014, arXiv:1507.03233
- (7) Belle, A. Abdesselam et al., Measurement of and with a semileptonic tagging method, arXiv:1904.08794
- (8) Heavy Flavor Averaging Group, Y. Amhis et al., Averages of -hadron, -hadron, and -lepton properties as of summer 2016, Eur. Phys. J. C77 (2017) 895, arXiv:1612.07233, updated results and plots available at https://hflav.web.cern.ch
- (9) S. de Boer, T. Kitahara, and I. Nisandzic, Soft-Photon Corrections to Relative to , Phys. Rev. Lett. 120 (2018) 261804, arXiv:1803.05881
- (10) E. Barberio and Z. Was, PHOTOS: A Universal Monte Carlo for QED radiative corrections. Version 2.0, Comput. Phys. Commun. 79 (1994) 291
- (11) P. Golonka and Z. Was, PHOTOS Monte Carlo: A precision tool for QED corrections in and decays, Eur. Phys. J. C45 (2006) 97, arXiv:hep-ph/0506026
- (12) P. Golonka, Computer simulations in high energy physics: a case for PHOTOS, MC-TESTER, TAUOLA and at2sim, PhD thesis, Cracow, INP, 2006, CERN-THESIS-2006-098
- (13) J. Bijnens, G. Colangelo, G. Ecker, and J. Gasser, Semileptonic kaon decays, in 2nd DAPHNE Physics Handbook:315-389, pp. 315–389, 1994. arXiv:hep-ph/9411311
- (14) G. Nanava and Z. Was, Scalar QED, NLO and PHOTOS Monte Carlo, Eur. Phys. J. C51 (2007) 569, arXiv:hep-ph/0607019
- (15) T. Sjöstrand, S. Mrenna, and P. Skands, PYTHIA 6.4 physics and manual, JHEP 05 (2006) 026, arXiv:hep-ph/0603175
- (16) T. Sjöstrand, S. Mrenna, and P. Skands, A brief introduction to PYTHIA 8.1, Comput. Phys. Commun. 178 (2008) 852, arXiv:0710.3820
- (17) D. J. Lange, The EvtGen particle decay simulation package, Nucl. Instrum. Meth. A462 (2001) 152
- (18) D. Atwood and W. J. Marciano, Radiative Corrections and Semileptonic Decays, Phys. Rev. D41 (1990) 1736
- (19) F. U. Bernlochner and H. Lacker, A phenomenological model for radiative corrections in exclusive semileptonic B-meson decays to (pseudo)scalar […], arXiv:1003.1620
- (20) LHCb, R. Aaij et al., Measurement of the ratio of branching fractions , Phys. Rev. Lett. 115 (2015) 111803, arXiv:1506.08614, [Erratum: Phys. Rev. Lett.115,no.15,159901(2015)]
- (21) G. Ciezarek, A. Lupato, M. Rotondo, and M. Vesterinen, Reconstruction of semileptonically decaying beauty hadrons produced in high energy pp collisions, JHEP 02 (2017) 021, arXiv:1611.08522
- (22) Belle-II, W. Altmannshofer et al., The Belle II Physics Book, arXiv:1808.10567