Mechanical heterogeneity in tissues promotes rigidity and controls cellular invasion
Abstract
We study the influence of cell-level mechanical heterogeneity in epithelial tissues using a vertex-based model. Heterogeneity in single cell stiffness is introduced as a quenched random variable in the preferred shape index() for each cell. We uncovered a crossover scaling for the tissue shear modulus, suggesting that tissue collective rigidity is controlled by a single parameter , which accounts for the fraction of rigid cells. Interestingly, the rigidity onset occurs at , far below the contact percolation threshold of rigid cells. Due to the separation of rigidity and contact percolations, heterogeneity can enhance tissue rigidity and gives rise to an intermediate solid state. The influence of heterogeneity on tumor invasion dynamics is also investigated. There is an overall impedance of invasion as the tissue becomes more rigid. Invasion can also occur in the intermediate heterogeneous solid state and is characterized by significant spatial-temporal intermittency.
Heterogeneity amongst cells in a tumor has been recognized as one of the hallmarks of cancerFidler (1978); Marusyk and Polyak (2010); Hanahan and Weinberg (2011); Gay et al. (2016). This so-called intra-tumor heterogeneity is thought to facilitate metastasisFidler (1978); Brock et al. (2009); Shin et al. (2014) by allowing a cellular community the flexibility and efficiency to adapt to new environmentsAckermann (2015). It is also largely responsible for therapeutic resistance, leading to the failure to predict the progression patterns of metastasisFidler (1978); Marusyk and Polyak (2010); Bhatia et al. (2012); Claudi et al. (2014). Cellular differences within a tumor result from an interplay of both genetic and extrinsic influencesZhang and Austin (2012); Anderson et al. (2010); Snuderl et al. (2011); Notta et al. (2011); Marusyk et al. (2012). Whereas fitness or genotypic heterogeneity has been studied extensively, the role of mechanical heterogeneity in a tumor or cellular collective is still not well understood.
Recent experimental evidenceTian et al. (2015); Yallapu et al. (2015); Fritsch et al. (2010); Morawetz et al. (2017) have revealed that tumor cells exhibit a broad distribution of various biomechanical properties. These include intra-tumor heterogeneity in cell stiffnessesPlodinec et al. (2012); Fujii et al. (2019); Guo et al. (2014); Fritsch et al. (2010); Ciasca et al. (2016), stresses, and cell-cell interactionsGuo et al. (2014); Lee et al. (2012). However, there is no consensus on how these heterogeneities affect the mechanical behavior at the tissue level. For example, while biophysical techniquesAlibert et al. (2017) such as AFMCiasca et al. (2016) and optical stretcherMorawetz et al. (2017) show that individual cancer cells are softer than healthy cells, there is an apparent paradox with measurements at the tissue level, which show that tumors are more rigid than healthy tissuesButcher et al. (2009); Sinkus et al. (2000).
Similarly, from a theoretical and modeling perspective, there is a lack of understanding of how heterogeneity exhibited by single cells influence the mechanical state of the tissue. One large class of vertex-based computational modelsNagai and Honda (2001); Farhadifar et al. (2007); Fletcher et al. (2014) has been used to study mechanics of homogeneous epithelial tissues which can exhibit a solid to fluid transitionStaple et al. (2010); Bi et al. (2015); Kim and Hilgenfeldt (2015). However, previous works often treat heterogeneity as a biological noise and therefore unable to model many of the salient features in tumors.
In this work, we explicitly study the effect of heterogeneity on the mechanics of the confluent cell monolayer using the vertex model . Our results show that heterogeneity always acts to enhance the rigidity of a tissue. The mode of enhancement by heterogeneity depends on the spatial distribution of rigid vs. soft cells, which is directly tuned by a single universal parameter . This results in distinct mechanical regimes that arise from the mismatch of two percolation processes: (1) rigidity percolation of mechanical tensions in a tissue and (2) contact percolation of rigid cells. We also connect tissue rigidity to cellular migration using model for the invasion of a single metastatic cell in a heterotypic microenvironment of the tissue.
Model We focus on the mechanics of a 2D confluent epithelium. Similar to previous vertex model implementations, the tissue is governed by the energy functionNagai and Honda (2001); Farhadifar et al. (2007); Staple et al. (2010); Li and Sun (2015); Fletcher et al. (2014); Kim and Hilgenfeldt (2015) , where cell areas and perimeters are functions of the position of vertices . , are the area and perimeter elasticities. The term quadratic in cell area results from resistance to volume changesFarhadifar et al. (2007); Staple et al. (2010); Fletcher et al. (2014). Changes to cell perimeters are directly related to the deformation of the acto-myosin cortexHufnagel et al. (2007); Zehnder et al. (2015). The term corresponds to the energy cost of deforming the cortex. The linear term, , represents the effective line tension by cell- which gives rise to a ‘preferred perimeter’ . The value of can be modified by an interplay of cell-cell adhesion and cortical tensionFarhadifar et al. (2007); Staple et al. (2010); Bi et al. (2015). Here we assume the individual preferred cell area does not vary from cell-to-cell and is set to the average area per cell (i.e. ). The tissue energy can be non-dimensionalized by choosing as the energy unit and as the length unit
| (1) |
where and are the rescaled area and perimeter of the cell. and is the preferred cell shape indexBi et al. (2015).
In this model, the cell stiffness is determined by the tension on cell-cell junctions (edges)Hutson et al. (2003); Rauzi et al. (2008); Brodland et al. (2010); Chiou et al. (2012); Ishihara and Sugimura (2012); Ishihara et al. (2013); Brodland et al. (2014), which in turn is directly tuned by the preferred cell shape index Yan and Bi (2019); Yang et al. (2017),
| (2) |
where and are the actual perimeters of cells adjacent to the edge . To capture the experimentally observed variations in single cell stiffnesses and in cell-cell interactionsPlodinec et al. (2012); Fujii et al. (2019); Guo et al. (2014); Fritsch et al. (2010); Ciasca et al. (2016), we introduce variations in the preferred shape indices . The majority of this work uses a Gaussian distributed set of ’s with mean and standard deviation . We also performed analysis using uniform distributions with the same ()(SI Section I).
To initialize the simulation, Voronoi cellsBi et al. (2016) are used to provide a set of initial vertex positions, . Then each cell is assigned a value of drawn randomly from a Gaussian distribution with mean and standard deviation . The set of then remains as quenched variables throughout the simulation. A combination of FIREBitzek et al. (2006) and conjugate-gradientByrd et al. (1995) algorithms is used to minimize Eq. (1). The network topology is updated using T1-movesWeaire and Hutzler (2001); Bi et al. (2014, 2015) during minimization. This combined algorithm produces final stable states where the net residual force on vertices is less than . A wide range of parameters , and as well a range of system sizes are simulated.
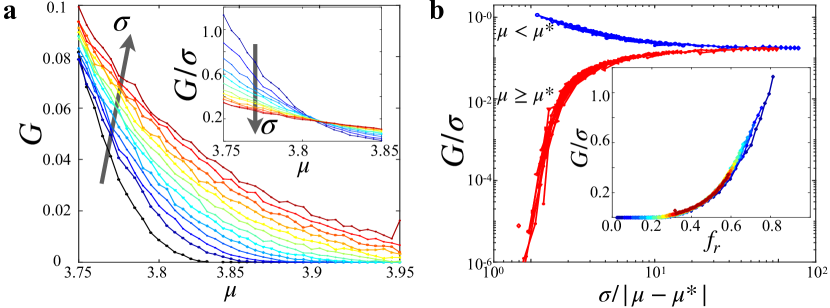
Cellular heterogeneity enhances rigidity- We first focus on the case where area and perimeter elasticities are matched in their strengths (). In Fig. 1(a), the shear modulus is plotted as function of and . At , vanishes at . This recapitulates the rigidity transition in the absence of heterogeneity Farhadifar et al. (2007); Bi et al. (2015); Yan and Bi (2019). Increasing at fixed always enhances the rigidity, which can occur in two different ways: (i) for a rigid tissue when , always increases with , and (ii) for a fluid tissue, when but becomes rigid when . The threshold where rigidity emerges depends on . To better understand the dependence of on , we first hypothesized that provides an overall scale for the shear modulus and plot a rescaled as function of for various (Fig. 1(a, inset)). This yields an intriguing result, where all curves in Fig. 1(a, inset) intersect at a common point . The point serves as a cross-over point between two distinct regimes. When , decreases as is increased. For the behavior is flipped and increases with . The intersection of all curves also suggests that closer to , the shear modulus should converge to a scaling of . Based on these observations, we hypothesized that the behavior of below and above may be described by a universal scaling relation
| (3) |
We re-plot all data based on the ansatz (Eq. 3) in Fig. 1(b). An excellent scaling collapse is obtained, which also allowed us to pinpoint the location of the crossover transition . The two distinct branches (, ) of the scaling function correspond to and , respectively. The two branches meet at , where scales linearly with .
What does this universal scaling in the vicinity of a cross-over transition point inform us about the nature of rigidity? At the crossover , there are of cells with regardless of the value of . Below the crossover (), cells with exceed , while above the crossover () this fraction is below . This suggests that the fraction of cells with plays an important role. Therefore we define this fraction cells as
| (4) |
where is the probability distribution function and for a Gaussian, . In Fig. 1(b-inset), a re-plot all data in terms of vs. collapses to a common curve. Interestingly, the numerical value was previously found to be the threshold for rigidity in tissuesBi et al. (2015) with homogeneous . This universal scaling behavior supports the idea that can serve as a single-cell criterion for rigidity and their fraction determines tissue mechanics. We therefore refer to as the fraction of rigid cells.
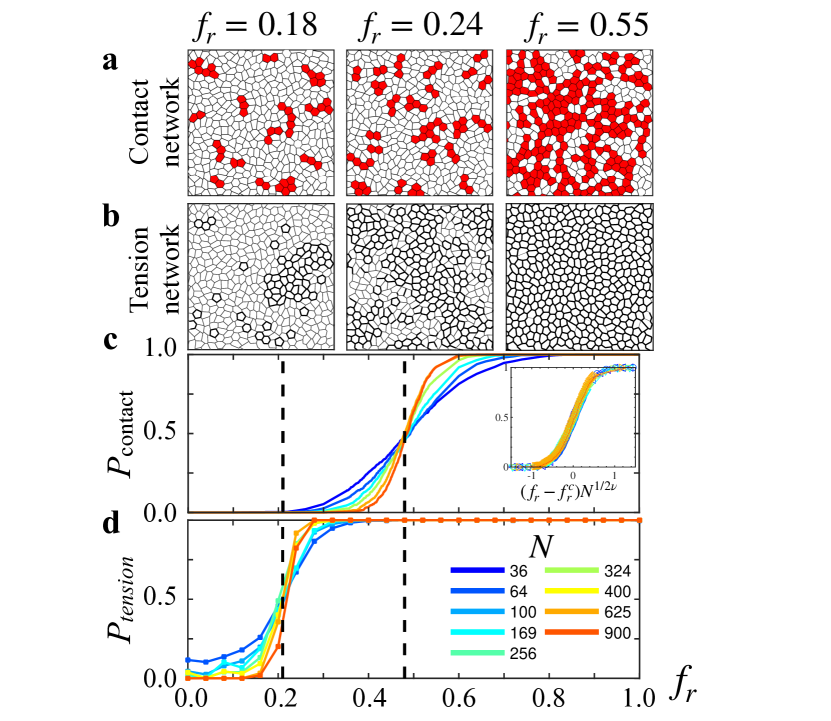
Heterogeneity drives two different percolations- The emergence of rigidity when a certain population of cells exceeds a fraction is reminiscent of a percolation processFeng and Sen (1984); Jacobs and Thorpe (1995, 1996); Tang and Thorpe (1988); Ostojic et al. (2006). To test if drives a percolation transition, we first analyze the spatial organization of rigid cells. Snapshots of connected rigid cells are shown in Fig. 2(a) and the probability for rigid cells to form a system-spanning contact network is plotted in Fig. 2(c). Finite-size scaling (Fig. 2(c, inset)) shows a contact percolation transition at with exponent . However, according to Fig. 1(b,inset) and Fig. 3(b), the tissue becomes rigid at a much lower , suggesting that contact percolation of rigid cells is not necessary for rigidity. We then hypothesized that the percolation of the tension network is the necessary condition for rigidity rather than rigid cell contacts. Fig. 2(d) shows tension percolation occurring at , coinciding with the rigidity onset. Snapshots of tensions (Fig. 2(b)) highlight an interesting behavior: e.g. at , the rigid-cell contact network does not span the system, but the tensions form a system-spanning structure. Therefore the presence of just a few unconnected rigid cells can induce a much more spatially extended tension network. The distribution of also evolves as function of in an unconventional way (Fig. 3(a)). For values of corresponding to rigid states, vanishes as and appears symmetrical about their mean. At lower , becomes significantly more skewed and heavy-tailed (SI FIG.S2) and also develops an excess number of edges. Interestingly, the average tension for the tissue does not vanish (Fig. 3(b)) even below , and does not show drastic changes at . In contrast, undergoes a transition , coinciding with the tension network percolation. Remarkably, two states with slight differences in their tensions can differ by several orders of magnitudes in (Fig.S3), depending on whether the tension network is percolated.
Next we use a simple meanfield approach to estimate the rigidity transition threshold . Since our simulated tissues share a similar connectivity and topology with random Voronoi tessellations, we recall the bond percolation threshold () on such networksShante and Kirkpatrick (1971); Hsu and Huang (1999); Becker and Ziff (2009). Therefore if rigidity requires the percolation of edges with finite tensions, the onset of rigidity should correspond to when there are exactly cell edges with finite tensions. For each parameter set we define the fraction of finite tensions to be , where the threshold is chosen to define “zero” tensions (coinciding with the noise floor in the numerical calculations). In Fig. 3(c) we show that the point at which closely coincides with the rigidity transition, i.e. . Taken together, these results suggest that a rigidity percolation occurs at .
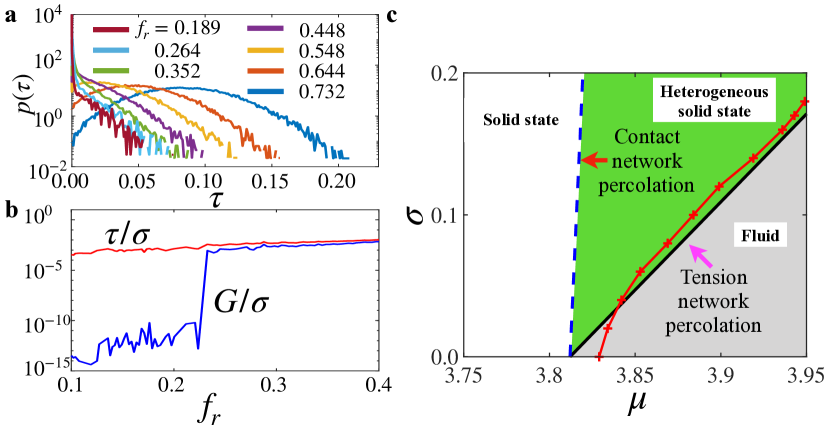
The mechanics of the tissue is summarized in a phase diagram (Fig. 3(c)). Solid and fluid-like states are separated by which corresponds to a rigidity percolation of the edge tensions in the network. Contact percolation of rigid cells occur deeper within the solid phase at . The mismatch between contact and rigidity percolations can be observed only in the presence of heterogeneity since at , is either or . We call the intermediate region between the two percolation transitions the Heterogeneous solid state. Rigidity transition obtained through the meanfield method is shown as the red line in Fig. 3(c).
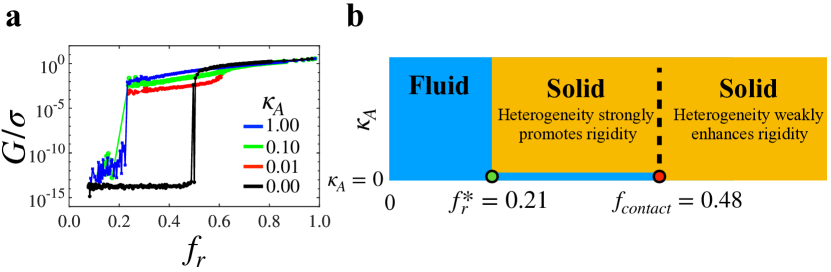
Cell area elasticity weakens the effect of heterogeneity- Next we focus on the Heterogeneous solid state (. The regime is characterized by spatial heterogeneity (Fig. 2(b)) where isolated cells or isolated clusters exist along side tissue-spanning percolated networks. Mechanical force balance must hold at every vertexYan and Bi (2019) for a solid tissue. However, for an isolated tension cluster, edge tensions alone cannot guarantee force balance, such as a vertex that sits on the boundary of this cluster. The missing component required for full force balance is the intracellular pressure force that acts perpendicularly on an edge given byYang et al. (2017); Yan and Bi (2019) Here and are the areas of cell and adjacent to the edge . Interestingly, since the pressure depends on the value of the cell area elasticity , the stability of isolated tension clusters must also depend on . To see the effect of cell area elasticity, we repeated the numerical calculations at various values. The dependence of on is plotted for various in Fig. 4(a). At , suffers a slight dip at , but stays finite all the way until below . In general, as long as is finite, the rigidity transition always occurs at and does not shift. The case of is a singular limit where the rigidity transition shifts suddenly to to coincide with the contact percolation transition. This confirms our hypothesis that when cells cannot exert pressure forces, the tension network can only support mechanical rigidity when rigid cells physically come in contact. In contrast, at , stable tensions can be induced between rigid cells that are separated by a distance. We summarize these results with in Fig. 4(b) and also incorporate the different scaling regimes for the solid phase when . We are able to differentiate two types of solids: (i)when , rigidity is strongly enhanced by heterogeneity (lower-branch in Fig. 1(b)) and (ii) when , there is only weak enhancement of rigidity (upper-branch in Fig. 1(b)). When , heterogeneity has no effect.
Heterogeneity and cellular invasion - Having established the static mechanical properties, we next focus on the effect of the heterotypic microenvironment on cell migration. We use a dynamic vertex modelStaddon et al. (2018); Das et al. (2019) to simulate the motion of a single invading cell in the tissue. The invading cell has a propulsive force along a polarity vector , which undergoes random rotational diffusionFily and Marchetti (2012); Bi et al. (2016) at a slow rate. This mimics the directional motility of a metastatic cell under the influence of strong chemotactic signalsClark and Vignjevic (2015). In the tissue each vertex evolves according to the overdamped equation of motion
| (5) |
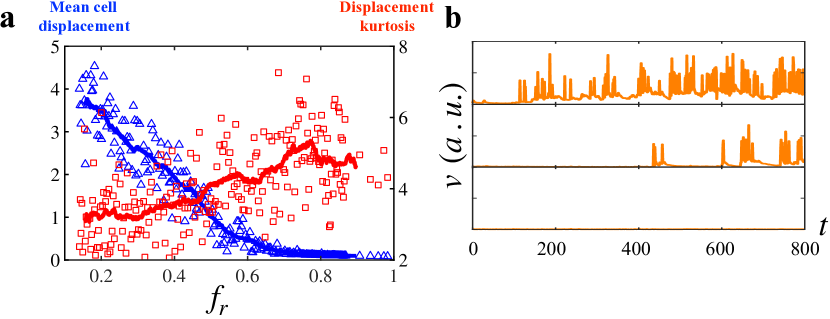
Eq. 5 is simulated with a fixed value and at various values of . The mean total displacement of the invading cell is plotted as function of in Fig. 5a, the behavior near and recapitulate results in the absence of heterogeneity Bi et al. (2016), where a cell is either moving () or stuck (). However with heterogeneity tissues in the range of become accessible and cells moving through must interact with rigid as well as non-rigid neighbor cells along its path of invasion. This results in a highly intermittent migration dynamics for the invading cell. To quantify intermittency, we plot the kurtosis in the displacement of the invading cellDas et al. (2016) as function of . The displacement of the invading cells also show a burst-like dynamics when the tissue is in the heterogeneous solid state (Fig. 5(b) and SI Video 1 https://youtu.be/GTIcr0Wc-NQ).
Discussion -
In cancer research it has long been recognized that tumors are stiffer than the surrounding tissue. Yet tumors often contain softer cells and softer cells facilitate invasionOswald et al. (2017). This causes an apparent paradox: how can soft cells give rise to a tumor that is rigid at the tissue level? Our work suggests that tissue mechanics is not just determined by the average softness of the cells, but on the statistical fluctuations in single cell properties. The heterogeneity-driven rigidification can provide a possible resolution of this paradox. As a simple example, we note that in the phase diagram (Fig. 3(c)), it is possible to transform from a fluid to a solid state by increasing (i.e. cells become softer overall) but at the same time increasing . Furthermore, our predictions show that the tissue mechanics is controlled by a single fraction . This is consistent with recent experimental findingGamboa Castro et al. (2016) that the fraction of mesenchymal cells can serve as a control parameter in describing jamming properties and that increasing mesenchymal fraction leads to the increase in motility. Finally, there is also experimental evidence that heterogeneity can drive more intermittent dynamics in cell migrationLee et al. (2012). The burst-like intermittency in the heterogeneous solid state is highly reminiscent of the pulsating cancer cell migration recently observed in epithelial monolayersLee et al. (2012).
Acknowledgements.
We thank J. M. Schwarz, Xingbo Yang, Josef A Käs for insightful discussions. The authors acknowledge the support of the Northeastern University Discovery Cluster.References
- Fidler (1978) Isaiah J. Fidler, “Tumor heterogeneity and the biology of cancer invasion and metastasis,” Cancer Research 38, 2651–2660 (1978).
- Marusyk and Polyak (2010) Andriy Marusyk and Kornelia Polyak, “Tumor heterogeneity: causes and consequences,” Biochim Biophys Acta 1805, 105 (2010).
- Hanahan and Weinberg (2011) Douglas Hanahan and Robert A. Weinberg, “Hallmarks of cancer: The next generation,” Cell 144, 646 – 674 (2011).
- Gay et al. (2016) L Gay, AM Baker, and TA Graham, “Tumour cell heterogeneity,” F1000Research 5 (2016).
- Brock et al. (2009) Amy Brock, Hannah Chang, and Sui Huang, “Non-genetic heterogeneity – a mutation-independent driving force for the somatic evolution of tumours,” Nature Reviews Genetics 10, 336 EP – (2009), perspective.
- Shin et al. (2014) Yoojin Shin, Sewoon Han, Euiheon Chung, and Seok Chung, “Intratumoral phenotypic heterogeneity as an encourager of cancer invasion,” Integr. Biol. 6, 654–661 (2014).
- Ackermann (2015) Martin Ackermann, “A functional perspective on phenotypic heterogeneity in microorganisms,” Nature Reviews Microbiology 13, 497 EP – (2015), review Article.
- Bhatia et al. (2012) Sangeeta Bhatia, John V. Frangioni, Robert M. Hoffman, A. John Iafrate, and Kornelia Polyak, “The challenges posed by cancer heterogeneity,” Nature Biotechnology 30, 604 EP – (2012).
- Claudi et al. (2014) Beatrice Claudi, Petra Spröte, Anna Chirkova, Nicolas Personnic, Janine Zankl, Nura Schurmann, Alexander Schmidt, and Dirk Bumann, “Phenotypic variation of salmonella in host tissues delays eradication by antimicrobial chemotherapy,” Cell 158, 722 – 733 (2014).
- Zhang and Austin (2012) Qiucen Zhang and Robert H. Austin, “Physics of cancer: The impact of heterogeneity,” Annual Review of Condensed Matter Physics 5, 363–382 (2012).
- Anderson et al. (2010) Kristina Anderson, Christoph Lutz, Frederik W. van Delft, Caroline M. Bateman, Yanping Guo, Susan M. Colman, Helena Kempski, Anthony V. Moorman, Ian Titley, John Swansbury, Lyndal Kearney, Tariq Enver, and Mel Greaves, “Genetic variegation of clonal architecture and propagating cells in leukaemia,” Nature 469, 356 EP – (2010), article.
- Snuderl et al. (2011) Matija Snuderl, Ladan Fazlollahi, Long P. Le, Mai Nitta, Boryana H. Zhelyazkova, Christian J. Davidson, Sara Akhavanfard, Daniel P. Cahill, Kenneth D. Aldape, Rebecca A. Betensky, David N. Louis, and A. John Iafrate, “Mosaic amplification of multiple receptor tyrosine kinase genes in glioblastoma,” Cancer Cell 20, 810 – 817 (2011).
- Notta et al. (2011) Faiyaz Notta, Charles G. Mullighan, Jean C. Y. Wang, Armando Poeppl, Sergei Doulatov, Letha A. Phillips, Jing Ma, Mark D. Minden, James R. Downing, and John E. Dick, “Evolution of human bcr-abl1 lymphoblastic leukaemia-initiating cells,” Nature 469, 362 EP – (2011), article.
- Marusyk et al. (2012) Andriy Marusyk, Vanessa Almendro, and Kornelia Polyak, “Intra-tumour heterogeneity: a looking glass for cancer?” Nature Reviews Cancer 12, 323 EP – (2012), review Article.
- Tian et al. (2015) Mengxin Tian, Yiran Li, Weiren Liu, Lei Jin, Xifei Jiang, Xinyan Wang, Zhenbin Ding, Yuanfei Peng, Jian Zhou, Jia Fan, Yi Cao, Wei Wang, and Yinghong Shi, “The nanomechanical signature of liver cancer tissues and its molecular origin,” Nanoscale 7, 12998–13010 (2015).
- Yallapu et al. (2015) Murali M. Yallapu, Kalpana S. Katti, Dinesh R. Katti, Sanjay R. Mishra, Sheema Khan, Meena Jaggi, and Subhash C. Chauhan, “The roles of cellular nanomechanics in cancer,” Medicinal Research Reviews 35, 198–223 (2015).
- Fritsch et al. (2010) Anatol Fritsch, Michael Höckel, Tobias Kiessling, Kenechukwu David Nnetu, Franziska Wetzel, Mareike Zink, and Josef A. Käs, “Are biomechanical changes necessary for tumour progression?” Nature Physics 6, 730 EP – (2010).
- Morawetz et al. (2017) Erik W Morawetz, Roland Stange, Tobias R Kießling, Jörg Schnauß, and Josef A Käs, “Optical stretching in continuous flows,” Convergent Science Physical Oncology 3, 024004 (2017).
- Plodinec et al. (2012) Marija Plodinec, Marko Loparic, Christophe A. Monnier, Ellen C. Obermann, Rosanna Zanetti-Dallenbach, Philipp Oertle, Janne T. Hyotyla, Ueli Aebi, Mohamed Bentires-Alj, Roderick Y. H. Lim, and Cora-Ann Schoenenberger, “The nanomechanical signature of breast cancer,” Nature Nanotechnology 7, 757 EP – (2012), article.
- Fujii et al. (2019) Yuki Fujii, Yuki Ochi, Masahiro Tuchiya, Mihoko Kajita, Yasuyuki Fujita, Yukitaka Ishimoto, and Takaharu Okajima, “Spontaneous spatial correlation of elastic modulus in jammed epithelial monolayers observed by afm,” Biophysical Journal (2019).
- Guo et al. (2014) Xinyi Guo, Keith Bonin, Karin Scarpinato, and Martin Guthold, “The effect of neighboring cells on the stiffness of cancerous and non-cancerous human mammary epithelial cells,” New Journal of Physics 16, 105002 (2014).
- Ciasca et al. (2016) Gabriele Ciasca, Tanya Enny Sassun, Eleonora Minelli, Manila Antonelli, Massimiliano Papi, Antonio Santoro, Felice Giangaspero, Roberto Delfini, and Marco De Spirito, “Nano-mechanical signature of brain tumours,” Nanoscale 8, 19629–19643 (2016).
- Lee et al. (2012) Meng-Horng Lee, Pei-Hsun Wu, Jack Rory Staunton, Robert Ros, Gregory D. Longmore, and Denis Wirtz, “Mismatch in mechanical and adhesive properties induces pulsating cancer cell migration in epithelial monolayer,” Biophysical Journal, Biophysical Journal 102, 2731–2741 (2012).
- Alibert et al. (2017) Charlotte Alibert, Bruno Goud, and Jean-Baptiste Manneville, “Are cancer cells really softer than normal cells?” Biology of the Cell 109, 167–189 (2017).
- Butcher et al. (2009) Darci T. Butcher, Tamara Alliston, and Valerie M. Weaver, “A tense situation: forcing tumour progression,” Nature Reviews Cancer 9, 108 EP – (2009).
- Sinkus et al. (2000) R Sinkus, J Lorenzen, D Schrader, M Lorenzen, M Dargatz, and D Holz, “High-resolution tensor MR elastography for breast tumour detection,” Physics in Medicine and Biology 45, 1649–1664 (2000).
- Nagai and Honda (2001) Tatsuzo Nagai and Hisao Honda, “A dynamic cell model for the formation of epithelial tissues,” Philosophical Magazine B 81, 699–719 (2001).
- Farhadifar et al. (2007) Reza Farhadifar, Jens-Christian Röper, Benoit Aigouy, Suzanne Eaton, and Frank Jülicher, “The influence of cell mechanics, cell-cell interactions, and proliferation on epithelial packing,” Current Biology 17, 2095 – 2104 (2007).
- Fletcher et al. (2014) Alexander G. Fletcher, Miriam Osterfield, Ruth E. Baker, and Stanislav Y. Shvartsman, “Vertex models of epithelial morphogenesis,” Biophysical Journal 106, 2291 – 2304 (2014).
- Staple et al. (2010) D. B. Staple, R. Farhadifar, J. C. Röper, B. Aigouy, S. Eaton, and F. Jülicher, “Mechanics and remodelling of cell packings in epithelia,” The European Physical Journal E 33, 117–127 (2010).
- Bi et al. (2015) Dapeng Bi, J. H. Lopez, J. M. Schwarz, and M. Lisa Manning, “A density-independent rigidity transition in biological tissues,” Nature Physics 11, 1074–1079 (2015), 1409.0593 .
- Kim and Hilgenfeldt (2015) Sangwoo Kim and Sascha Hilgenfeldt, “Cell shapes and patterns as quantitative indicators of tissue stress in the plant epidermis,” Soft Matter 11, 7270–7275 (2015).
- Li and Sun (2015) Bo Li and Sean X. Sun, “Coherent motions in confluent cell monolayer sheets,” Biophysical Journal, Biophysical Journal 107, 1532–1541 (2015).
- Hufnagel et al. (2007) Lars Hufnagel, Aurelio A. Teleman, Hervé Rouault, Stephen M. Cohen, and Boris I. Shraiman, “On the mechanism of wing size determination in fly development,” Proceedings of the National Academy of Sciences 104, 3835–3840 (2007).
- Zehnder et al. (2015) Steven M. Zehnder, Melanie Suaris, Madisonclaire M. Bellaire, and Thomas E. Angelini, “Cell volume fluctuations in mdck monolayers,” Biophysical Journal 108, 247 – 250 (2015).
- Hutson et al. (2003) M. Shane Hutson, Yoichiro Tokutake, Ming-Shien Chang, James W. Bloor, Stephanos Venakides, Daniel P. Kiehart, and Glenn S. Edwards, “Forces for morphogenesis investigated with laser microsurgery and quantitative modeling,” Science 300, 145–149 (2003).
- Rauzi et al. (2008) Matteo Rauzi, Pascale Verant, Thomas Lecuit, and Pierre-François Lenne, “Nature and anisotropy of cortical forces orienting drosophila tissue morphogenesis,” Nature Cell Biology 10, 1401 EP – (2008).
- Brodland et al. (2010) G. Wayne Brodland, Vito Conte, P. Graham Cranston, Jim Veldhuis, Sriram Narasimhan, M. Shane Hutson, Antonio Jacinto, Florian Ulrich, Buzz Baum, and Mark Miodownik, “Video force microscopy reveals the mechanics of ventral furrow invagination in drosophila,” Proceedings of the National Academy of Sciences 107, 22111–22116 (2010).
- Chiou et al. (2012) Kevin K. Chiou, Lars Hufnagel, and Boris I. Shraiman, “Mechanical stress inference for two dimensional cell arrays,” PLOS Computational Biology 8, 1–9 (2012).
- Ishihara and Sugimura (2012) Shuji Ishihara and Kaoru Sugimura, “Bayesian inference of force dynamics during morphogenesis,” Journal of Theoretical Biology 313, 201 – 211 (2012).
- Ishihara et al. (2013) S. Ishihara, K. Sugimura, S. J. Cox, I. Bonnet, Y. Bellaïche, and F. Graner, “Comparative study of non-invasive force and stress inference methods in tissue,” The European Physical Journal E 36, 45 (2013).
- Brodland et al. (2014) G. Wayne Brodland, Jim H. Veldhuis, Steven Kim, Matthew Perrone, David Mashburn, and M. Shane Hutson, “Cellfit: A cellular force-inference toolkit using curvilinear cell boundaries,” PLOS ONE 9, 1–15 (2014).
- Yan and Bi (2019) Le Yan and Dapeng Bi, “Multicellular rosettes drive fluid-solid transition in epithelial tissues,” Phys. Rev. X 9, 011029 (2019).
- Yang et al. (2017) Xingbo Yang, Dapeng Bi, Michael Czajkowski, Matthias Merkel, M. Lisa Manning, and M. Cristina Marchetti, “Correlating cell shape and cellular stress in motile confluent tissues,” Proceedings of the National Academy of Sciences (2017).
- Bi et al. (2016) Dapeng Bi, Xingbo Yang, M. Cristina Marchetti, and M. Lisa Manning, “Motility-driven glass and jamming transitions in biological tissues,” Phys. Rev. X 6, 021011 (2016).
- Bitzek et al. (2006) Erik Bitzek, Pekka Koskinen, Franz Gähler, Michael Moseler, and Peter Gumbsch, “Structural relaxation made simple,” Phys. Rev. Lett. 97, 170201 (2006).
- Byrd et al. (1995) Richard H. Byrd, Peihuang Lu, Jorge Nocedal, and Ciyou Zhu, “A limited memory algorithm for bound constrained optimization,” SIAM Journal of Scientific Computing 16, 1190–1208 (1995).
- Weaire and Hutzler (2001) D.L. Weaire and S. Hutzler, The Physics of Foams (Clarendon Press, 2001).
- Bi et al. (2014) Dapeng Bi, Jorge H. Lopez, J. M. Schwarz, and M. Lisa Manning, “Energy barriers and cell migration in densely packed tissues,” Soft Matter 10, 1885–1890 (2014).
- Feng and Sen (1984) Shechao Feng and Pabitra N. Sen, “Percolation on elastic networks: New exponent and threshold,” Phys. Rev. Lett. 52, 216–219 (1984).
- Jacobs and Thorpe (1995) D. J. Jacobs and M. F. Thorpe, “Generic rigidity percolation: The pebble game,” Phys. Rev. Lett. 75, 4051–4054 (1995).
- Jacobs and Thorpe (1996) D. J. Jacobs and M. F. Thorpe, “Generic rigidity percolation in two dimensions,” Phys. Rev. E 53, 3682–3693 (1996).
- Tang and Thorpe (1988) W. Tang and M. F. Thorpe, “Percolation of elastic networks under tension,” Phys. Rev. B 37, 5539–5551 (1988).
- Ostojic et al. (2006) Srdjan Ostojic, Ellák Somfai, and Bernard Nienhuis, “Scale invariance and universality of force networks in static granular matter,” Nature 439, 828 EP – (2006).
- Shante and Kirkpatrick (1971) Vinod K.S. Shante and Scott Kirkpatrick, “An introduction to percolation theory,” Advances in Physics 20, 325–357 (1971).
- Hsu and Huang (1999) H.-P. Hsu and M.-C. Huang, “Percolation thresholds, critical exponents, and scaling functions on planar random lattices and their duals,” Phys. Rev. E 60, 6361–6370 (1999).
- Becker and Ziff (2009) Adam M. Becker and Robert M. Ziff, “Percolation thresholds on two-dimensional voronoi networks and delaunay triangulations,” Phys. Rev. E 80, 041101 (2009).
- Staddon et al. (2018) Michael F. Staddon, Dapeng Bi, A. Pasha Tabatabai, Visar Ajeti, Michael P. Murrell, and Shiladitya Banerjee, “Cooperation of dual modes of cell motility promotes epithelial stress relaxation to accelerate wound healing,” PLOS Computational Biology 14, 1–23 (2018).
- Das et al. (2019) Amit Das, Jennifer A. Mitchel, Jin-Ah Park, and Dapeng Bi, “The unjamming transition is distinct from the epithelial-to-mesenchymal transition,” (2019), unpublished.
- Fily and Marchetti (2012) Yaouen Fily and M. Cristina Marchetti, “Athermal phase separation of self-propelled particles with no alignment,” Phys. Rev. Lett. 108, 235702 (2012).
- Clark and Vignjevic (2015) Andrew G Clark and Danijela Matic Vignjevic, “Modes of cancer cell invasion and the role of the microenvironment,” Current Opinion in Cell Biology 36, 13 – 22 (2015), cell adhesion and migration.
- Das et al. (2016) Amit Das, Anirban Polley, and Madan Rao, “Phase segregation of passive advective particles in an active medium,” Phys. Rev. Lett. 116, 068306 (2016).
- Oswald et al. (2017) Linda Oswald, Steffen Grosser, David M Smith, and Josef A Käs, “Jamming transitions in cancer,” Journal of Physics D: Applied Physics 50, 483001 (2017).
- Gamboa Castro et al. (2016) Marielena Gamboa Castro, Susan E. Leggett, and Ian Y. Wong, “Clustering and jamming in epithelial–mesenchymal co-cultures,” Soft Matter 12, 8327–8337 (2016).