3D Packing for Self-Supervised Monocular Depth Estimation:
Supplementary Material
| Method | Supervision | Resolution | GT | Seq. 09 | Seq. 10 |
|---|---|---|---|---|---|
| SfMLearner (Zhou et al. [zhou2017unsupervised]) | M | 416 x 128 | ✓ | 0.021 0.017 | 0.020 0.015 |
| Monodepth2 (Godard et al. [monodepth2]) | M | 640 x 192 | ✓ | 0.017 0.008 | 0.015 0.010 |
| DF-Net (Zou et al. [zou2018dfnet]) | M | 576 x 160 | ✓ | 0.017 0.007 | 0.015 0.009 |
| Vid2Depth (Mahjourian et al. [mahjourian2018unsupervised]) | M | 416 x 128 | ✓ | 0.013 0.010 | 0.012 0.011 |
| GeoNet (Yin et al. [yin2018geonet]) | M | 416 x 128 | ✓ | 0.012 0.007 | 0.012 0.009 |
| Struct2Depth (Casser et al. [casser2018depth]) | M | 416 x 128 | ✓ | 0.011 0.006 | 0.011 0.010 |
| TwoStreamNet (Ambrus et al. [ambrus2019stream]) | M | 640 x 192 | ✓ | 0.010 0.002 | 0.009 0.002 |
| PackNet-SfM | M | 640 x 192 | ✓ | 0.011 0.006 | 0.009 0.007 |
| PackNet-SfM | M+v | 640 x 192 | ✓ | 0.010 0.005 | 0.009 0.008 |
| PackNet-SfM | M+v | 640 x 192 | 0.014 0.007 | 0.012 0.008 |
1 Pose evaluation
In Table 1 we show the results of our proposed PackNet-SfM framework on the KITTI odometry benchmark [geiger2013vision]. To compare with related methods, we train our framework from scratch on sequences 00-08 of the KITTI odometry benchmark, with exactly the same parameters and networks used for depth evaluation (Table 3, main text). For consistency with related methods, we compute the Absolute Trajectory Error (ATE) averaged over all overlapping 5-frame snippets on sequences 09 and 10. Note that our pose network only takes two frames as input, and outputs a single transformation between that pair of frames. To evaluate our model on 5-frame snippets we combine the relative transformations between the target frame and the first context frame into 5-frame long overlapping trajectories, i.e. we stack to create appropriately sized trajectories.
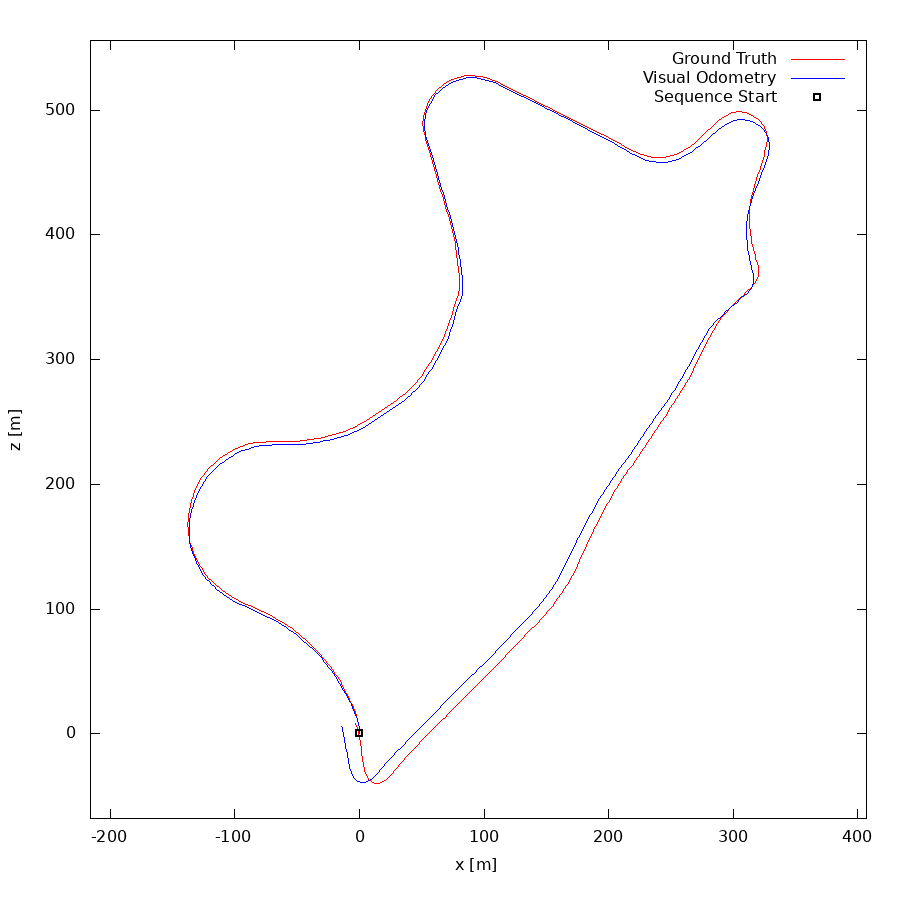
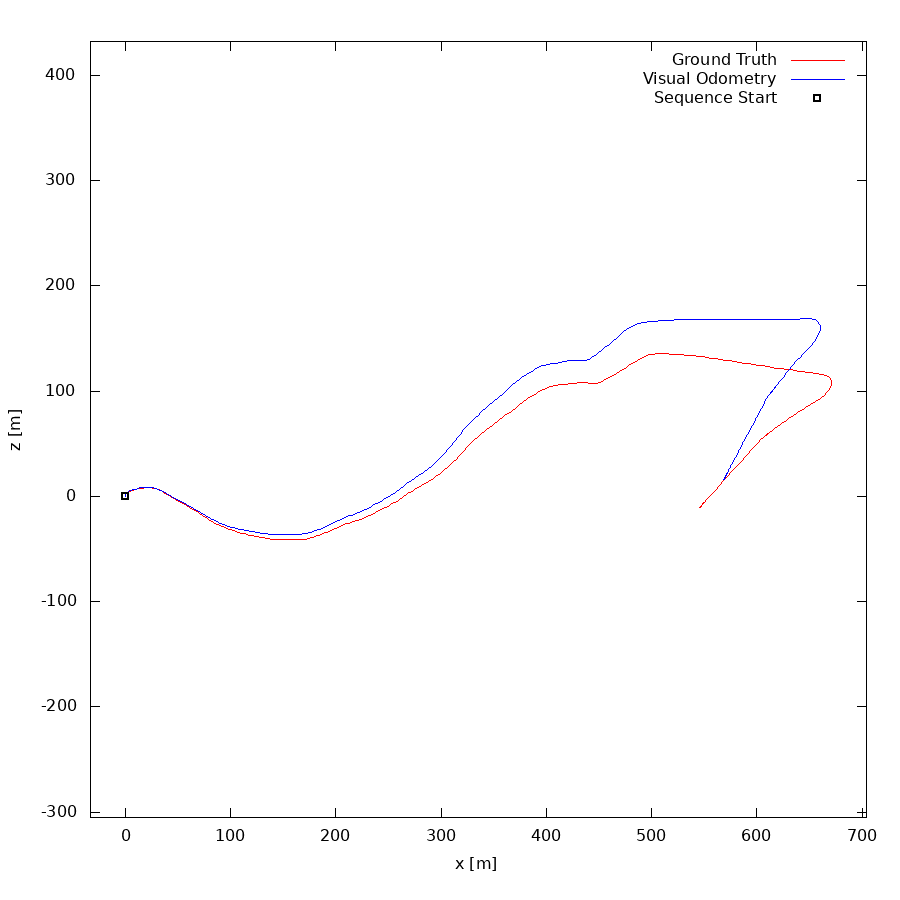
The ATE results are summarized in Table 1, with our proposed framework achieving competitive results relative to other related methods. We also note that all these related methods are trained in the monocular setting (M), and therefore scaled at test-time using ground truth information. Our method, on the other hand, when trained with the proposed velocity supervision loss (M+v) does not require ground-truth scaling at test-time, as it is able to recover metrically accurate scale purely from monocular imagery. Nevertheless, it is still able to achieve competitive results compared to other methods. Examples of reconstructed trajectories obtained using PackNet-SfM for the test sequences can be found in Figure 1.
2 Dense Depth for Automated Driving (DDAD)


In this section, we provide a brief overview of our newly introduced DDAD (Dense Depth for Automated Driving) dataset and the relevant properties that make it desirable as a dense depth estimation benchmark. It includes a high-resolution, long-range Luminar-H2111https://www.luminartech.com/technology as the LiDAR sensor used to generate pointclouds, with a maximum range of 250m and sub-1cm range precision. Additionally, it contains six calibrated cameras time-synchronized at 10 Hz, that together produce a 360∘ coverage around the vehicle. Note that in our work we only use information from the front-facing camera for training and evaluation.
Examples of a Luminar-H2 pointcloud projected onto each of these six cameras are shown in Figures 2, 3 and 4, for different urban settings. The depth maps generated from projecting these Luminar pointclouds onto the camera frame allow us to evaluate depth estimation methods in a much more challenging way, both in terms of denseness and longer ranges. In Table 2 and Figure 6 of the main text we show how our proposed PackNet architecture outperforms other related methods under these conditions. In fact, the gap in performance increases when considering denser ground-truth information at longer ranges, both on the entire interval and at discretized bins.
DDAD is a cross-continental dataset with scenes drawn from urban settings in the United States (San Francisco Bay Area, Detroit and Ann Arbor) and Japan (Tokyo and Odaiba). Each scene is 5 or 10 seconds long and consists of 50 or 100 samples with corresponding Luminar-H2 pointcloud and six image frames, including intrinsic and extrinsic calibration. The training set contains 194 scenes with a total of 17050 individual samples, and the validation set contains 60 senes with a total of 4150 samples. The six cameras are MP (), global-shutter, and oriented at intervals. They are synchronized with Hz scans from our Luminar-H2 sensors oriented at intervals.