SEARCH FOR CP VIOLATION IN MIXING AT LHCB
Abstract
One of the main goals of the LHCb experiment is to determine the mixing-induced CP violating phase in transitions. Assuming the Standard Model, is precisely predicted, hence new physics could easily affect the measurement. The most precise single measurement using data collected in 2015 and 2016 is presented along with a total combined value including all LHCb analyses. The result is further combined with Tevatron and other LHC experimental results.
1 Introduction
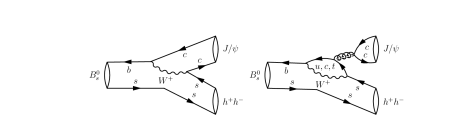
Interference between decay of mesons into CP eigenstates through transitions directly and via mixing gives rise to the CP violating phase . Assuming the Standard Model (SM), and ignoring sub-leading higher-order contributions (Figure 1), can be related to as the following [1]:
| (1) |
where is the mixing phase and the decay phase. Global fits to experimental data lead to a very precise prediction of mrad [2]. If non-SM particles would play a role in the oscillation, they could significantly affect the measured value, which makes very interesting to study.

2 Run 2 analysis of
The most recent measurement performed at LHCb is the time-dependent angular analysis of . The decay has the advantages of a large branching fraction and large reconstruction efficiency. The main background contribution, originating from combinatorial events, is suppressed by a Boosted Decision Tree [4] that is trained while avoiding variables that could introduce a decay time bias. The combined 2015 and 2016 data sample, which corresponds to a total integraded luminosity of at a centre-of-mass energy of = 13 TeV, contains signal candidates.
Due to angular momentum conservation the final state is an admixture of CP-even and CP-odd components, with orbital angular momentum of and , respectively. The kaons in the three polarisation states originate mainly from the decay of the resonance (P-wave), however there is also a CP-odd contribution coming from an S-wave (). An analysis of the decay angles of the kaons and muons is required to disentangle the even and odd components and determine . Three helicity angles are defined as in Figure 2.

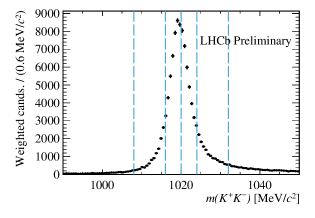
To account for the S-wave, the data sample is split into six bins ([990, 1008, 1016, 1020, 1032, 1050] MeV/, see Figure 3). In each bin the interference between the P- and S-wave contribution is expressed in an effective coupling factor, . This is determined from simulation by integrating the interference in each bin. The flat broad S-wave contribution is considered to be an resonance. The final fit is performed by simultaneously fitting to each bin with a floating fraction as . The background is removed by applying the sPlot [5] technique.
The oscillation occurs very rapidly with a period of about 350 . The oscillation amplitude is proportional to . However it is damped by the LHCb decay time resolution, hence the relative resolution precision directly affects the relative precision on . For an accurate determination of the resolution, prompt data is studied. The calibration yiels a decay time resolution of . Another damping factor arises from the wrong tagging probability of the signal flavour. Flavour tagging algorithms use the information from same-side and opposite-side particles with respect to the signal channel to determine an effective tagging power , where . The separate taggers are optimised using simulation samples and calibrated on data using flavour specific control channels. The taggers are combined to obtain an overall effective tagging power of the signal channel of .
The weighted unbinned likelihood fit is performed using a signal-only Probability Density Function (PDF) [6]. The fit procedure takes into account decay time and angular acceptances, decay time resolution, as well as flavour tagging. The decay-time acceptance is determined using the control channel , because it has a well-known lifetime and similar kinematics. The angular acceptance is taken from simulation by determining normalisation weights for all separate polarisation final states. The final result yields [7], where the first uncertainty is statistical and the second systematic. This is the most precise single measurement of to date and is in agreement with the SM predictions [2].
3 Combination
Many different decay channels have previously been exploited by the LHCb collaboration to determine . These are the Run 1 analyses of [8], [9], for the invariant mass region above the [10], [11] and [12], and the Run 2 analysis of [13]. For the combination, potential systematic correlations have to be taken into account, as the analyses occasionally overlap with datasets and methods used, e.g. prompt data in the decay time resolution determination and in the decay time efficiency determination. The combined LHCb result yields [7], which is in agreement with the SM.
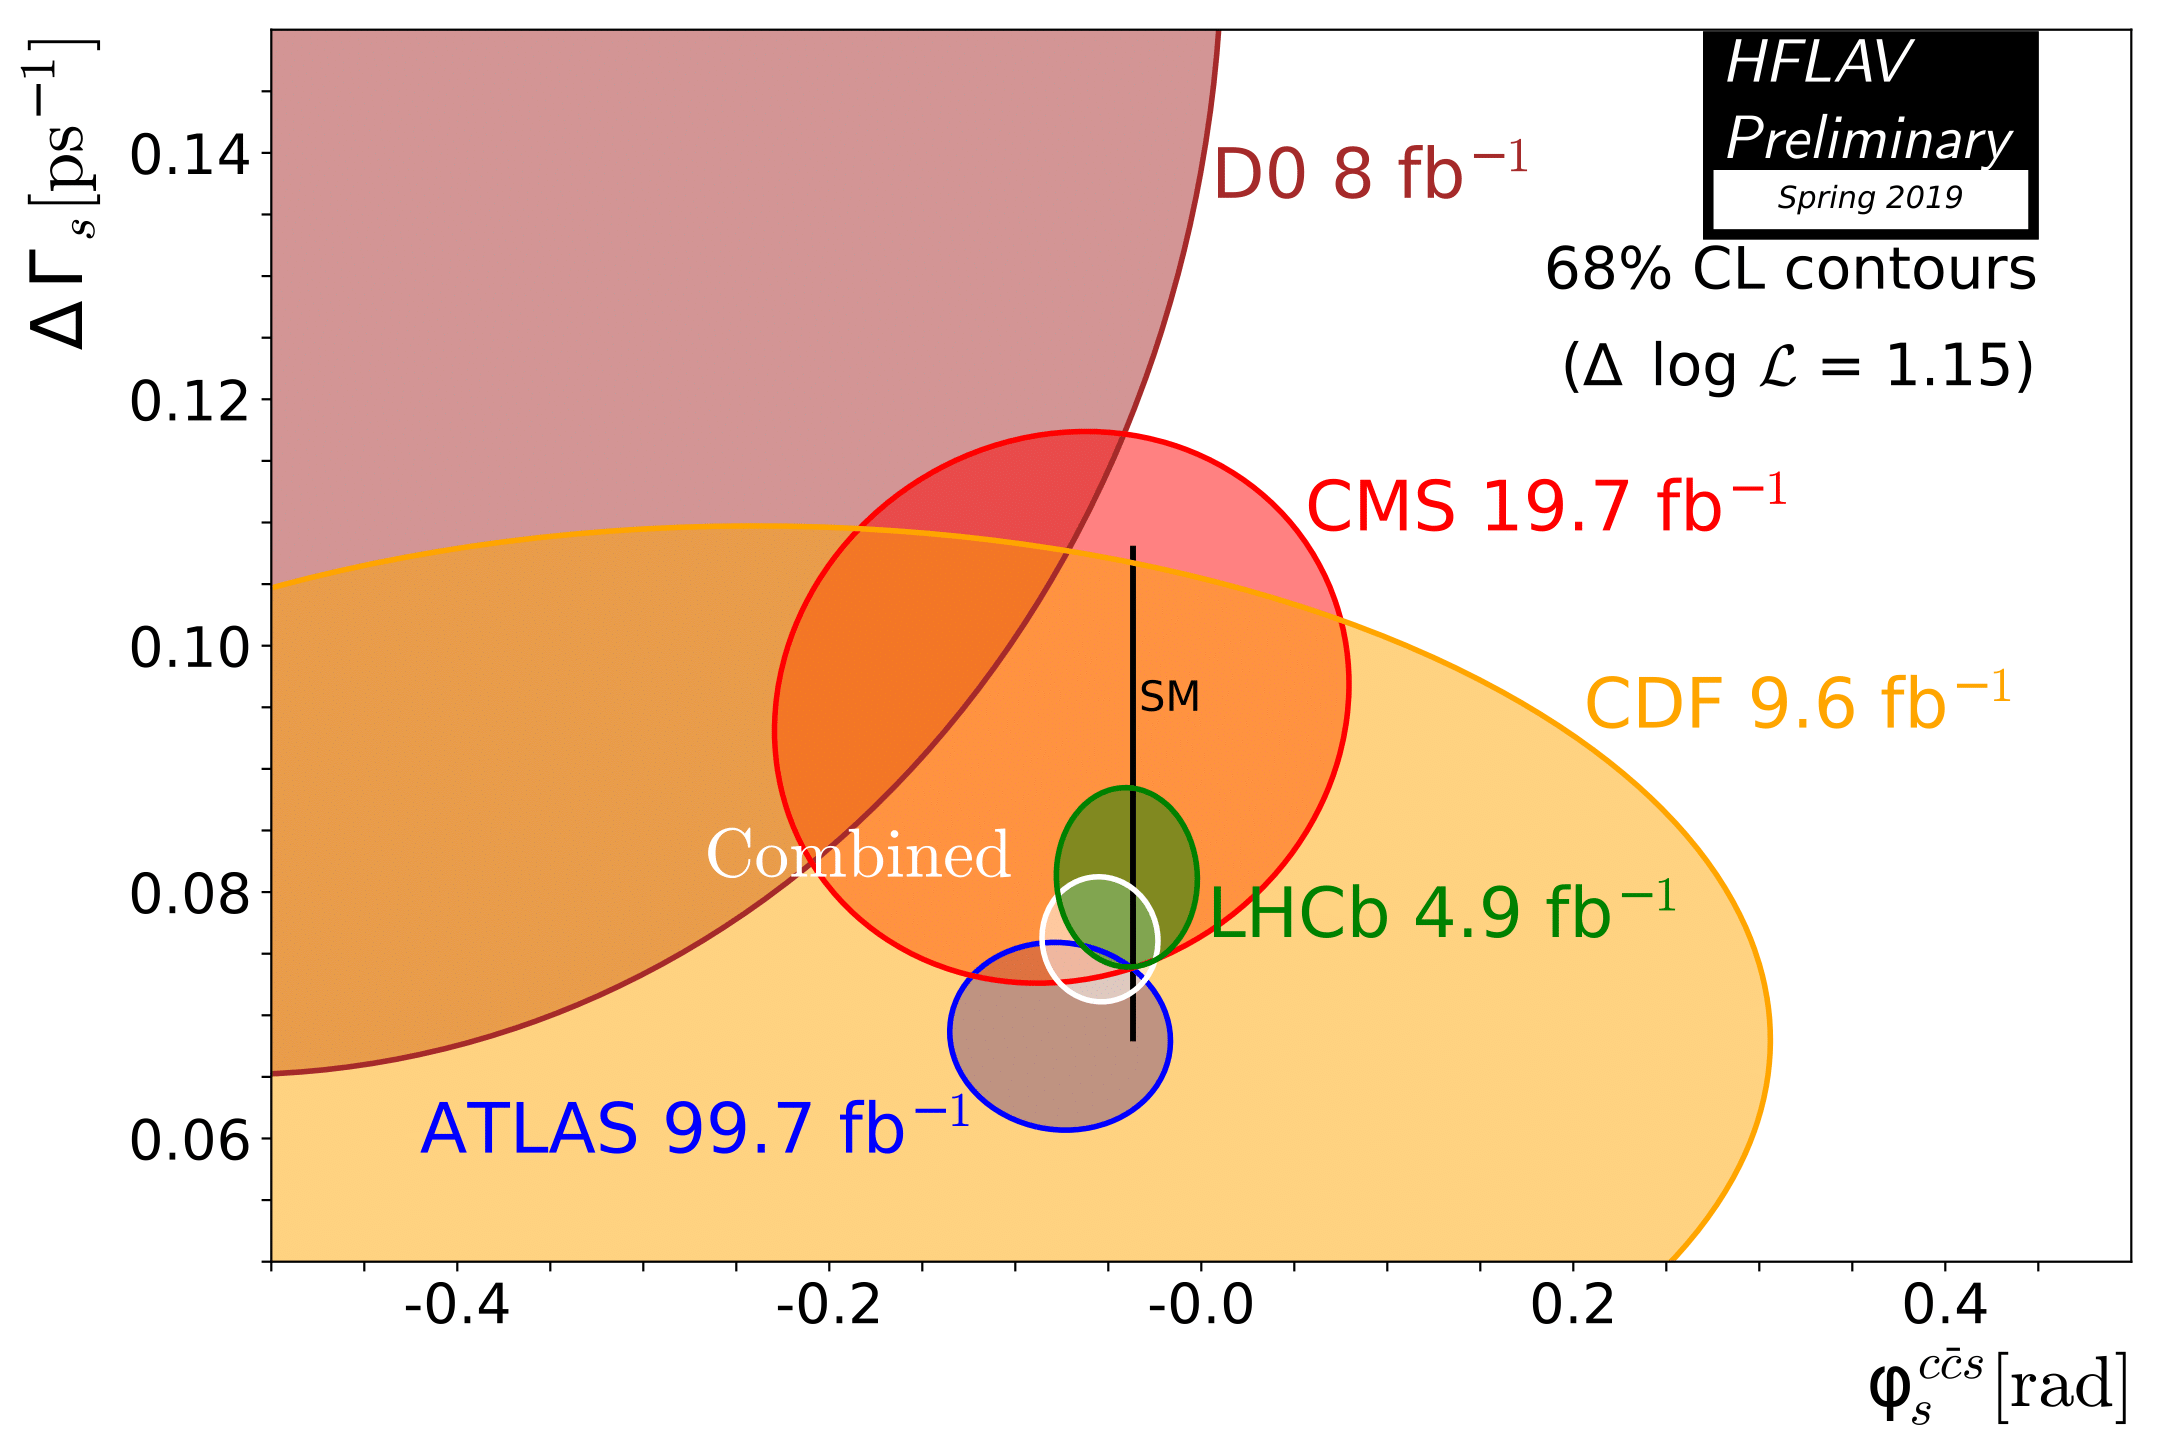
This result is further combined with measurements performed by Tevatron and further LHC experiments, namely the analysis of performed by the D0 [14], CDF [15], ATLAS [16] and CMS [17] collaborations. Figure 4 shows the world average result determined by the Heavy Flavour Averaging Group. The value of the CP violating phase [18](Preliminary) is dominated by LHCb and in agreement with the SM. However the experimental precision is still significantly larger than the theoretical uncertainty, thus leaving enough room for New Physics. More Run 2 data will be added to improve the statistical uncertainty, as well as data from future experimental upgrades with increased LHC luminosity.
References
References
- [1] M. Kobayashi, T. Maskawa, CP Violation in the Renormalizable Theory of Weak Interaction, Prog. Theor. Phys 49, 652 (1973)
- [2] J. Charles et al, Predictions of selected flavour observables within the Standard Model, Phys. Rev. D 84, 033005 (2011), with updated results and plots available at http://ckmfitter.in2p3.fr.
- [3] R. Aaij et al, Measurement of CP violation and the meson decay width difference with and decays, Phys. Rev. D 87, 112010 (2013), arXiv:1304.2600
- [4] A. Hoecker, P. Speckmayer, J. Stelzer, J. Therhaag, E. von Toerne, and H. Voss, TMVA: Toolkit for Multivariate Data Analysis, PoS ACAT, 040 (2007), arXiv:physics/0703039
- [5] M. Pivk and F. R. Le Diberder, sPlot: A statistical tool to unfold data distributions, Nucl. Instrum. Meth. A555, 356 (2005), arXiv:physics/0402083
- [6] Y. Xie sFit: a method for background subtraction in maximum likelihood fit, arXiv:0905.0724
- [7] R. Aaij et al, Updated measurement of time-dependent CP-violating observables in decays, LHCb-PAPER-2019-013
- [8] R. Aaij et al, Precision Measurement of CP Violation in decays, Phys. Rev. Lett. 114, 041801 (2015), arXiv:1411.3104
- [9] R. Aaij et al, Measurement of the CP-violating phase in decays, Phys. Lett. B736, 186 (2014), arXiv:1405.4140
- [10] R. Aaij et al, Resonances and CP violation in the and decays in the mass region above the , JHEP 08, 037 (2017), arXiv:1704.08217
- [11] R. Aaij et al, First study of the CP-violating phase and decay-width difference in decays, Phys. Lett. B762, 253 (2016), arXiv:1608.04855
- [12] R. Aaij et al, Measurement of the CP violating phase in decays, Phys. Rev. Lett. 113, 211801 (2014), arXiv:1409.4619
- [13] R. Aaij et al, Measurement of the CP violating phase from decays in 13 TeV pp collisions, arXiv:1903.05530 (2019)
- [14] V. M. Abazov et al, Measurement of the CP violating phase using the flavor-tagged decay in 8 of collisions, Phys. Rev. D85, 032006 (2012), arXiv:1109.3166
- [15] T. Aaltonen et al, Measurement of the bottom-strange meson mixing phase in the full CDF data set, Phys. Rev. Lett. 109, 171802 (2012), arXiv:1208.2967
- [16] G. Aad et al, Flavour tagged time dependent angular analysis of the decay and the extraction of and the weak phase in ATLAS, Phys. Rev. D90, 052007 (2014), arXiv:1407.1796
- [17] V. Khachatryan et al, Measurement of the CP violating phase and the decay width difference using the decay channel in pp collisions at = 8 TeV, Phys. Lett. B757, 97 (2016), arXiv:1507.07527
- [18] https://www.cppm.in2p3.fr/oleroy/pro/hfag/Spring2019/v5/