RadioAstron probes the ultra-fine spatial structure in the H2O maser emission in the star forming region W49N
Abstract
H2O maser emission associated with the massive star formation region W49N were observed with the Space-VLBI mission RadioAstron. The procedure for processing of the maser spectral line data obtained in the RadioAstron observations is described. Ultra-fine spatial structures in the maser emission were detected on space-ground baselines of up to 9.6 Earth diameters. The correlated flux densities of these features range from 0.1% to 0.6% of the total flux density. These low values of correlated flux density are probably due to turbulence either in the maser itself or in the interstellar medium.
keywords:
galactic H2O masers; star-forming regions; space VLBI1 Introduction
Water vapor masers are common tracers of sites of star formation in their early phases, and therefore maser observations are a crucial tool in the study of the star formation process. Since H2O masers exhibit compact structures in these regions, study of their angular structure require extremely high angular resolution. Typical scales on which H2O masers occur are about 1-100 AU (for example, see Imai et al. 2002) assuming that they are unresolved in milli-arcsec angular resolution or finer. The highest angular resolution can be provided by making use of the Space-VLBI technique of RadioAstron allowing investigation of the most compact structures in star forming regions comparable to the sizes of those H2O masers.
RadioAstron is an international space VLBI project involving the 10-m Space Radio Telescope (SRT) on board the satellite Spektr-R in cooperation with many ground radio telescopes (for more details see Kardashev et al. 2013). The SRT was launched in 2011 on an elliptical orbit whose plane is evolving with time with an apogee of up to 370 000 km. It operates at frequencies of 22, 5, 1.6, and 0.3 GHz 111 www.asc.rssi.ru/radioastron/index.html, last modified on January 2019..
The high-mass star-forming region W49N (G43.16+00.01) is a part of W49A, which is the most massive and luminous star-forming complex in our Galaxy (see, for example, Sievers et al. 1991). W49N is located in the Perseus arm near the solar circle in the first Galactic quadrant at the distance of 11.110.8 kpc from the Sun (Zhang et al., 2013). The distance to W49N from the Galactic mid-plane is only 3 pc. This region contains numerous 22 GHz H2O masers that form the most luminous maser set () in the Galaxy. This makes W49N an excellent target for RadioAstron maser observations. W49N was observed as part of the RadioAstron maser survey during 2014-2015 (Sobolev et al., 2017). The highest angular resolution of 23 as for galactic masers was achieved in these observations on a baseline of 9.6 Earth diameters (ED).
2 Observations
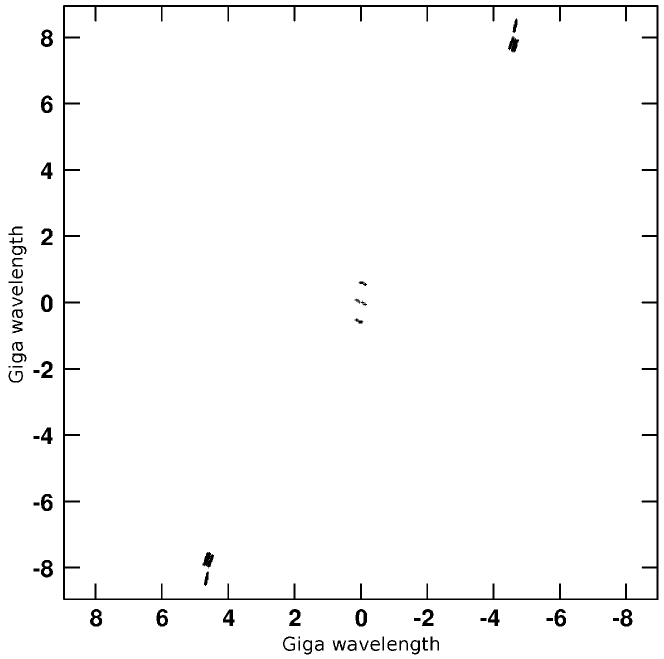
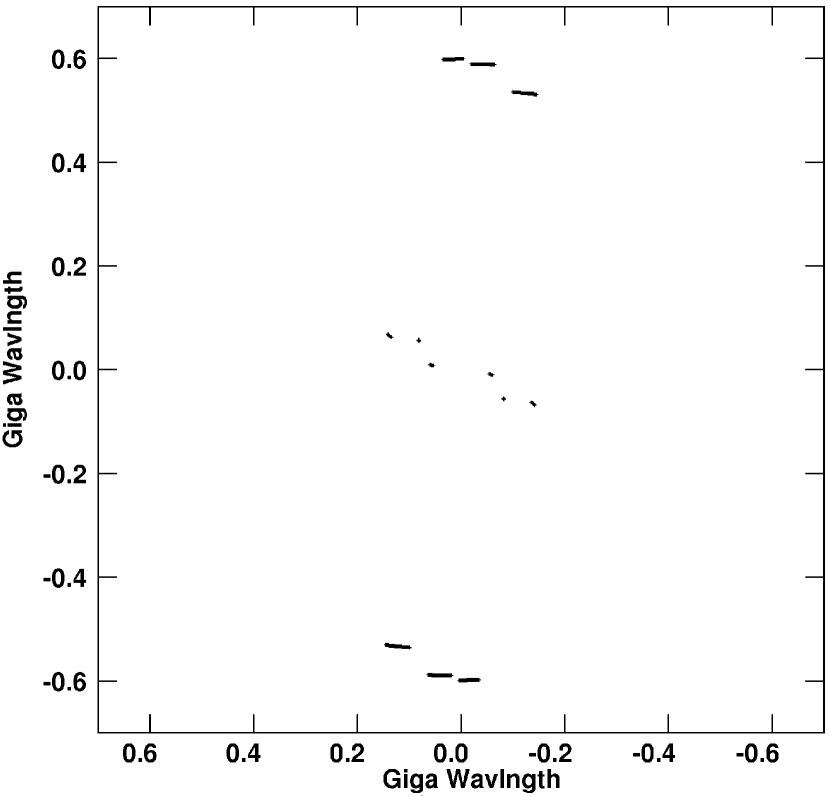
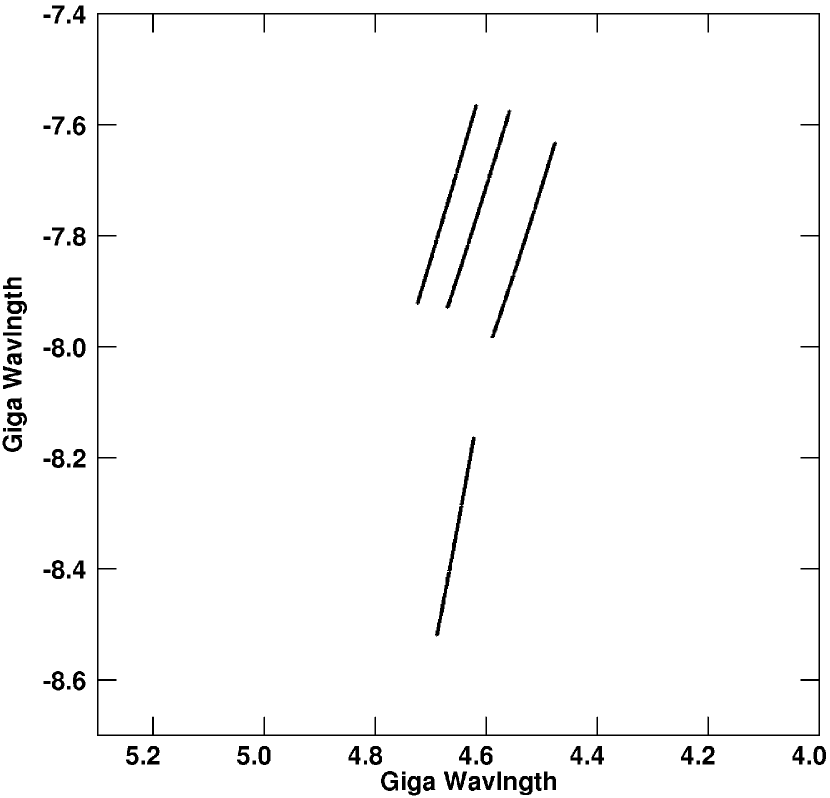
We conducted three observing sessions on W49N as listed in the Table 1. Each observing segment was split into scans of 10-20 minutes. The SRT data were transmitted in real time to the ground tracking stations in Pushchino (Russia) or Green Bank (USA) depending on the SRT visibility conditions (Kardashev et al., 2013; Ford et al., 2014). Left- and right-hand circular polarization data were recorded with a total bandwidth of 32 MHz per polarization. The frequency coverage in the first and second experiments was 22.21222.244 GHz and in the third experiment – 22.22022.252 GHz. The spectral setup between second and third observations was changed in order to put a new flaring feature around km/s in the central part of the upper side band (see Section 4). The -plane coverage for the second observing session is shown on Figure 1. The antenna pointing and phase-tracking center for all the scans on W49N in Table 1 was set to RA, DEC, where the most luminous UCHII region G in the W49N complex is located (Dreher et al., 1984).
There was a calibration scan for 5 minutes provided for ground
telescopes prior to the beginning of each observing segment.
No calibrators were observed on the SRT due to technical and
other restrictions in these three experiments. According to (Kovalev et al., 2019) and RadioAstron User Handbook 222 The RadioAstron User Handbook, ver. 2.92, March 12, 2018,
http://www.asc.rssi.ru/radioastron/documents/rauh/en/rauh.pdf. there are no bright calibrators at 1.3 cm in the close vicinity of W49N, compact enough to give interferometric fringes with RadioAstron on long baselines (up to almost 10 Earth diameters in case of our experiments). However, observations of such calibration sources were not necessary for the present study.
| N∘ | Epoch | Ground telescope | Frequency and | Obs. | Baseline | Fringe |
| array | velocity range, | time, | length, | spacing, | ||
| GHz / km/s | min | ED / km | as | |||
| 1 | 18 May 2014 | Effelsberg 100-m | 22.212 22.244 | 60 | 3.0 | 74 |
| 81.80 +349.39 | 38 000 | |||||
| 2 | 27 April 2015 | Effelsberg 100-m | 22.212 22.244 | 60 | 9.6 | 23 |
| Yebes 40-m | 81.80 +349.39 | 122 000 | ||||
| Torun 32-m | ||||||
| Hartebeesthoek 26-m | ||||||
| 3 | 22 May 2015 | Green Bank 100-m | 22.220 22.252 | 50 | 8.6 | 26 |
| Effelsberg 100-m | 190.65 +240.54 | 110 000 | ||||
| Medicina 32-m | ||||||
| Toruń 32-m |
3 Data reduction
The data were correlated by the RadioAstron correlator developed at the Astro Space Center (ASC) in Moscow (Likhachev et al., 2017). Spectral cross-correlation of the data were obtained with a frequency resolution of 7.81 kHz. The integration time of 0.125 seconds provided a wide field of view of about 10 arcsec.
Post-correlation data reduction was performed using the PIMA software 333 VLBI processing software PIMA, http://astrogeo.org/pima, last modified on March 8, 2019. (Petrov et al., 2011). Its advanced fringe fitting algorithm was developed in order to find fringes on weak radio sources, which is particularly helpful in case of the very long baseline RadioAstron observations. PIMA performs fringe searches in a narrow part of the spectrum corresponding to certain maser features, and thus, for providing solutions of phases, group delays, fringe rates, and phase for the next iteration of data correlation.
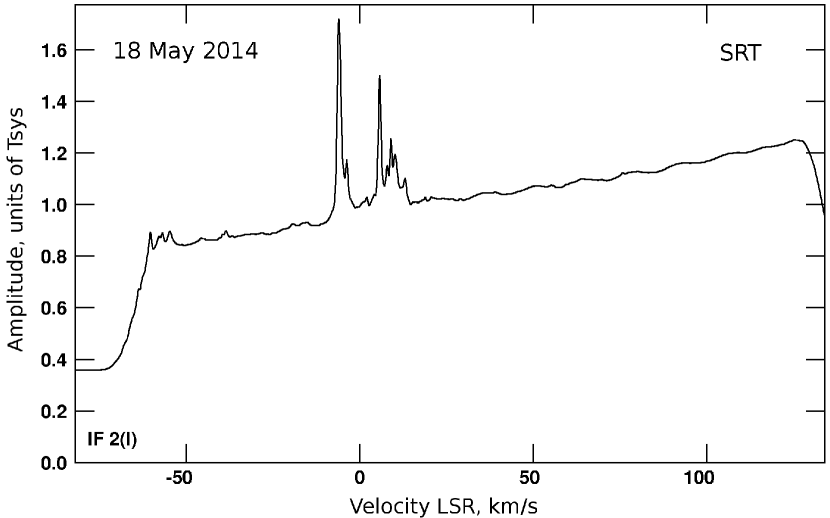
As was noted in Section 2, no calibrators were observed with the SRT. This made it impossible to determine the exact residual group delays for space baselines. Nevertheless, if the maser line gives bright fringes and if it is relatively wide, this yield the necessary signal to noise to permit an approximate delay determination. Since many features in W49N are known to have apparent sizes of 250 as (Gwinn et al., 1988a), it was expected that only the most compact components would remain on long space baselines. We used PIMA for delay solutions, and then the final data set was processed using a standard astronomical package AIPS 444 Astronomical Image Processing System, http://www.aips.nrao.edu, last modified on March 6, 2019.. A raw SRT total power spectrum obtained in the first observing session is shown on Figure 2, where the range corresponds to the 16 MHz upper side band. Note, that it shows a sinusoidal-like shape produced by an onboard digital seven-pole Butterworth filter. These specific ”waves” with peak separations of about 1 MHz (corresponding to 13.5 km/s) do not significantly affect the cross power spectra, which do not have a response to the independent receiver noise contributions from the telescopes.
Amplitude calibration of the data was made using SEFD (System Equivalent Flux Density) measurements provided by ground observatories and SRT. But the difficulty here is that these a priori SEFD values are known with insufficient accuracy and, thus, scales for different telescopes differ from each other. In this case we have to calibrate the scales using the auto-correlation (AC) spectra of the maser emission that is commonly observed in all the telescopes and the SEFD value of the most well calibrated telescope as reference. However, the important thing is that the visibilities are calculated from the initial unnormalized autocorrelation spectra, i.e. they do not depend on the SEFDs. This can be done because W49N is sufficiently strong and thus it is detectable with the SRT in its AC spectrum.
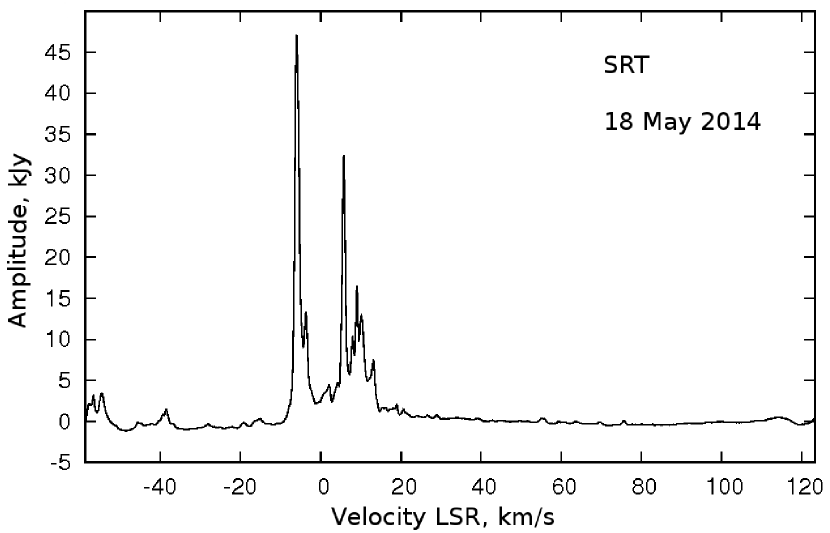
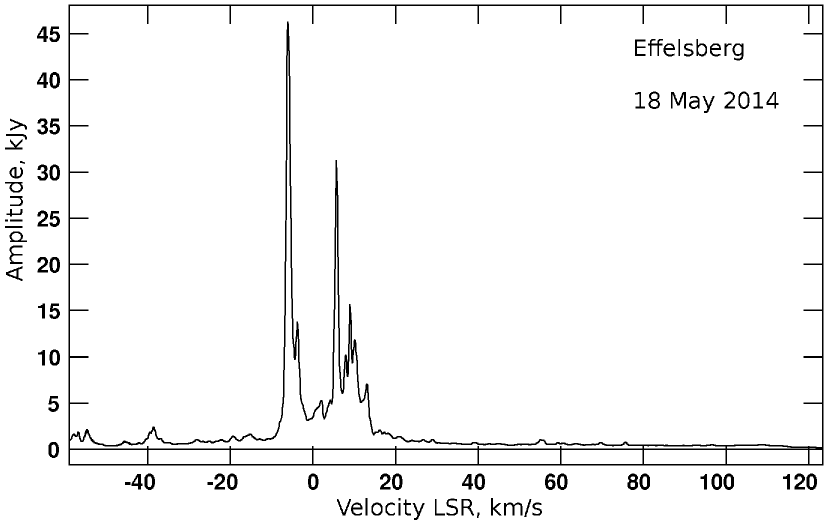
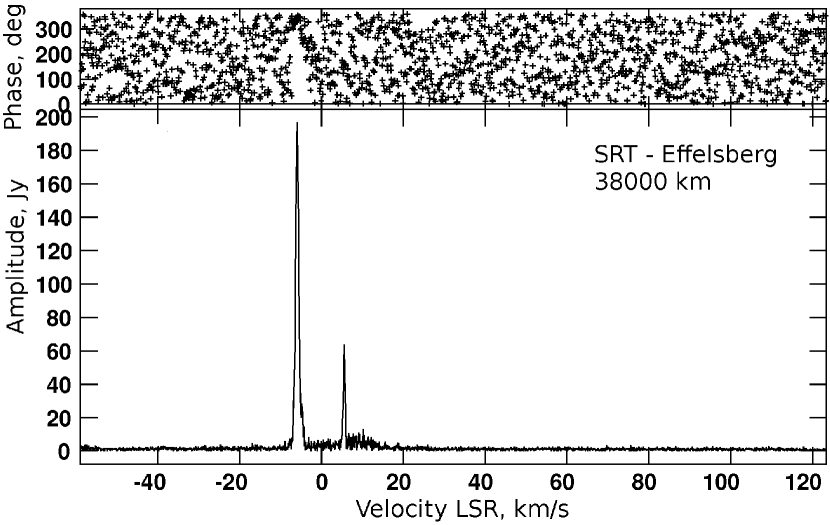
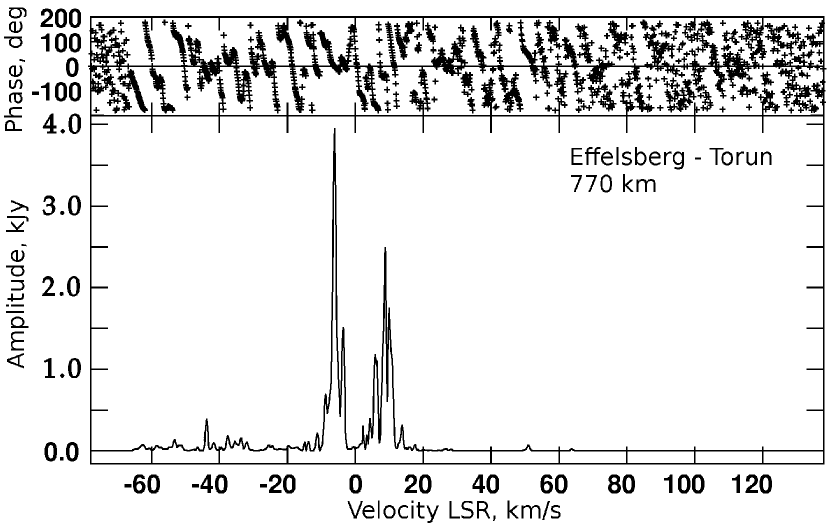
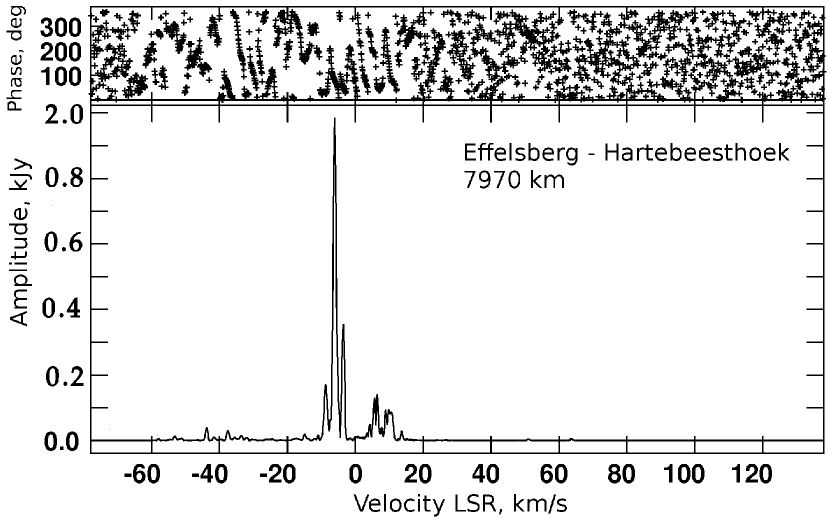
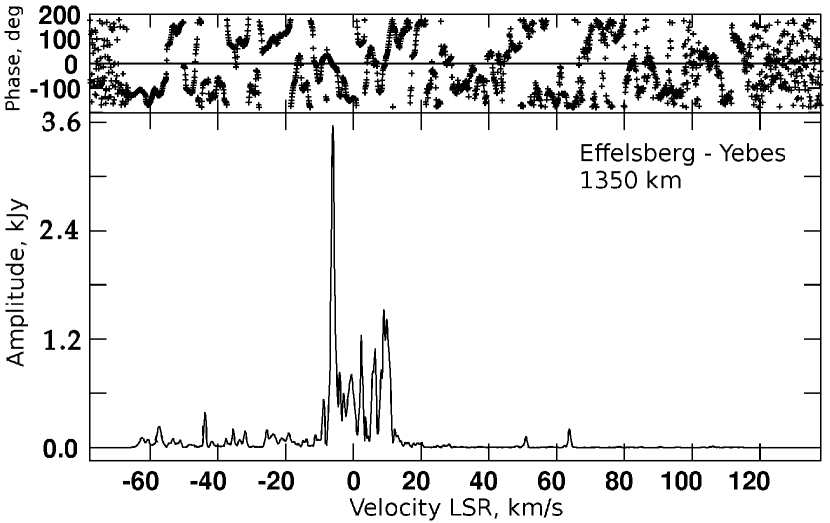
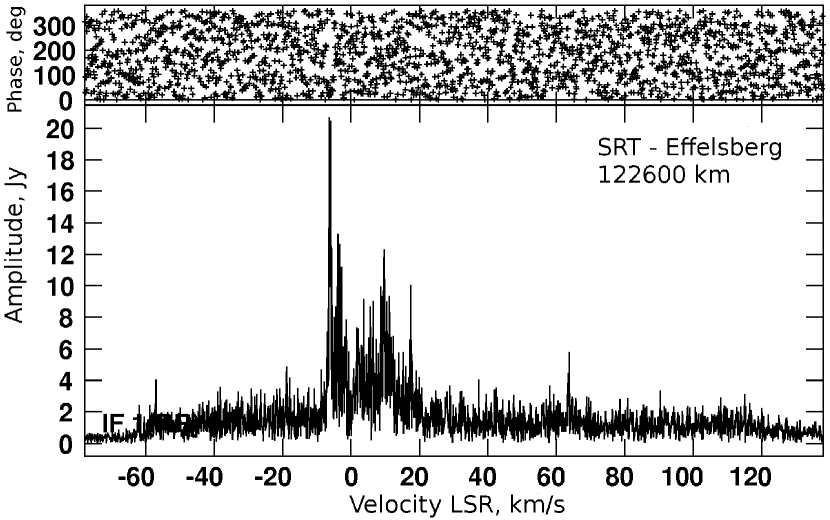
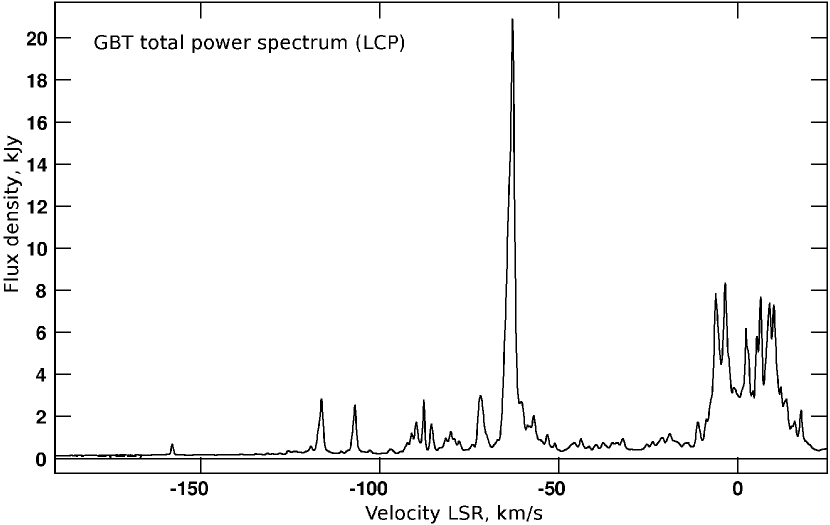
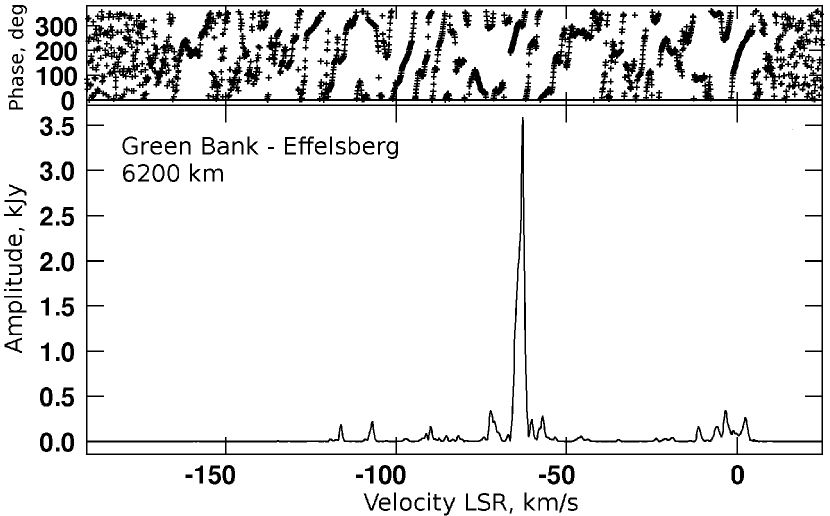
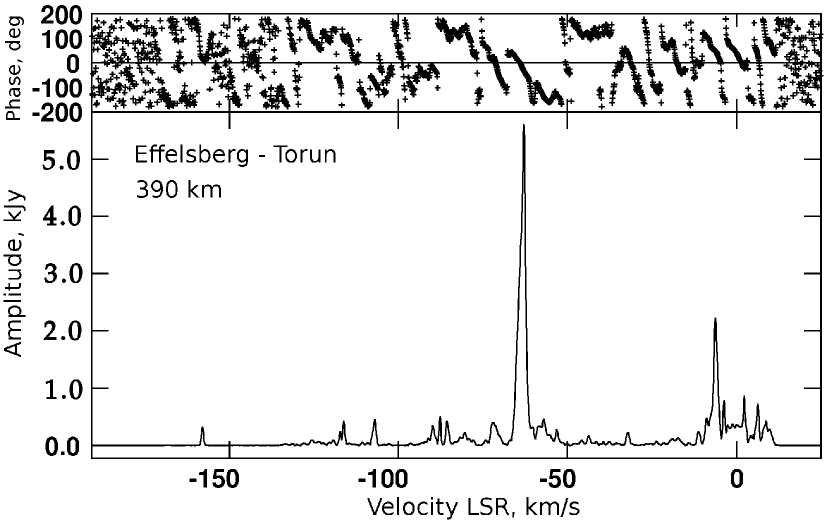
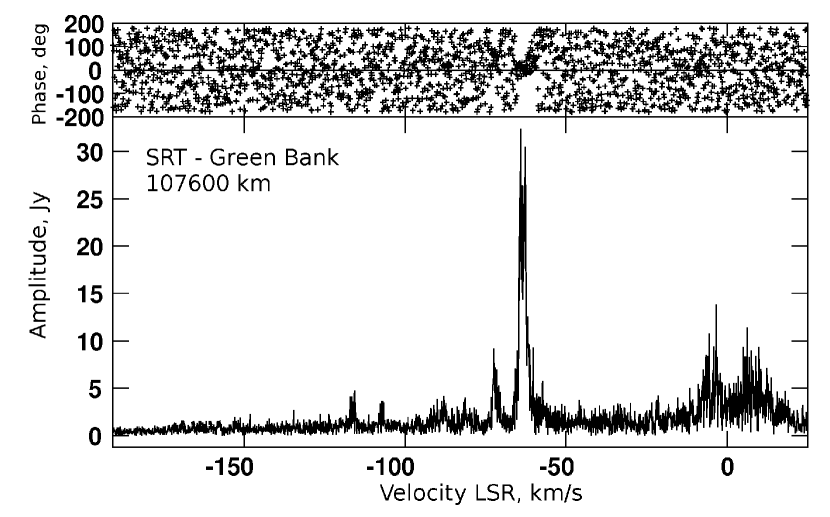
The SRT 10-m, Effelsberg 100-m and Green Bank 100-m total power spectra are shown on Figures 3-5. Note that the faintest velocity component which is clearly visible in the cross power SRT spectrum has a flux density of about 1000 Jy. The vector averaged cross power spectra corresponding to the whole frequency range of observations are also presented on Figures 3-5.
4 Results and discussion
It is well known that the H2O maser emission in W49N shows strong and rapid variability with the bright high-velocity features sporadically arising in velocity range of a few hundred km/s (Gwinn, 1994a). Such features may have flux densities up to several thousand Jy and then disappear. The main part of the W49N H2O maser spectrum around the systemic velocity at 0 km/s is always observable and had a peak flux density during our observations of 40 kJy. The low velocity components were in the observed band for both local oscillator settings. The main spectral masing features at km/s had a total flux density of 45500, 11200 and 8200 Jy in the 1st, 2d and 3d observations, respectively.
Further discussion on the number of maser components detected with space baselines is based on the visibility amplitude and phase profiles. We report only on features with a signal-to-noise ratio 7 on the SRT-ground baselines. The analysis of the distribution of all the W49N maser components based on the fringe-rate mapping method along with comparing it with previous results will be presented in a future publication.
Fringes on a space baseline of 3 ED between the SRT and 100-m Effelsberg telescope were found in the first observing session on 18 May 2014 for two spectral features at 6 km/s and at 6 km/s (see full range cross power spectrum on Figure 3). Lack of the intermediate length baselines does not allow us to explore the structure of the features so as to distinguish the flux density contributions from different structural components.
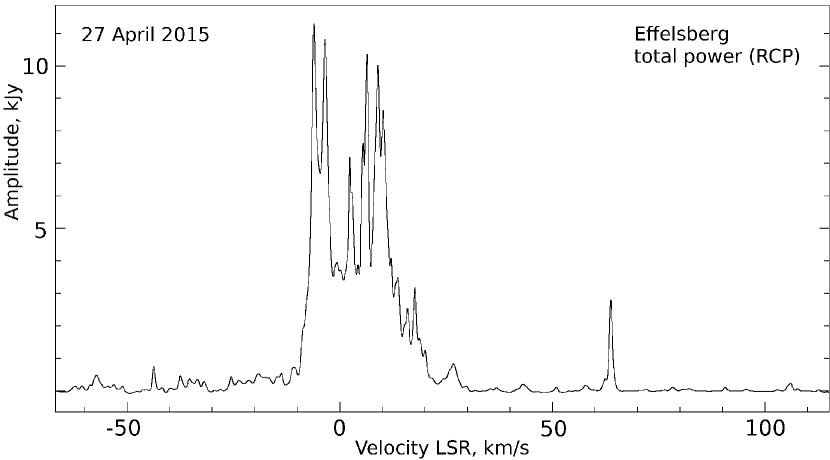
In the second observing session on 27 April 2015, only the brightest component at the velocity 6 km/s was detected on the space baseline of 9.6 Earth diameters between the SRT and Effelsberg. The corresponding fringe spacing was 23 as, which is the record fringe spacing achieved for galactic masers (see Figure 4, bottom panel). Along with the main part of the W49N spectrum a new short-lived maser feature at 64 km/s was observed in this session (see Figure 4, top panel). According to monitoring on the Effelsberg 100-m telescope (Kramer et al., 2018), this feature appeared a few weeks before the observation on RadioAstron and disappeared a few months later. This short-lived component gave fringes only on ground baselines up to the longest baseline Effelsberg-Hartebeesthoek. The fringe on this baseline has a small amplitude of 4 Jy and is not readily seen on the scale of plotting. The possible feature at 64 km/s in the SRT-Effelsberg cross power spectrum does not show the normal constancy of phase across the profile, so we cannot confirm it to be a real detection.
During the third observation on 22 May 2015 a group of bright features around 63 km/s was observed (see Figure 5, top left panel), which produced fringes on space baseline of 8.6 Earth diameters between the SRT and Green Bank (GBT). Weak fringes were also found for a component at 72 km/s. No fringes on space baselines for other components were found in this session.
The correlated fraction of the total flux density of the detected maser components are summarized in Table 2. It is very interesting that the most compact spectral components detected at space baselines in three experiments contain less than 1% of the corresponding total flux density. The visibility amplitude vs the length of the projected baseline for the two compact features detected is plotted on Figure 6.
Gwinn et al.(1988a) analyzed the ground based visibility measurements of some features in W49N out to ground based baselines of 8000 km and concluded that the apparent angular sizes of 250 as could be explained by Kolmogorov turbulence, presumably arising in the ISM (see also Gwinn et al. 1988b). Our observations with RadioAstron greatly extend the observing basis for the analysis of scattering effects. It is clearly seen from Figure 6 that the part of visibility curve corresponding to RadioAstron measurements is sloping much more slowly than expected from the single Gaussian which is usually a good approximation for a source with the simple structure. We are investigating whether our measured low amplitude visibilities are due to reaching the refractive noise level caused by interstellar scintillation when observing at such long baselines up to 9.6 ED. It was shown in (Johnson et al., 2016) that at wavelength of 1.3 cm the rms refractive fluctuations (noise) in some cases could dominate measured visibilities at very long baselines of 120000 km and higher. Without refractive scattering we probably would have seen no fringes on W49N with RadioAstron because of the long propagation path through the ISM.
An alternative explanation for the observed form of the visibility curve is that the maser spots probably have complex structure which results from the scattering by the ionized gas as proposed for W49N (Gwinn, 1994b) or caused by the turbulence in the region where the maser is formed (see theoretical calculations by Sobolev et al. 2003, 2008). Influence of the turbulence on the ultra-fine structure of the maser images was described for the example of RadioAstron observations of water maser emission in Cepheus A by Sobolev et al. (2018). Perhaps, both effects takes place, so this issue requires more investigation.
| Observation | VLSR, | Fraction of the total | Baseline |
|---|---|---|---|
| km/s | flux density | ED | |
| 18 May 2014 | 6 | 0.006 | 3.0 |
| 6 | 0.003 | ||
| 27 Apr 2015 | 6 | 0.001 | 9.6 |
| 22 May 2015 | 63 | 0.002 | 8.6 |
| 72 | 0.004 |
5 Conclusions
In this paper we presented the results of observations of the water maser emission in W49N with the space interferometer RadioAstron in the spectral mode in 2014-2015. A description of observing mode and general design of conducted sessions is provided. We also briefly described the spectral data processing procedure to show that it yields successful results not only for ground-based array, but also for space VLBI RadioAstron.
The most compact maser spots in W49N were detected on space baselines up to 9.6 Earth diameters. The correlated flux density of the most compact structures is a fraction of a percent of the single dish flux density. These low values of correlated flux density are probably due to turbulence either in the maser itself or in the interstellar medium.
Acknowledgments
The RadioAstron project is led by the Astro Space Center of the Lebedev Physical Institute of the Russian Academy of Sciences and the Lavochkin Scientific and Production Association under a contract with the State Space Corporation ROSCOSMOS, in collaboration with partner organizations in Russia and other countries.
This work is based on observations carried out using the 100-meter radio telescope of the MPIfR (Max-Planck-Institute for Radio Astronomy) at Effelsberg, 100-meter R.C. Byrd Green Bank Telescope of the Green Bank Observatory, which is a facility of the National Science Foundation operated under cooperative agreement by Associated Universities, Inc., 26-meter radio telescope operated by Hartebeesthoek Radio Astronomy Observatory in Johannesburg, Republic of South Africa, 32-meter telescope in Medicina operated by INAF - Istituto di Radioastronomia and 32-meter radio telescope operated by Toruń Centre for Astronomy of Nicolaus Copernicus University in Toruń (Poland) and supported by the Polish Ministry of Science and Higher Education SpUB grant.
NNS acknowledges support from Russian Science Foundation grant 18-12-00193. AMS work was supported by the Ministry of Education and Science (the basic part of the State assignment, RK No. AAAA-A17-117030310283-7) and by the Act No. 211 of the Government of the Russian Federation, agreement 02.A03.21.0006.
References
- Dreher et al. (1984) Dreher, J.W., Johnston, K.J., Welch, W.J., Walker, R.C. 1984, Ultracompact structure in the H II region W49N, The Astrophysical Journal, 283, pp. 632-639.
- Ford et al. (2014) Ford, H.A., Anderson, R., Belousov, K., et al. 2014, The RadioAstron Green Bank Earth Station, in: Ground-based and Airborne Telescopes V, eds. Stepp, L.M., Gilmozzi, R., Hall, H.J., SPIE Proceedings, v. 9145, access record, p. 91450B.
- Gwinn et al. (1988a) Gwinn, C.R., Moran, J.M., Reid, M.J. 1988a, Interstellar scattering of radiation from H2O masers in W49 and Sgr B2, in: Radio wave scattering in the interstellar medium, Proceedings of the AIP Conference, San Diego, CA, Jan. 18, 19, 1988 (A89-20276 06-90). New York, American Institute of Physics, 174, pp. 129-133.
- Gwinn et al. (1988b) Gwinn, C.R., Moran, J.M., Reid, M.J., Schneps, M.H., 1988b, Limits on refractive interstellar scattering toward Sagittarius B2, The Astrophysical Journal, 330, pp. 817-827.
- Gwinn (1994a) Gwinn, C.R. 1994a, Physical structure of H2O masers in W49N, The Astrophysical Journal, 429, 1, pp. 253-267.
- Gwinn (1994b) Gwinn, C.R. 1994b, Scattered halos around H2O masers, The Astrophysical Journal Letters, 431, 2, pp. L123-L126.
- Imai et al. (2002) Imai, H., Deguchi, S., Sasao, T. 2002, Microstructure of Water Masers in W3 IRS 5, The Astrophysical Journal, 567, 2, pp. 971-979.
- Johnson et al. (2016) Johnson, M.D., Kovalev, Y.Y., Gwinn, C.R., Gurvits, L.I. et al. 2016, Extreme Brightness Temperatures and Refractive Substructure in 3C 273 with RadioAstron, The Astrophysical Journal Letters, 820:L10 (6pp).
- Kardashev et al. (2013) Kardashev, N.S., Khartov, V.V., Abramov, V.V. et al. 2013, RadioAstron – a Telescope with a Size of 300 000 km: Main Parameters and First Observational Results, Astronomy Reports, 57, 153-194.
- Kovalev et al. (2019) Kovalev, Y.Y., Kardashev, N.S., Sokolovsky, K.V., Voitsik, P.A. et al. 2019, Detection statistics of the RadioAstron AGN survey, Advances in Space Research, this issue, submitted.
- Kramer et al. (2018) Kramer, B.H., Menten, K.M., Kraus, A. 2018, Variability of Water Masers in W49N: Results from Effelsberg Long-term Monitoring Programme, in: Astrophysical Masers: Unlocking the Mysteries of the Universe, Proceedings of the International Astronomical Union, IAU Symposium, 336, eds. Tarchi, A., Reid, M.J. and Castangia, P., Cambridge University Press, ISSN 1743-9213, pp. 279-280.
- Likhachev et al. (2017) Likhachev, S.F., Kostenko, V.I., Girin, I.A., et al., 2017, Software Correlator for Radioastron Mission, Journal of Astronomical Instrumentation, 6, 1750004–131.
- Petrov et al. (2011) Petrov, L., Kovalev, Y.Y., Fomalont, E.B., Gordon, D., 2011, The Very Long Baseline Array Galactic Plane Survey – VGaPS, The Astronomical Journal, 142, pp. 35-57.
- Sievers et al. (1991) Sievers, A.W., Mezger, P.G., Bordeon, M.A., Kreysa, E., Haslam, C.G.T., Lemke, R. 1991, Astronomy and Astrophysics, 251, pp. 231-244.
- Sobolev et al. (2017) Sobolev, A.M., Shakhvorostova, N.N., Alakoz, A.V. & Baan, W.A. 2017, RadioAstron Maser Observations: a Record in Angular Resolution, in: Stars: From Collapse to Collapse, Proceedings of a conference held at Special Astrophysical Observatory, Nizhny Arkhyz, Russia, 3-7 October 2016. Eds. Balega, Y.Y., Kudryavtsev, D.O., Romanyuk, I.I., and Yakunin, I.A., San Francisco: Astronomical Society of the Pacific, 510, pp. 27-31.
- Sobolev et al. (2003) Sobolev, A.M., Watson, W.D., Okorokov, V.A. 2003, Images of Astrophysical Masers and their Variability in a Turbulent Medium: The 25 GHz Methanol Masers, The Astrophysical Journal, 590, 1, pp. 333-339.
- Sobolev et al. (2008) Sobolev, A.M., Sutton, E.C., Watson, W.D., Ostrovskii, A.B., Shelemei, O.V. 2008, Sizes of Masing Parts of Massive Star Forming Regions, Radio Physics and Radio Astronomy, 13, pp. 76-80.
- Sobolev et al. (2018) Sobolev, A.M., Moran, J.M., Gray, M.D., Alakoz, A.V., Imai, H. et al. 2018, Sun-sized Water Vapor Masers in Cepheus A, The Astrophysical Journal, 856:60 (9pp).
- Zhang et al. (2013) Zhang, B., Reid, M.J., Menten, K.M., Zheng, X.W., Brunthaler, A., Dame, T.M. & Xu, Y. 2013, Parallaxes for W49N and G048.60+0.02: Distant Star Forming Regions in the Perseus Spiral Arm, The Astrophysical Journal, 775:79 (13pp).