Pseudogap, van Hove Singularity, Maximum in Entropy and Specific Heat for Hole-Doped Mott Insulators
Abstract
The first indication of a pseudogap in cuprates came from a sudden decrease of NMR Knight shift at a doping-dependent temperature . Since then, experiments have found phase transitions at a lower . Using plaquette cellular dynamical mean-field for the square-lattice Hubbard model at high temperature, where the results are reliable, we show that shares many features of . The remarkable agreement with several experiments, including quantum critical behavior of the electronic specific heat, supports the view that the pseudogap is controlled by a finite-doping extension of the Mott transition. We propose further experimental tests.
pacs:
71.30.+h, 74.25.Dw, 71.10.FdI Introduction
Below a doping-dependent temperature , early studies of cuprate high temperature superconductors found a decrease in NMR Knight shift Alloul et al. (1989); Berthier, C. et al. (1996); Curro et al. (1997); Timusk and Statt (1999); Kawasaki et al. (2010). This freezing of uniform spin fluctuations, a thermodynamic quantity, became the first signature of what is widely referred to as the pseudogap, one of the remaining challenges for theory. With time, another definition of the pseudogap became more popular. Polarized neutron diffraction Fauqué et al. (2006); Mook et al. (2008); Mangin-Thro et al. (2015), Nernst effect measurements Daou et al. (2010), ultrasound measurements Shekhter et al. (2013), terahertz polarimetry Lubashevsky et al. (2014) and optical anisotropy measurements Zhao et al. (2017) report that the prototypical YBa2Cu3Oy undergoes a thermodynamic phase transition that breaks time-reversal, spatial inversion, two-fold rotational, four-fold rotational and mirror symmetries below a doping-dependent temperature that is distinctly lower than at low doping. This suggests that phase transitions are a consequence of the pseudogap first observed in NMR, not the cause Parker et al. (2010); Sordi et al. (2012a).
In this paper, we address the nature of the pseudogap that was first found in NMR. We focus mostly on thermodynamic signatures at high temperature, where cluster generalizations of dynamical mean-field theory provide a reliable theoretical tool 111An 8 site DCA calculation of the Knight shift Chen et al. (2017); Wu et al. (2018) for a smaller value of than that considered here, nevertheless gives a temperature dependence of the line quite comparable to ours.. The remarkable agreement that we find with several experiments supports the view that the high-temperature physics of the pseudogap is controlled by a finite-doping extension of the Mott transition that includes superexchange effects Sordi et al. (2010). We propose further experimental tests to investigate that hypothesis. The connection between Mott transition and pseudogap was also suggested by calculations in smaller clusters Stanescu and Phillips (2003).
Although recent experimental results usually relate to the lower-temperature line, where denotes hole doping, the and lines are almost parallel, which suggests that they are related. Experimental results for can be classified into two families.
The first family of results identifies the main features of the line. Recent Hall measurements on YBa2Cu3Oy (YBCO), La2-xSrxCuO4 (LSCO) and La1.6-xNd0.4SrxCuO4 (Nd-LSCO) highlighted a sharp jump in carrier density with increasing hole doping across a material-dependent critical doping at which the line suddenly drops Badoux et al. (2016); Laliberte et al. (2016); Collignon et al. (2017). This drop, also observed in Raman scattering experiments on Bi2Sr2CaCu2O8+δ (Bi2212) Loret et al. (2017), occurs between a low-doping antiferromagnetic Mott insulating regime Ando et al. (2004) and a high-doping metallic regime Mackenzie et al. (1996). Moreover, the specific heat divided by temperature scales logarithmically as a function of temperature around this sharp transition in LSCO, Nd-LSCO and La1.8-xEu0.2SrxCuO4 (Eu-LSCO) Michon et al. (2019), which strengthens its interpretation as a finite temperature extension of an underlying quantum critical point.
The second family of results regarding the line identifies how its main features vary across different materials under external parameters, and how they relate to the rest of the phase diagram. The Nernst effect measurements of Ref. Cyr-Choinière et al. (2018) establish that while both the line’s slope and the position of differ between different parent compounds (YBCO and LSCO), only the position of changes with chemical pressure within the same family of compounds (LSCO, Nd-LSCO and Eu-LSCO). Furthermore, it has been shown in Ref. Doiron-Leyraud et al. (2017) that shifts towards lower doping in Nd-LSCO under applied pressure. This unexpected shift seems to be driven by a corresponding shift in , the doping at which a van Hove singularity appears in the local density of states. Since this Lifshitz transition in cuprates translates into a change of the Fermi surface from hole-like to electron-like with increasing doping, as determined by angle-resolved photoemission spectroscopy (ARPES) Kondo et al. (2004); Chang et al. (2008); Yoshida et al. (2009); Matt et al. (2015), this suggests that the pseudogap cannot open on an electron-like Fermi surface, so that the condition
| (1) |
should always be satisfied. For instance, Ref. Loret et al. (2017) reports in Bi2212. Apart from the van Hove singularity, experiments performed on calcium-doped YBCO and Bi2212 report a vertical regime of maximum electronic entropy in the phase diagram close to Tallon and Loram (2001); Tallon et al. (2004); Storey et al. (2007); Tallon . This observation is consistent with the behavior of thermopower when interpreted in terms of entropy Chakraborty et al. (2010); Garg et al. (2011). Finally, the critical regime around also corresponds to the zone in the phase diagram where superconductivity is most resilient to strong magnetic fields Grissonnanche et al. (2014), hinting that it may actually nurture superconductivity. This link between both phases of matter has been the subject of many past studies Sordi et al. (2012b); Chen et al. (2013); Gull et al. (2013); Cyr-Choinière et al. (2018).
While much is already known about the line, much less is known regarding the fate of the NMR line with increasing doping, except for the fact that raw data for LSCO is consistent with a sudden drop of at a doping close to where also drops Nakano et al. (1994).
However, most theoretical works study the line, focusing on the two-dimensional single-band Hubbard model on a square lattice Gutzwiller (1963); Hubbard (1963); Kanamori (1963). In addition, cluster extensions of dynamical mean-field theory (DMFT), such as cellular dynamical mean-field theory (CDMFT) and the dynamical cluster approximation (DCA) Maier et al. (2005); Kotliar et al. (2006); Tremblay et al. (2006) using various quantum impurity solvers Hirsch and Fye (1986); Rubtsov et al. (2005); Gull et al. (2011); Werner and Millis (2006); Werner et al. (2006); Haule (2007); Gull et al. (2007, 2008), have shown that the Hubbard model captures many features of the superconductivity and pseudogap of cuprate compounds Lichtenstein and Katsnelson (2000); Jarrell et al. (2001); Civelli et al. (2005); Tremblay et al. (2006); Macridin et al. (2006); Kyung et al. (2006); Haule and Kotliar (2007); Ferrero et al. (2009); Gull et al. (2009); Sakai et al. (2009); Werner et al. (2009); Gull et al. (2010, 2013); Gunnarsson et al. (2015). The same applies to its strong-interaction limit when correlated hopping is neglected: the - model Haule et al. (2002, 2003); Bittner et al. (2018). DCA studies Mikelsons et al. (2009); Vidhyadhiraja et al. (2009) found a maximum in entropy and a critical logarithmic scaling for the specific heat at a critical doping. Moreover, Refs. Gunnarsson et al. (2015); Maier et al. (2016); Chen et al. (2017) established that pseudogap formation and superconducting pairing are both linked through short-ranged spin physics Scalapino et al. (1986); Maier et al. (2008); Dahm et al. (2009); Kyung et al. (2009); Scalapino (2012); Nishiyama et al. (2013); Sénéchal et al. (2013); Reymbaut et al. (2016). Closer to aforementioned experiments, Refs. Wu et al. (2018); Bragança et al. (2018) found an unambiguous link between pseudogap formation and Fermi surface topology through the pole-like feature of the electronic self-energy, conjecturing that Eq. (1) for should also hold for .
Finally, a set of CDMFT studies spanning almost a decade has highlighted the existence of a finite-doping phase transition, here dubbed the “Sordi transition”Sordi et al. (2010, 2011), that acts as an organizing principle for the - phase diagram of cuprates Sordi et al. (2012a); Fratino et al. (2016a). This transition is a finite-doping extension of the first-order Mott transition found at half-filling, separating pseudogap and correlated metallic phases in the normal-state phase diagram (where superconductivity is not allowed) Sordi et al. (2010, 2011). In this normal-state phase diagram, the Sordi transition ends at finite at a second-order critical point above which it extends as a Widom line Xu et al. (2005) in the high-temperature crossover regime. Even if the low-temperature normal-state phase diagram is usually metastable, hidden by more ordered states, the associated high-temperature crossover regime can be observed in a doped organic compound thanks to magnetic frustration Oike et al. (2015). More specifically, in both doped Mott insulators Sordi et al. (2012a, 2013); Fratino et al. (2016a) and doped charge-transfer insulators Fratino et al. (2016b), the Knight shift pseudogap line is parallel to the Widom line and appears as a high-temperature precursor of this crossover line. drops to zero precipitously at in the vicinity of the Sordi transition. In addition, these CDMFT studies retrieve the aforementioned maximum in entropy close to Sordi et al. (2011) and a van Hove-like singularity at higher doping Sordi et al. (2012a).
II Methods
Here we study the two-dimensional Hubbard model on a square lattice with the nearest-neighbour hopping, the next-nearest-neighbour hopping and the on-site Coulomb repulsion. The hopping serves as the energy unit, and . This model is implemented with CDMFT, where a 22 cluster of sites Kotliar et al. (2001); Haule and Kotliar (2007) is dynamically coupled to a bath of non-interacting electrons by a frequency-dependent hybridization function. The quantum impurity problem is solved with continuous-time quantum Monte Carlo in the hybridization expansion Werner and Millis (2006); Werner et al. (2006); Haule (2007); Gull et al. (2007). Note that close to half-filling, where finite-size effects are expected to be largest because of antiferromagnetism, systematic studies up to 5% doping at show that 22 clusters give accurate results Sakai et al. (2012). All details regarding our various physical criteria can be found in the Supplemental Material 222In the Supplemental Material we explain how we find and from the magnetic susceptibility, how we do analytic continuation to find the van Hove line , how we use a Maxwell relation to find the location of the maximum of entropy and how we find the specific heat. We also explain how error bars are estimated..
III Results
III.1 NMR , van Hove singularity and maximum of the entropy
Fig. 1 (left) shows the normal-state phase diagram at for , and . Note that our values of for a 22 cluster match the ones found in larger cluster studies with comparable Maier and Scalapino (2018). The case suffered from severe sign problems but is still useful to capture the evolution of as a function of . Within the Hubbard model, pseudogap formation arises from singlet formation due to superexchange, which we retrieve in this figure Haule and Kotliar (2007); Sordi et al. (2012a). Indeed, these correlations are well described by the - limit of the Hubbard model at strong interaction and low doping, with superexchange . Going from to , does not actually decrease by a factor of , because the interaction strength is not large enough for the - limit to be valid. However, does decrease by a factor of between and . In other words, scales with Haule et al. (2002, 2003); Stanescu and Phillips (2003) for large values of , confirming short-range correlations due to superexchange as the origin of the pseudogap. Furthermore, the order of magnitude of at agrees with the experimental values reported in Refs. Johnston (1989); Nakano et al. (1994); Curro et al. (1997) for YBCO and LSCO. If we assume that the value of the Néel temperature is a measure of , this is consistent with the experimental slope of the lines of YBCO and LSCO cited in Ref. Cyr-Choinière et al. (2018). Putting aside in Fig. 1 (left), since sign problems appear at low temperature, we find at intermediate doping that the line drops suddenly at a critical doping : the smaller the value of , the larger the drop of . The increase of with follows the trend found for the location of the Sordi transition Fratino et al. (2016a).
At finite temperature in the presence of interactions, Fig. 1 also shows dashed lines in the - plane that indicate the maximum of the single-particle local density of states at the Fermi level. This is not the usual non-interacting van Hove singularity, but it is adiabatically connected to it. We see on the figure that the dashed lines (the van Hove lines ) are pushed to higher doping compared to the location of the van Hove singularity in the non-interacting case (arrows). Consequently, the experimental conjecture Eq. (1) for seems, in our calculations, to extend to since .
The location of the zone of maximum of entropy in the - plane, represented by a colored rectangle, is also pushed by interactions to higher doping. The displacement of the zone of maximum entropy towards higher doping with increasing would be consistent with its coincidence with the end of the coexistence region of the Sordi transition Sordi et al. (2011), whose also increases with . This coindence has however been proven only for .
It seems paradoxical that with increasing the line extends to higher doping but appears at lower temperatures. This comes from antagonistic effects of on singlet formation. On the one hand, local magnetic moments increase with , leading to better-defined singlets at low temperature. On the other hand, the decrease of with increasing makes these singlets less resilient to thermal fluctuations.
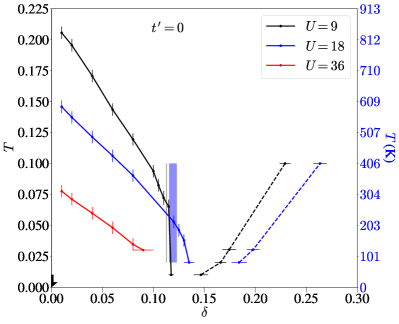
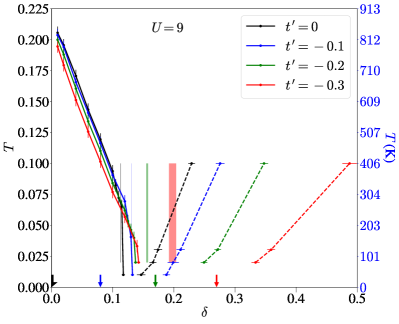
Fig. 1 (right) shows the normal-state phase diagram at for , , and . The dependence on of follows the trend found for the location of the Sordi transition (see Supplemental Material of Ref. Fratino et al. (2016a)). Remarkably, two main experimental observations regarding and are also found for and in this figure. Indeed, one experiment Cyr-Choinière et al. (2018) finds that changing the value of through chemical pressure does not affect the initial slope of the line at low doping but monotonically moves towards higher doping with increasing values of . Moreover, another experiment Doiron-Leyraud et al. (2017) shows that applied pressure pushes to lower doping while calculations in the same paper Doiron-Leyraud et al. (2017) find a concomitant decrease of .
Interactions push the van Hove line to higher doping than the non-interacting van Hove singularity, as in the case. The effect of at fixed agrees with Ref. Wu et al. (2018):
the larger , the less pushes the van Hove line away from the non interacting case (colored arrows in Fig. 1).
This is consistent with the decreasing influence of interactions at large doping.
Besides, the experimental conjecture Eq. (1) for extends once again to as .
Finally, the zone of maximum entropy also moves towards higher doping with increasing .
More importantly, it is farther and farther away from both the Widom and the van Hove lines, as suggested in yet unpublished work Sordi .
III.2 Critical scaling of the specific heat
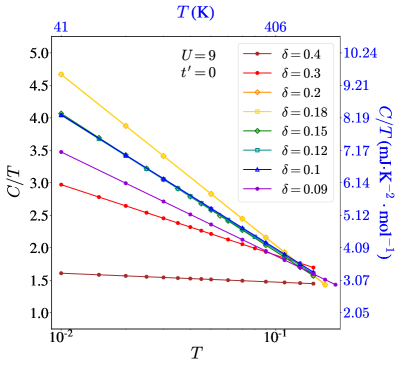
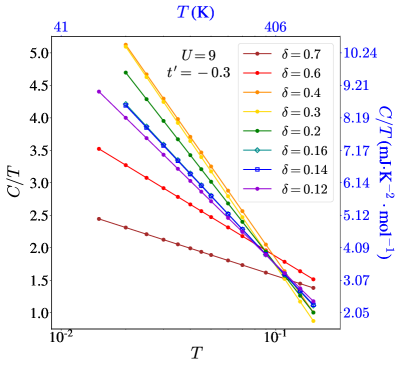
Let us finally discuss critical scaling of the specific heat. We computed the total energy Fratino et al. (2016a) and fitted it with . The specific heat is the derivative of the fitted total energy with respect to temperature, yielding , presented on a semi-log plot in Fig. 2 for , (left) and for , (right). Since the goodness of the energy fit holds over a wide range of dopings, as shown in the Supplemental Material Note (1), so does the critical scaling of . A typical cuprate hopping amplitude of meV converts to a value that is of the same order as that found experimentally Michon et al. (2019). However, our lowest temperature is about K. This minimal temperature is much higher than the experimental range K to K in Ref. Michon et al. (2019) where a critical fan with a sharp peak in the doping dependence of at fixed appears. Instead, we find that at higher temperature the value of is essentially the same for a wide range of parameters around the critical point for and for that we determined from .
This observation can be understood by taking experimental studies in heavy fermions von Löhneysen (1996); Löhneysen et al. (2007) as typical examples of what is expected for the quantum critical behavior of . Heavy fermions exhibit an extremely low effective Fermi energy so that the high-temperature limit of the electronic specific heat is accessible without phonon contamination. It is found that at high temperature is indeed logarithmic and very weakly dependent on parameters. The equivalence established in Ref. Doiron-Leyraud et al. (2017) between applying pressure in experiments and decreasing in calculations enables us to establish another analogy with Refs. von Löhneysen (1996); Löhneysen et al. (2007): at a given doping, the slope of as a function of temperature on the semi-log plot becomes flatter with decreasing , like we find by comparing the two plots in Fig. 2. 333Logarithmic temperature dependence of is also found in the two-impurity Kondo problem Affleck and Ludwig (1992) where long-wavelength spin fluctuations are unimportant. The singlets that are found in the pseudogap phase of plaquette CDMFT calculations Sordi et al. (2012a); Haule and Kotliar (2007) may lead to similar behavior. When doping increases beyond the critical doping, again becomes insensitive to doping for a small doping range, reflecting the presence of the van Hove line . Upon increasing doping sufficiently, gradually becomes temperature independent, as expected in a Fermi liquid.
IV Conclusion
In summary, consistent with most earlier theoretical studies, we find that the NMR pseudogap line 444In Bi2201, the NMR Kawasaki et al. (2010) seems to coincide with as determined from ARPES and resistivity. shares many features of the experimental line Loret et al. (2017); Michon et al. (2019); Cyr-Choinière et al. (2018); Doiron-Leyraud et al. (2017); Tallon and Loram (2001); Tallon et al. (2004); Storey et al. (2007); Tallon : a) drops precipitously to zero at a doping ; b) near half-filling scales like superexchange at large ; c) Changes in the band structure modify primarly the value of and it is possible to see this effect experimentally by applying pressure; d) The doping where the van Hove line extrapolates at low temperature, , seems to satisfy the inequality Eq. (1) in the limit; e) The high-temperature specific heat is consistent with expectations for high-temperature quantum critical behavior; f) The doping where entropy is maximum is almost independent of .
Our contribution for theory is that quantum critical behavior of the electronic specific heat is connected to doped Mott-insulating behavior. Indeed, the extrapolated position of the quantum critical point seems to have the same dependence on as the Sordi transition, which is continuously connected to the Mott transition at half-filling. The critical-point temperature for the Sordi transition is known to decrease rapidly with increasing and should be investigated further.
Additional experiments on the NMR are called for to verify our observation that the line is a necessary condition for the appearance of the experimental line. That line occurs at lower temperature and is thus more sensitive to details of the Hamiltonian. Another prediction for experiment is that the doping where entropy is maximum depends strongly on band parameters, an effect that could be measured with combined specific-heat and pressure experiments.
Acknowledgments
We are grateful to S. Verret and M.-H. Julien for useful discussions, to O. Simard for help, and to Louis Taillefer for comments on the manuscript. The work of P.S. was supported by the U.S. Department of Energy, Office of Science, Basic Energy Sciences as a part of the Computational Materials Science Program. This research was undertaken thanks in part to funding from the Canada First Research Excellence Fund. This work has been supported by the Natural Sciences and Engineering Research Council of Canada (NSERC) under grant RGPIN-2014-04584, and by the Research Chair in the Theory of Quantum Materials. Simulations were performed on computers provided by the Canadian Foundation for Innovation, the Ministère de l’Éducation des Loisirs et du Sport (Québec), Calcul Québec, and Compute Canada.
References
- Alloul et al. (1989) H. Alloul, T. Ohno, and P. Mendels, Phys. Rev. Lett. 63, 1700 (1989).
- Berthier, C. et al. (1996) Berthier, C., Julien, M. H., Horvati´c, M., and Berthier, Y., J. Phys. I France 6, 2205 (1996).
- Curro et al. (1997) N. J. Curro, T. Imai, C. P. Slichter, and B. Dabrowski, Phys. Rev. B 56, 877 (1997).
- Timusk and Statt (1999) T. Timusk and B. Statt, Reports on Progress in Physics 62, 61 (1999).
- Kawasaki et al. (2010) S. Kawasaki, C. Lin, P. L. Kuhns, A. P. Reyes, and G.-q. Zheng, Phys. Rev. Lett. 105, 137002 (2010).
- Fauqué et al. (2006) B. Fauqué, Y. Sidis, V. Hinkov, S. Pailhès, C. T. Lin, X. Chaud, and P. Bourges, Phys. Rev. Lett. 96, 197001 (2006).
- Mook et al. (2008) H. A. Mook, Y. Sidis, B. Fauque, V. Baledent, and P. Bourges, Physical Review B (Condensed Matter and Materials Physics) 78, 020506 (2008).
- Mangin-Thro et al. (2015) L. Mangin-Thro, Y. Sidis, A. Wildes, and P. Bourges, Nature Communications 6, 7705 EP (2015), article.
- Daou et al. (2010) R. Daou, J. Chang, D. LeBoeuf, O. Cyr-Choiniere, F. Laliberte, N. Doiron-Leyraud, B. J. Ramshaw, R. Liang, D. A. Bonn, W. N. Hardy, and L. Taillefer, Nature 463, 519 (2010).
- Shekhter et al. (2013) A. Shekhter, B. J. Ramshaw, R. Liang, W. N. Hardy, D. A. Bonn, F. F. Balakirev, R. D. McDonald, J. B. Betts, S. C. Riggs, and A. Migliori, Nature 498, 75 (2013).
- Lubashevsky et al. (2014) Y. Lubashevsky, L. Pan, T. Kirzhner, G. Koren, and N. P. Armitage, Phys. Rev. Lett. 112, 147001 (2014).
- Zhao et al. (2017) L. Zhao, C. A. Belvin, R. Liang, D. A. Bonn, W. N. Hardy, N. P. Armitage, and D. Hsieh, Nature Physics 13, 250 (2017).
- Parker et al. (2010) C. V. Parker, P. Aynajian, E. H. da Silva Neto, A. Pushp, S. Ono, J. Wen, Z. Xu, G. Gu, and A. Yazdani, Nature 468, 677–680 (2010).
- Sordi et al. (2012a) G. Sordi, P. Sémon, K. Haule, and A.-M. S. Tremblay, Scientific Reports 2 (2012a), 10.1038/srep00547.
- Note (1) An 8 site DCA calculation of the Knight shift Chen et al. (2017); Wu et al. (2018) for a smaller value of than that considered here, nevertheless gives a temperature dependence of the line quite comparable to ours.
- Sordi et al. (2010) G. Sordi, K. Haule, and A. M. S. Tremblay, Phys. Rev. Lett. 104, 226402 (2010).
- Stanescu and Phillips (2003) T. D. Stanescu and P. Phillips, Phys. Rev. Lett. 91, 017002 (2003).
- Badoux et al. (2016) S. Badoux, W. Tabis, F. Laliberté, G. Grissonnanche, B. Vignolle, D. Vignolles, J. Béard, D. A. Bonn, W. N. Hardy, R. Liang, N. Doiron-Leyraud, L. Taillefer, and C. Proust, Nature 531, 210 EP (2016).
- Laliberte et al. (2016) F. Laliberte, W. Tabis, S. Badoux, B. Vignolle, D. Destraz, N. Momono, T. Kurosawa, K. Yamada, H. Takagi, N. Doiron-Leyraud, C. Proust, and L. Taillefer, ArXiv e-prints (2016), arXiv:1606.04491 [cond-mat.supr-con] .
- Collignon et al. (2017) C. Collignon, S. Badoux, S. A. A. Afshar, B. Michon, F. Laliberté, O. Cyr-Choinière, J.-S. Zhou, S. Licciardello, S. Wiedmann, N. Doiron-Leyraud, and L. Taillefer, Phys. Rev. B 95, 224517 (2017).
- Loret et al. (2017) B. Loret, S. Sakai, S. Benhabib, Y. Gallais, M. Cazayous, M. A. Méasson, R. D. Zhong, J. Schneeloch, G. D. Gu, A. Forget, D. Colson, I. Paul, M. Civelli, and A. Sacuto, Phys. Rev. B 96, 094525 (2017).
- Ando et al. (2004) Y. Ando, Y. Kurita, S. Komiya, S. Ono, and K. Segawa, Phys. Rev. Lett. 92, 197001 (2004).
- Mackenzie et al. (1996) A. P. Mackenzie, S. R. Julian, D. C. Sinclair, and C. T. Lin, Phys. Rev. B 53, 5848 (1996).
- Michon et al. (2019) B. Michon, C. Girod, S. Badoux, J. Kacmarcík, Q. Ma, M. Dragomir, H. A. Dabkowska, B. D. Gaulin, J.-S. Zhou, S. Pyon, T. Takayama, H. Takagi, S. Verret, N. Doiron-Leyraud, C. Marcenat, L. Taillefer, and T. Klein, Nature 567, 218 (2019).
- Cyr-Choinière et al. (2018) O. Cyr-Choinière, R. Daou, F. Laliberté, C. Collignon, S. Badoux, D. LeBoeuf, J. Chang, B. J. Ramshaw, D. A. Bonn, W. N. Hardy, R. Liang, J.-Q. Yan, J.-G. Cheng, J.-S. Zhou, J. B. Goodenough, S. Pyon, T. Takayama, H. Takagi, N. Doiron-Leyraud, and L. Taillefer, Phys. Rev. B 97, 064502 (2018).
- Doiron-Leyraud et al. (2017) N. Doiron-Leyraud, O. Cyr-Choinière, S. Badoux, A. Ataei, C. Collignon, A. Gourgout, S. Dufour-Beauséjour, F. F. Tafti, F. Laliberté, M.-E. Boulanger, M. Matusiak, D. Graf, M. Kim, J.-S. Zhou, N. Momono, T. Kurosawa, H. Takagi, and L. Taillefer, Nature Communications 8, 2044 (2017).
- Kondo et al. (2004) T. Kondo, T. Takeuchi, T. Yokoya, S. Tsuda, S. Shin, and U. Mizutani, Journal of Electron Spectroscopy and Related Phenomena 137-140, 663 (2004), iCESS-9 Proceedings of the 9th International Conference on Electronic Spectroscopy and Structure.
- Chang et al. (2008) J. Chang, M. Shi, S. Pailhés, M. Månsson, T. Claesson, O. Tjernberg, A. Bendounan, Y. Sassa, L. Patthey, N. Momono, M. Oda, M. Ido, S. Guerrero, C. Mudry, and J. Mesot, Phys. Rev. B 78, 205103 (2008).
- Yoshida et al. (2009) T. Yoshida, M. Hashimoto, S. Ideta, A. Fujimori, K. Tanaka, N. Mannella, Z. Hussain, Z.-X. Shen, M. Kubota, K. Ono, S. Komiya, Y. Ando, H. Eisaki, and S. Uchida, Phys. Rev. Lett. 103, 037004 (2009).
- Matt et al. (2015) C. E. Matt, C. G. Fatuzzo, Y. Sassa, M. Månsson, S. Fatale, V. Bitetta, X. Shi, S. Pailhès, M. H. Berntsen, T. Kurosawa, M. Oda, N. Momono, O. J. Lipscombe, S. M. Hayden, J.-Q. Yan, J.-S. Zhou, J. B. Goodenough, S. Pyon, T. Takayama, H. Takagi, L. Patthey, A. Bendounan, E. Razzoli, M. Shi, N. C. Plumb, M. Radovic, M. Grioni, J. Mesot, O. Tjernberg, and J. Chang, Phys. Rev. B 92, 134524 (2015).
- Tallon and Loram (2001) J. Tallon and J. Loram, Physica C: Superconductivity 349, 53 (2001).
- Tallon et al. (2004) J. Tallon, T. Benseman, G. Williams, and J. Loram, Physica C: Superconductivity 415, 9 (2004).
- Storey et al. (2007) J. G. Storey, J. L. Tallon, G. V. M. Williams, and J. W. Loram, Phys. Rev. B 76, 060502 (2007).
- (34) J. L. Tallon, “2015 Gordon Conference poster: The pseudogap phase diagram in cuprate superconductors,” Unpublished.
- Chakraborty et al. (2010) S. Chakraborty, D. Galanakis, and P. Phillips, Phys. Rev. B 82, 214503 (2010).
- Garg et al. (2011) A. Garg, B. S. Shastry, K. B. Dave, and P. Phillips, New Journal of Physics 13, 083032 (2011).
- Grissonnanche et al. (2014) G. Grissonnanche, O. Cyr-Choinière, F. Laliberté, S. René de Cotret, A. Juneau-Fecteau, S. Dufour-Beauséjour, M.-È. Delage, D. LeBoeuf, J. Chang, B. J. Ramshaw, D. A. Bonn, W. N. Hardy, R. Liang, S. Adachi, N. E. Hussey, B. Vignolle, C. Proust, M. Sutherland, S. Krämer, J.-H. Park, D. Graf, N. Doiron-Leyraud, and L. Taillefer, Nature Communications 5, 3280 EP (2014), article.
- Sordi et al. (2012b) G. Sordi, P. Sémon, K. Haule, and A.-M. S. Tremblay, Phys. Rev. Lett. 108, 216401 (2012b).
- Chen et al. (2013) K.-S. Chen, Z. Y. Meng, S.-X. Yang, T. Pruschke, J. Moreno, and M. Jarrell, Phys. Rev. B 88, 245110 (2013).
- Gull et al. (2013) E. Gull, O. Parcollet, and A. J. Millis, Phys. Rev. Lett. 110, 216405 (2013).
- Nakano et al. (1994) T. Nakano, M. Oda, C. Manabe, N. Momono, Y. Miura, and M. Ido, Phys. Rev. B 49, 16000 (1994).
- Gutzwiller (1963) M. C. Gutzwiller, Phys. Rev. Lett. 10, 159 (1963).
- Hubbard (1963) J. Hubbard, Proceedings of the Royal Society of London A: Mathematical, Physical and Engineering Sciences 276, 238 (1963).
- Kanamori (1963) J. Kanamori, Progress of Theoretical Physics 30, 275 (1963).
- Maier et al. (2005) T. Maier, M. Jarrell, T. Pruschke, and M. H. Hettler, Rev. Mod. Phys. 77, 1027 (2005).
- Kotliar et al. (2006) G. Kotliar, S. Y. Savrasov, K. Haule, V. S. Oudovenko, O. Parcollet, and C. A. Marianetti, Reviews of Modern Physics 78, 865 (2006).
- Tremblay et al. (2006) A.-M. S. Tremblay, B. Kyung, and D. Sénéchal, Low Temp. Phys. 32, 424 (2006).
- Hirsch and Fye (1986) J. E. Hirsch and R. M. Fye, Phys. Rev. Lett. 56, 2521 (1986).
- Rubtsov et al. (2005) A. N. Rubtsov, V. V. Savkin, and A. I. Lichtenstein, Phys. Rev. B 72, 035122 (2005).
- Gull et al. (2011) E. Gull, A. J. Millis, A. I. Lichtenstein, A. N. Rubtsov, M. Troyer, and P. Werner, Rev. Mod. Phys. 83, 349 (2011).
- Werner and Millis (2006) P. Werner and A. J. Millis, Phys. Rev. B 74, 155107 (2006).
- Werner et al. (2006) P. Werner, A. Comanac, L. de’ Medici, M. Troyer, and A. J. Millis, Phys. Rev. Lett. 97, 076405 (2006).
- Haule (2007) K. Haule, Phys. Rev. B 75, 155113 (2007).
- Gull et al. (2007) E. Gull, P. Werner, A. Millis, and M. Troyer, Phys. Rev. B 76, 235123 (2007).
- Gull et al. (2008) E. Gull, P. Werner, O. Parcollet, and M. Troyer, EPL (Europhysics Letters) 82, 57003 (2008).
- Lichtenstein and Katsnelson (2000) A. I. Lichtenstein and M. I. Katsnelson, Phys. Rev. B 62, R9283 (2000).
- Jarrell et al. (2001) M. Jarrell, T. Maier, M. H. Hettler, and A. N. Tahvildarzadeh, EPL (Europhysics Letters) 56, 563 (2001).
- Civelli et al. (2005) M. Civelli, M. Capone, S. S. Kancharla, O. Parcollet, and G. Kotliar, Phys. Rev. Lett. 95, 106402 (2005).
- Macridin et al. (2006) A. Macridin, M. Jarrell, T. Maier, P. R. C. Kent, and E. D’Azevedo, Phys. Rev. Lett. 97, 036401 (2006).
- Kyung et al. (2006) B. Kyung, S. S. Kancharla, D. Sénéchal, A.-M. S. Tremblay, M. Civelli, and G. Kotliar, Physical Review B 73, 165114 (2006).
- Haule and Kotliar (2007) K. Haule and G. Kotliar, Physical Review B (Condensed Matter and Materials Physics) 76, 104509 (2007).
- Ferrero et al. (2009) M. Ferrero, P. S. Cornaglia, L. De Leo, O. Parcollet, G. Kotliar, and A. Georges, Phys. Rev. B 80, 064501 (2009).
- Gull et al. (2009) E. Gull, O. Parcollet, P. Werner, and A. J. Millis, Phys. Rev. B 80, 245102 (2009).
- Sakai et al. (2009) S. Sakai, Y. Motome, and M. Imada, Phys. Rev. Lett. 102, 056404 (2009).
- Werner et al. (2009) P. Werner, E. Gull, O. Parcollet, and A. J. Millis, Phys. Rev. B 80, 045120 (2009).
- Gull et al. (2010) E. Gull, M. Ferrero, O. Parcollet, A. Georges, and A. J. Millis, Phys. Rev. B 82, 155101 (2010).
- Gunnarsson et al. (2015) O. Gunnarsson, T. Schäfer, J. P. F. LeBlanc, E. Gull, J. Merino, G. Sangiovanni, G. Rohringer, and A. Toschi, Phys. Rev. Lett. 114, 236402 (2015).
- Haule et al. (2002) K. Haule, A. Rosch, J. Kroha, and P. Wölfle, Phys. Rev. Lett. 89, 236402 (2002).
- Haule et al. (2003) K. Haule, A. Rosch, J. Kroha, and P. Wölfle, Phys. Rev. B 68, 155119 (2003).
- Bittner et al. (2018) N. Bittner, D. Golež, H. U. R. Strand, M. Eckstein, and P. Werner, Phys. Rev. B 97, 235125 (2018).
- Mikelsons et al. (2009) K. Mikelsons, E. Khatami, D. Galanakis, A. Macridin, J. Moreno, and M. Jarrell, Phys. Rev. B 80, 140505 (2009).
- Vidhyadhiraja et al. (2009) N. S. Vidhyadhiraja, A. Macridin, C. Şen, M. Jarrell, and M. Ma, Phys. Rev. Lett. 102, 206407 (2009).
- Maier et al. (2016) T. A. Maier, P. Staar, V. Mishra, U. Chatterjee, J. C. Campuzano, and D. J. Scalapino, Nature Communications 7, 11875 EP (2016), article.
- Chen et al. (2017) X. Chen, J. P. F. LeBlanc, and E. Gull, Nature Communications 8, 14986 EP (2017), article.
- Scalapino et al. (1986) D. J. Scalapino, E. Loh, and J. E. Hirsch, Phys. Rev. B 34, 8190 (1986).
- Maier et al. (2008) T. A. Maier, D. Poilblanc, and D. J. Scalapino, Physical Review Letters 100, 237001 (2008).
- Dahm et al. (2009) T. Dahm, V. Hinkov, S. V. Borisenko, A. A. Kordyuk, V. B. Zabolotnyy, J. Fink, B. Büchner, D. J. Scalapino, W. Hanke, and B. Keimer, Nature Physics 5, 217 EP (2009).
- Kyung et al. (2009) B. Kyung, D. Sénéchal, and A.-M. S. Tremblay, Phys. Rev. B 80, 205109 (2009).
- Scalapino (2012) D. J. Scalapino, Rev. Mod. Phys. 84, 1383 (2012).
- Nishiyama et al. (2013) S. Nishiyama, K. Miyake, and C. M. Varma, Phys. Rev. B 88, 014510 (2013).
- Sénéchal et al. (2013) D. Sénéchal, A. G. R. Day, V. Bouliane, and A.-M. S. Tremblay, Phys. Rev. B 87, 075123 (2013).
- Reymbaut et al. (2016) A. Reymbaut, M. Charlebois, M. F. Asiani, L. Fratino, P. Sémon, G. Sordi, and A.-M. S. Tremblay, Phys. Rev. B 94, 155146 (2016).
- Wu et al. (2018) W. Wu, M. S. Scheurer, S. Chatterjee, S. Sachdev, A. Georges, and M. Ferrero, Phys. Rev. X 8, 021048 (2018).
- Bragança et al. (2018) H. Bragança, S. Sakai, M. C. O. Aguiar, and M. Civelli, Phys. Rev. Lett. 120, 067002 (2018).
- Sordi et al. (2011) G. Sordi, K. Haule, and A.-M. S. Tremblay, Phys. Rev. B 84, 075161 (2011).
- Fratino et al. (2016a) L. Fratino, P. Sémon, G. Sordi, and A.-M. S. Tremblay, Scientific Reports 6, 22715 EP (2016a), article.
- Xu et al. (2005) L. Xu, P. Kumar, S. V. Buldyrev, S.-H. Chen, P. H. Poole, F. Sciortino, and H. E. Stanley, Proc. Nat. Acad. Sci. USA 102, 16558 (2005).
- Oike et al. (2015) H. Oike, K. Miyagawa, H. Taniguchi, and K. Kanoda, Phys. Rev. Lett. 114, 067002 (2015).
- Sordi et al. (2013) G. Sordi, P. Sémon, K. Haule, and A.-M. S. Tremblay, Phys. Rev. B 87, 041101 (2013).
- Fratino et al. (2016b) L. Fratino, P. Sémon, G. Sordi, and A.-M. S. Tremblay, Phys. Rev. B 93, 245147 (2016b).
- Kotliar et al. (2001) G. Kotliar, S. Y. Savrasov, G. Pálsson, and G. Biroli, Phys. Rev. Lett. 87, 186401 (2001).
- Sakai et al. (2012) S. Sakai, G. Sangiovanni, M. Civelli, Y. Motome, K. Held, and M. Imada, Phys. Rev. B 85, 035102 (2012).
- Note (2) In the Supplemental Material we explain how we find and from the magnetic susceptibility, how we do analytic continuation to find the van Hove line , how we use a Maxwell relation to find the location of the maximum of entropy and how we find the specific heat. We also explain how error bars are estimated.
- Maier and Scalapino (2018) T. A. Maier and D. J. Scalapino, ArXiv e-prints (2018), arXiv:1810.10043 [cond-mat.supr-con] .
- Johnston (1989) D. C. Johnston, Phys. Rev. Lett. 62, 957 (1989).
- (96) G. Sordi, Unpublished.
- von Löhneysen (1996) H. von Löhneysen, Journal of Physics: Condensed Matter 8, 9689 (1996).
- Löhneysen et al. (2007) H. v. Löhneysen, A. Rosch, M. Vojta, and P. Wölfle, Rev. Mod. Phys. 79, 1015 (2007).
- Note (3) Logarithmic temperature dependence of is also found in the two-impurity Kondo problem Affleck and Ludwig (1992) where long-wavelength spin fluctuations are unimportant. The singlets that are found in the pseudogap phase of plaquette CDMFT calculations Sordi et al. (2012a); Haule and Kotliar (2007) may lead to similar behavior.
- Note (4) In Bi2201, the NMR Kawasaki et al. (2010) seems to coincide with as determined from ARPES and resistivity.
- Affleck and Ludwig (1992) I. Affleck and A. W. W. Ludwig, Phys. Rev. Lett. 68, 1046 (1992).