11email: jimenez.carrera@inaf.it 22institutetext: Institut de Ciències del Cosmos, Universitat de Barcelona (IEEC-UB), Martí i Franquès 1, E-08028 Barcelona, Spain 33institutetext: Physics and Astronomy Department Galileo Galilei, University of Padova, Vicolo dell’Osservatorio 3, I-35122, Padova, Italy 44institutetext: INFN-Padova, Via Marzolo 8, I-35131 Padova, Italy 55institutetext: Institut für Astro- und Teilchenphysik, Universität Innsbruck, Technikerstrasse 25/8, A-6020, Innsbruck, Austria 66institutetext: INAF-Osservatorio di Astrofisica e Scienza dello Spazio, via P. Gobetti 93/3, 40129 Bologna, Italy 77institutetext: Instituto de Astrofísica e Cincias do Espaço, Universidade do Porto, CAUP, Rua das Estrelas, 4150-762 Porto,Portugal 88institutetext: Observatorio de Calar Alto, Sierra de los Filabres, E-04550-Gérgal (Almería), Spain 99institutetext: Centro de Astrobiología (INTA-CSIC), Departamento de Astrofísica. P.O. Box 78, E-28691, Villanueva de la Cañada, Madrid, Spain; Spanish Virtual Observatory
The extended halo of NGC 2682 (M 67)
Abstract
Context. NGC 2682 is a nearby open cluster, approximately 3.5 Gyr old. Dynamically, most open clusters should dissolve on shorter timescales, of 1 Gyr. Having survived until now, NGC 2682 was likely much more massive in the past, and is bound to have an interesting dynamical history.
Aims. We investigate the spatial distribution of NGC 2682 stars to constrain its dynamical evolution, especially focusing on the marginally bound stars in the cluster outskirts.
Methods. We use Gaia DR2 data to identify NGC 2682 members up to a distance of 150 pc (10 degrees). Two methods (Clusterix and UPMASK) are applied to this end. We estimate distances to obtain three-dimensional stellar positions using a Bayesian approach to parallax inversion, with an appropriate prior for star clusters. We calculate the orbit of NGC 2682 using the GRAVPOT16 software.
Results. The cluster extends up to 200′ (50 pc) which implies that its size is at least twice as previously believed. This exceeds the cluster Hill sphere based on the Galactic potential at the distance of NGC 2682.
Conclusions. The extra-tidal stars in NGC 2682 may originate from external perturbations such as disk shocking or dynamical evaporation from two-body relaxation. The former origin is plausible given the orbit of NGC 2682, which crossed the Galactic disk Myr ago.
Key Words.:
Astrometry – Galaxy: disk – open clusters and associations: individual: NGC 26821 Introduction
The dynamical evolution of a stellar cluster is strongly affected by internal collisional dynamics, i.e. two-body gravitational encounters between stars (see Spitzer, 1987, for an in-depth discussion in the case of globular star clusters), stellar-wind mass loss, and external interactions such as encounters with molecular clouds (Spitzer, 1958; Gieles et al., 2009) or Galactic disk and spiral arms (Binney & Tremaine, 1987). These phenomena modify the cluster structure and internal distribution of the stars along with its lifetime and eventually bring the cluster to dissolution. In fact, they are so effective that dynamical models predict that a cluster with the typical mass of a bound open cluster (OC), M⊙, would be dissolved in a timescale of Gyr (see e.g. Baumgardt & Makino, 2003; Lamers et al., 2005; Bastian & Gieles, 2008).
However, about 20% of the known OCs have ages older than 1 Gyr (Dias et al., 2002; Kharchenko et al., 2013). Although they are a minority, they are key to investigate the dynamical evolution of clusters, and the balance among self gravity, internal dynamics, and external tidal forces. These old OCs have several features that differentiate them from the bulk of the OCs population. They are systematically more massive than the younger bound clusters. In particular, although these clusters are unambiguously related to the Galactic disk because of their age and chemical composition, they are also often found at high altitude above the Galactic plane, away from the disk’s disruptive influence. Even though, strictly speaking, it would be hard to exclude that that some cluster have been acreeted from external galaxies in merging processes.
NGC 2682 (M 67) is one of the nearest old OCs (3.6 Gyr, Bossini et al., 2019) located at about 860 pc from the Sun (Cantat-Gaudin et al., 2018a) to which it is quite similar in terms of age and initial chemical composition (e.g. Liu et al., 2016), to the point that it has long been debated whether the Sun might actually have originated from NGC 2682 (see Pichardo et al., 2012, and references therein). Evidence of substantial dynamical evolution in this cluster has been reported by several authors, such as the existence of mass segregation (e.g. Fan et al., 1996; Balaguer-Núñez et al., 2007; Bonatto & Bica, 2003; Davenport & Sandquist, 2010; Geller et al., 2015; Gao, 2018) or an elongated halo roughly aligned with the cluster proper motion (Davenport & Sandquist, 2010). In fact dynamical simulations of this cluster suggest that it initially was times more massive (Hurley et al., 2005).
The astrometric information provided by the second data release of the Gaia mission, Gaia DR2 (Gaia Collaboration et al., 2016, 2018b) has proven a valuable tool to investigate the extra-tidal regions of several OCs in the solar neighborhood. Tidal tails have been reveled in the Hyades (Melotte 25 Meingast & Alves, 2019; Röser et al., 2019), Coma Berenices (Melotte 111 Fürnkranz et al., 2019), and Praesepe (NGC 2632 Röser & Schilbach, 2019) open clusters. All of them with ages younger than 1 Gyr (e.g. Bossini et al., 2019). However, hints of the existence of cluster member beyond the tidal radius have also been reported around the cluster Ruprecht 147 (Yeh et al., 2019) with an age older than 1 Gyr (e.g. Kharchenko et al., 2013).
In this paper we studied the current dynamical status of NGC 2682 using Gaia DR2. The observational material utilized in this paper is presented in Sect. 2. The obtained density profile is discussed in Sect. 3. The 3D spatial distribution is derived in Sect. 4 using a Bayesian approach to parallax inversion. Finally, in Sect. 5 we draw conclusions, showing that NGC 2682 is more extended than expected and that its outer envelope of extra-tidal stars may be the result of disk shocking.
2 The data
Gaia DR2 provides -parameter astrometric solution, i.e. positions ( and ), proper motions (, ), and parallaxes () plus magnitudes in three photometric bands (, and ) for more than 1.3 billion sources, and radial velocities (RV) for more than 7 million stars (Gaia Collaboration et al., 2018b; Katz et al., 2019; Lindegren et al., 2018). We study the data from Gaia DR2 in a radius of 10 deg ( pc) from the centre of NGC 2698 as determined by Cantat-Gaudin et al. (2018a): =132846 and =11814. We follow the recommendations by Arenou et al. (2018), Lindegren et al. (2018, eqs. C.1 and C.2) and Gaia DR2 kown-issues cosmos webpage111https://www.cosmos.esa.int/web/gaia/dr2-known-issues for an astrometrically clean subset. We also limit our analysis to those objects with low parallax uncertainties. The uncertainty in parallax depends on the signal-to-noise ratio, which is correlated with magnitude, but also on the fact that the star is a binary. Therefore we rejected those stars with error in parallaxes larger than two times the typical error at that magnitude. Finally, we constrain our analysis to those stars with magnitude brighter than 18 mag to avoid problems with the completeness of the sample at fainter magnitudes. We have not attempted to use the radial velocities in our analysis because Gaia only provides radial velocities for the very bright objects (12, see Katz et al., 2019; Soubiran et al., 2018) and other studies available in the literature (e.g. Geller et al., 2015) cover areas smaller than that explored in this work.
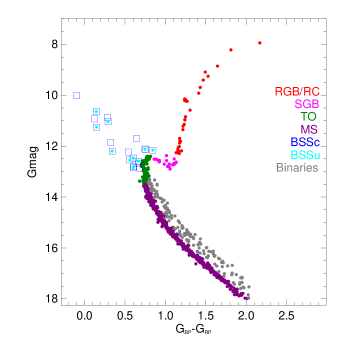
We used two different methods in order to determine the membership probabilities: UPMASK (Unsupervised Photometric Membership Assignment in Stellar Clusters; Krone-Martins & Moitinho, 2014) and Clusterix222Available at http://clusterix.cab.inta-csic.es/clusterix/ (Balaguer-Núñez et al., 2017) codes. Although UPMASK was originally developed to handle photometric data it can be also applied to astrometric data (see the discussion in Cantat-Gaudin et al., 2018b). UPMASK assigns the membership probabilities on the basis that member stars must share common properties in , , and space and are more concentrated in - plane than a random distribution (see Cantat-Gaudin et al., 2018b, for details). On the other hand, Clusterix performs an empirical determination of the field and cluster frequency functions in proper motions (, ) by comparing two areas: the cluster core and one far enough to represent the field population in the cluster area (see Appendix A for details). For UPMASK we considered as cluster members those stars with an astrometric probability, 0.4 (Cantat-Gaudin et al., 2018a; Soubiran et al., 2018). In the case of Clusterix we selected as member candidates those objects with 0.81 following the procedure described in Appendix A, applying after an additional constrain in . Clusterix provides a slightly larger number of members than UPMASK. Because there is no clear reason to prefer one method over the other, we selected those objects for which both methods agree in labelling them as members. Finally, we fine-tuned the sample on the basis of the positions in the color-magnitude diagram: main-sequence (MS), turn-off (TO), sub giant branch (SGB), red giant branch (RGB), and red clump (RC). Basically, we used the objects inside a radius of 25′ to define the regions used for this purpose (Fig 1). After all this procedure our sample is formed by 808 objects inside a radius of 150 pc. Following the same procedure we have selected stars redward of the main-sequence in the expected location of the binary sequence. In total there are 144 stars in this region (grey points in Fig. 1).
There are also several stars above the main-sequence turn-off known as blue straggler stars (BSSs, see Fig 1). The formation of these objects is still not well understood but the proposed scenarios include mass transfer or mergers in close binary systems (e.g. McCrea, 1964) or collisions between single stars or multiple systems that lead to a merger (e.g. Hills & Day, 1976). They are key particles to investigate the internal dynamics because they are typically located in the central regions, probably as a consequence of dynamical friction (e.g. Mapelli et al., 2004). According to Geller et al. (2015, and references therein) there are 25 BSS candidates in this cluster (see Table 1). One of these stars, S 1082, is not present in the Gaia DR2 catalogue. This is a triple system which includes a RS CVn-type eclipsing binary (Belloni et al., 1998). Both Clusterix and UPMASK methods yield very low membership probabilities for nine of these stars. Two of them have been discarded on the basis of their radial velocities and the rest are binaries according to Geller et al. (2015). Finally we get a list with eleven BSS candidates with high membership probabilities for the two methods: two of them are new findings of this work in the external regions (see Sect. 3), eight had already been studied by Geller et al. (2015), and the last star, S 1053 is a double-lined spectroscopy binary according to Geller et al. (2015, see Table 1). Seven of the objects in common with Geller et al. (2015) were classified as “single members”, two were marked as “binary likely member” one is the double-lined spectroscopy binary S 1053. The remaining eight BSS candidates has a high membership probability for Clusterix but not for UPMASK. Five of them are labelled by Geller et al. (2015) as “binary member” or “binary likely member”. In principle this can be explained by the fact that UPMASK takes into account the uncertainties in the Gaia DR2 astrometric parameters which in principle may be larger for binaries. There is no additional information for the other three previously unstudied objects in the external regions of the cluster. Since there is no additional reason to prefer one over the other, we are going to analise the Clusterix and UPMASK BSS samples independently (BSSc and BSSu, respectively).
The stellar sample used in this work, including stellar identification, coordinates and membership probabilities derived by both UPMASK and Clusterix is only available in electronic form at the CDS.
| IDa | IDb | Source_id | distance | Class.c | Clusterix | UPMASK | Comments |
|---|---|---|---|---|---|---|---|
| 1006 | S1066 | 604921202767814528 | 0.05 | (BL)M | M | M | SB1,RR,BSS |
| 1007 | S1284 | 604918213470568576 | 0.06 | BM | NM | NM | SB1,RR,EX Cnc,PV,BSS |
| 1010 | S977 | 604911478961895424 | 0.07 | (BL)M | M | NM | RR,BSS,SB1 |
| 1017 | S1466 | 604918831945837312 | 0.14 | (S)N | NM | NM | RR,CX109 |
| 1020 | S751 | 604914189085426560 | 0.16 | SM | M | M | |
| 1025 | S1195 | 604896566835438464 | 0.20 | BM | M | NM | SB1,RR,BSS |
| 1026 | S1434 | 604903713660959488 | 0.21 | (BL)M | M | M | SB1,RR,BSS |
| 2007 | S984 | 604911337227185920 | 0.05 | SM | M | NM | |
| 2008 | S1072 | 604921374566321920 | 0.06 | BM | NM | NM | SB1,X37,CX24,YG |
| 2009 | S1082 | 0.08 | BM | SB2,triple,ES Cnc,X4,CX3,PV,BSS | |||
| 2011 | S968 | 604910310730777472 | 0.08 | SM | M | M | PV?,BSS |
| 2013 | S1267 | 604918591427681024 | 0.10 | BM | M | NM | SB1,RR,BSS |
| 2015 | S792 | 604921958681906176 | 0.12 | SM | M | M | |
| 2068 | S277 | 604984665204470016 | 0.56 | BM | NM | NM | SB1 |
| 3005 | S1263 | 604917835513456512 | 0.04 | SM | M | M | PV,BSS |
| 3009 | S1273 | 604917934296937344 | 0.07 | SM | M | M | |
| 3010 | S975 | 604911268507711232 | 0.07 | BM | NM | NM | SB1,RR,BSS |
| 3013 | S752 | 604911135364519808 | 0.10 | BM | NM | NM | SB1,RR,PV?,BSS |
| 4003 | S1036 | 604918041671889792 | 0.02 | (BL)M | M | NM | SB1,RR,W UMa,EV Cnc,X45,CX19,PV |
| 4006 | S1280 | 604918179110923520 | 0.05 | (BL)M | M | M | SB1,RR,EW Cnc,PV,BSS |
| 5005 | S997 | 604917285757663872 | 0.03 | BM | NM | NM | SB1,CX95,BSS |
| 5071 | S145 | 598958684353074048 | 0.59 | SN | NM | NM | |
| 6038 | S2226 | 604997206508853632 | 0.31 | SM | M | M | BSS |
| 8006 | S2204 | 604917285757665920 | 0.04 | SM | M | M | |
| 9005 | S1005 | 604917560635575808 | 0.04 | BM | NM | NM | SB1 |
| 602049342819274240 | 1.19 | M | M | ||||
| 3006 | S1053 | 604920923594172928 | 0.05 | BM | M | M | SB2 |
| 578071536838119168 | 8.85 | M | M | ||||
| 585923389890240128 | 9.37 | M | NM | ||||
| 601873116017045376 | 2.24 | M | NM | ||||
| 582587853864423040 | 7.04 | M | NM |
3 Radial density profile
The radial density profile is a basic tool to investigate the spatial distribution of the cluster stellar populations and their extension. To do that we have calculated the mean stellar surface density in concentric rings as where is the number of stars in the ring with inner and outer radius and , respectively. For this purpose we have used only the stars along the cluster sequence, excluding BSS candidates and binaries. The density uncertainty in each ring was estimated assuming Poisson statistics.
The radial density profile obtained is shown in Fig. 2. The stellar density decrease slowly with radius in the inner 30′. After this there is a steeper decrease till 150′. From there of the slope slows down but it does not get flattened since there are still members at larger distances which are not shown in the figure for clarity. The first conclusion is that there are member stars at distances larger than 100′ (25 pc) from its centre. In fact a preliminary analysis of the Gaia DR2 sample showed that the cluster extends at least beyond 60′ (15 pc) from its centre (Gaia Collaboration et al., 2018a). The value found here is much larger than previous determinations in the literature. From 2MASS photometry, Bonatto & Bica (2003) found that the cluster extends up to a distance of about 24′ ( pc) while Davenport & Sandquist (2010), using SDSS photometry, reported that the cluster extends to 60′ (15 pc). More recently, Gao (2018) found a limiting radius of 62′(16 pc) using also Gaia DR2 but using a different method to assign membership probabilities.
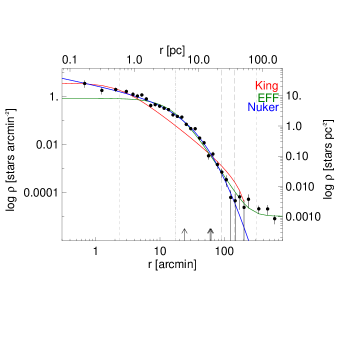
In order to characterize the resulting density profile we have fitted it with three different analytic templates: King (King, 1962); EFF (Elson et al., 1987); and Nuker (van der Marel & Anderson, 2010). Despite these expressions having been obtained empirically and not being the physical solutions of the collisionless Boltzamnn equation, they are useful to analyse the radial density profile. It is assumed that the density profile can be separated in three parts: core, bulk, and halo (or tidal debris). The different templates have been defined to focus on each of these parts. For example, King (1962) tried to reproduce the bulk of the cluster, whereas Elson et al. (1987) focused on the external tidal regions.
In the following we present the analytical templates of the density profiles investigated in this work. A more detailed explanation of each of them is provided by Küpper et al. (2010).
-
1.
The widely used King template was presented by King (1962). It is in the form:
(1) where is the background density and is the central density. The core radius is defined as the distance between the centre and the point where . The tidal radius, , is the position where , the background density. The King template therefore consists of a flat core and a bulk, but has no term for the tidal debris.
-
2.
Given that the outer parts of the density profiles of several clusters were not properly reproduced by King profiles, Elson et al. (1987), EFF, proposed this template which falls like a power-law without edge radius:
(2) where , and have the same meaning as in the case of the King template. is the slope of the template for radii much larger than and is the slope of the template for radii much larger than the core radius.
-
3.
The Nuker template was initially proposed by Lauer et al. (1995) to describe the surface brightness profiles of elliptical galaxies that showed a power-law cusp towards the centre and a logarithmic decline for radii larger than . An additional logarithmic slope from was added by van der Marel & Anderson (2010) in order to describer the surface brightness of Centauri. This template is able to fit a cluster with a non-flat core, e.g. a core-collapsed cluster or a cluster with a massive central black hole. It has the form:
(3) where , , and are as before. and are the power-law slopes inside and outside , respectively. The factor smooths the transition between the two slopes. is an additional break radii, from there off the density falls with logarithmic slope where determines the smoothness of the transition between and . van der Marel & Anderson (2010) found that the two break radii roughly correspond to the core an tidal radius of the cluster. In brief, this template consists of a flexible core, a bulk and a tidal debris.
Each analytical template has been fitted to the observed profile using a non-linear fitting with the MPFIT package (Markwardt, 2009). The best fits in each case have been plotted with different colours in Fig. 2. The King template (red line on Fig. 2), consisting of a flat core an a bulk, is only able to reproduce innermost region, 3′. Up to 60′ this template predicts less stars than observed. The EFF template (Elson et al., 1987), shown as a green line in Fig. 2, is unable to reproduce the central region, up to 10′, predicting fewer stars than actually observed. On the contrary, for larger radii this template reproduces reasonably well the number of stars observed. The modified Nuker template proposed by van der Marel & Anderson (2010) is in between of the previous ones. It is able to fit the data with a non-flat core, such as a core-collapsed cluster or a cluster with a massive central black hole. In the case of NGC 2682, this template (blue line in Fig. 2) reproduces the observed stellar density profile almost up to a radius of 200′. In the outermost radii the Nuker template predicts a continuous logarithmic fall. However, the observed profile shows a change of the slope suggesting the existence of a tidal tail or a halo.
In order to check the statistical significance of the agreement, or disagreement, of the templates and the observed density profile we have computed the of the fit in the way
where is the density predicted by template at the ring. We obtained = 6825.6, 71.5, and 2.4 for King, EFF, and Nuker templates, respectively. The values for the best King template fit are: 3.80.6 stars arcmin-1; =2402; and =319′9′. In the case of EFF template the best fit is obtained for: 0.850.01 stars arcmin-1; =1727003; and =4.230.01. Finally, the values of the best Nuker template fit are: 6.60.810-4 stars arcmin-1; =90′2′; =10.20.1; =0.570.01; =1.140.01; =144′1′; =284; and =3.10.1. The Nuker template reproduced better than the other the observed stellar density profile for NGC 2682 as the value confirms.
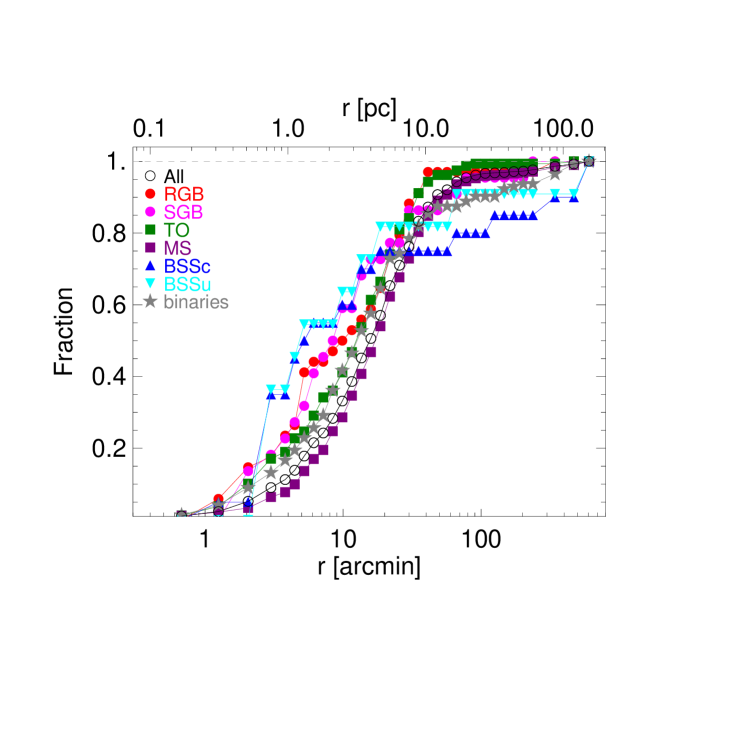
Figure 3 shows the cumulative projected radial distribution of the different NGC 2682 stellar populations normalised to the total number of the sub-population and including BSS and binaries. It is clear that the global distribution (open black circles) is mainly due to the MS stars (magenta squares) particularly in the outskirts. Turn-off objects (green squares) follow a similar trend than MS ones but they are more concentrated. While the 15% of the MS population is located inside a radius, r15%, of 56 the TO is concentrated inside 27 (see Table 2). In fact, the r15% increases when we go down in the cluster sequence. The same trend is observed for r85%, the radius that contains the 85% of the stars of a given population. The binaries (grey stars in Fig. 3) are slightly more concentrated that the MS objects as expected since they may be more massive objects. Since the mass of the star decreases as we go fainter along the cluster sequence the observed trend confirms that this cluster is mass-segregated with the most massive objects concentrated in the central regions. This behaviour has been reported in the literature by several authors (e.g. Balaguer-Núñez et al., 2007; Geller et al., 2015; Gao, 2018).
The distribution of the BSS deserves a more detailed analysis. In principle, both Clusterix, blue upward triangles in Fig. 3, and UPMASK, cyan downward triangles in Fig. 3, samples shows a similar trend. The bulk of the BSS are confined in the central regions of the clusters with the 50% of the population inside r5′ (see Table 2). There is a fraction of BSSs at large radii although they need to be confirmed as really BSS objects. Between 10′ and 100′ there are almost no BSSs. This trend with the majority of the objects in the central region and several in the outskirts with almost none of them in between has been reported in globular clusters (e.g. Ferraro et al., 1997; Lanzoni et al., 2007). The observed distribution could be due to the BSS formation mechanism as suggested by dynamical simulations (Mapelli et al., 2004). The objects in the external regions would be the result of mass transfer in primordial binaries where BSSs in the cluster core have most likely a collisional origin.
| Population | Nr Stars | r15% | r50% | r85% |
|---|---|---|---|---|
| Alla | 808 | 47 | 156 | 378 |
| RGBb | 34 | 21 | 99 | 284 |
| SGB | 22 | 23 | 84 | 294 |
| TO | 158 | 27 | 125 | 306 |
| MS | 594 | 56 | 171 | 415 |
| BSSc | 20 | 24 | 52 | 2371 |
| BSSu | 11 | 24 | 48 | 601 |
| Binaries | 144 | 34 | 127 | 405 |
4 Three-dimensional spatial distribution
In order to further investigate the outskirts of NGC 2682 we have derived its 3D spatial distribution. Without observational uncertainties on the parallaxes the individual distances could be simply obtained as the inverse of the parallax, . However, observational errors on measured parallaxes are not negligible and their direct propagation to distances through inversion may yield unacceptable results, that would translate into a strong elongation of the three-dimensional shape along the line of sight (Smith & Eichhorn, 1996; Bailer-Jones, 2015; Luri et al., 2018). To overcome this difficulty, we used a Bayesian approach to parallax inversion described in Appendix B, essentially following Bailer-Jones (2015) but with a different prior, which combines two terms: the cluster proper, or core, and a field/halo term which accounts for stars that either form a diffuse envelope around the cluster or are serendipitously placed at a similar distance and share proper motions with the cluster. The first term is represented by a normal distribution for simplicity and the second term is the exponentially decreasing volume density prior introduced by Bailer-Jones (2015). A detailed analysis of the prior that is best for clusters is out of the scope of this paper. In our case the form of the prior does not have a big impact since the main result comes without 3D information, i.e. the sky-projected positions of stars which do not depends on parallaxes but shows a small tail in the opposite direction to that of the movement (top right panel of Fig. 4). On the other hand, if the parallaxes are giving us enough information then the shape of prior does my not make a large difference unless it is very unrealistic.
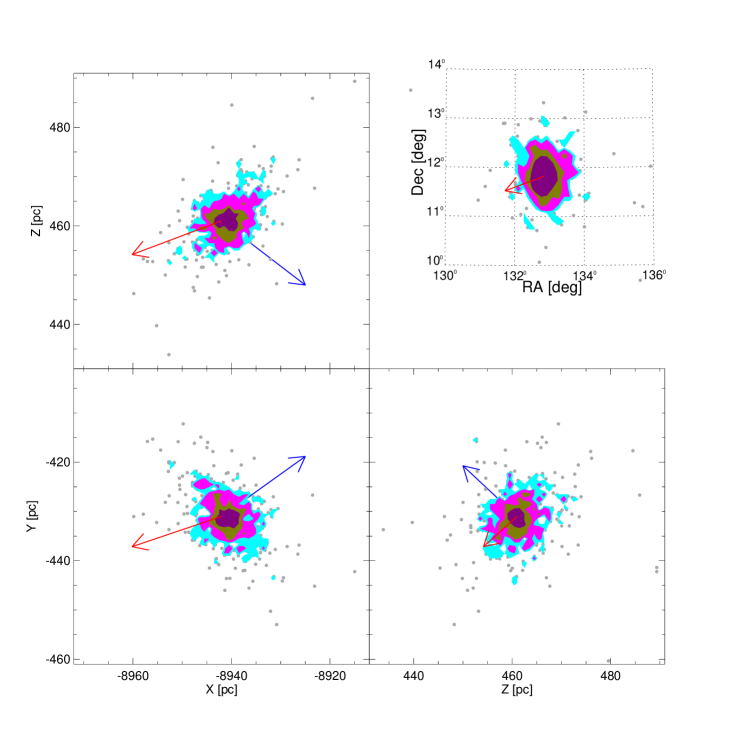
The distribution of NGC 2682 in Galactic cartesian coordinates is shown in Fig. 4. In this coordinate system, the axis points towards the Galactic centre, is positive towards the local direction of rotation in the plane of the Galaxy, and points towards the North Galactic Pole. The Galactic centre is the origin of this system with the Sun located at (-8340,0,27) pc (see Katz et al., 2019, and references therein). The spatial distribution of the stars is not isotropic in the - and -planes despite the symmetric nature of the normal term representing the cluster in the prior. This is a clear indication that the observed parallaxes have a non-negligible effect on the posterior. In the case of the -plane (top left panel), there is a clear tail almost in the direction opposite to that of the cluster’s movement. An elongation is observed in the direction of the movement in the -plane (bottom right panel). A small elongation is also observed in the -plane (bottom left panel), but in this case in the direction perpendicular to the movement.
Davenport & Sandquist (2010) using ground based photometry reported an asymmetric halo up to a distance of ′ from the cluster centre elongated roughly in-line with the proper-motion vector on the sky plane (see Fig 10 of Davenport & Sandquist, 2010). However, such elongation is not observed in our case (top right panel of Fig. 4). However, as commented before a small tail is visible in the opposite direction to that of the movement.
5 Physical interpretation
We estimate the radius of NGC 2682’s Hill sphere in the Galactic potential by approximating the latter to a point-particle potential, obtaining
| (4) |
where is the distance of NGC 2682 from the Galactic centre, the mass of NGC 2682, and the mass of the Galaxy enclosed within NGC 2682 orbit. The quantity we know with less uncertainty is , which is estimated as = 8.9 kpc from Gaia DR2 (Cantat-Gaudin et al., 2018a) On the other hand, the total mass of the Galaxy is model dependent, e.g. (McMillan, 2017) and this uncertainty is compounded by the fact that we want to consider only the mass within NGC 2682 orbit. Similarly, there is likely an uncertainty of a factor in estimates of NGC 2682 mass such as Hurley et al. (2005) which sets it at . Luckily, the dependence to the power of in Eq. 4 ensures that the uncertainty on these numbers has little effect on . To illustrate this, let us consider two different extreme scenarios:
-
•
Overestimate the enclosed Galactic mass at and underestimate NGC 2682 mass at , obtaining pc
-
•
Underestimate the enclosed Galactic mass at and overestimate NGC 2682 mass at , obtaining pc
In both cases, our observations show that M67 stars can be found further out than , suggesting that they are indeed extra-tidal. Such loosely bound stars may have originated as the consequence of internal relaxation (i.e. they may be dynamically evaporated stars) or as the effect of an external disturbance.
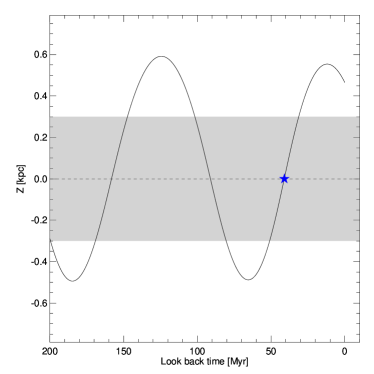
We used the software GRAVPOT16 (Fernandez-Trincado, 2017; Robin et al., 2012, 2003) to integrate the orbit of NGC 2682 back in time for 1 Gyr. We find that the last disk passage of NGC 2682 happened 40 Myr ago, as shown in Fig. 5 which plots the height over the Galactic plane as a function of time in the last 200 Myr. The shadow region shows the width of the thin disk according to Jurić et al. (2008). Note that the thick disk width is larger than the area plotted. This result is qualitatively compatible to the findings of Pichardo et al. (2012), even though the exact time of last crossing differs due to systematics introduced by the usage of different Galactic potential models and to the lack of good proper motions in the pre-Gaia era.
According to Hurley et al. (2005) the relaxation time of a realistic -body model of NGC 2682 was initially (before mass loss) 300 Myr . Even allowing for mass loss shortening the relaxation time by a factor ten, it is reasonable to assume that the effects of this disk passage have not yet been erased by dynamical relaxation, especially in the external regions of the clusters where the relaxation time is shorter than the half-light relaxation time. According to Fig. 5 NGC 2682 has had three crossing disk passages in the last 200 Myr which implies that the cluster is constantly disturbed and it will never be relaxed because the frequent passages.
The extra-tidal features we observe in M67 would thus be quite a natural result of disk shocking. This is to be confirmed quantitatively with dedicated -body models in an upcoming paper (Pasquato et al. 2019, in preparation).
An estimate of the effects of disk crossing can be obtained in the analytical approximation of an impulsive shock (Ostriker et al., 1972), where every star gets a nudge in velocity
| (5) |
where is the velocity with which the cluster crosses the disk, is the distance along the coordinate of a given star from the cluster centre, and is the density per unit surface of the Galactic disk. This corresponds, for a typical star moving with velocity relative to the cluster centre, to a relative change in energy of order
| (6) |
where is the cluster’s half-mass radius, and the total mass of the cluster. This is proportional to where is the mass enclosed, on the galactic disk, by a circumference with radius the cluster’s half-mass radius, and is the cluster’s velocity dispersion.
Based on our orbital calculations, km s-1, and a surface mass density of pc -2 (McGaugh, 2016) we obtain , which corresponds to an expansion of the virial radius of the cluster of the same quantity, i.e. . This is enough to justify the presence of a relatively large number of extratidal stars.
6 Conclusions
Two different methods, Clusterix and UPMASK have been used to assign membership probabilities to stars in the line of sight of NGC 2682 up to a distance of 150 pc (10 degrees) using the information provided by the Gaia-DR2 catalogue. Additionally, we have estimated distances to obtain three-dimensional stellar positions using a Bayesian approach to parallax inversion, with an appropriate prior for star clusters. The main results of our analysis are:
-
•
The cluster extends up to 200′ (50 pc) which implies that its size is at least twice as previously believed. This exceeds the cluster Hill sphere based on the Galactic potential at the distance of NGC 2682.
-
•
Only a template with a power-law cusp towards the centre and a logarithmic decline for larger radii is able to reproduce the observed stellar density profile. In any case, there are stars outside the tidal radius.
-
•
As reported in previous studies, we confirm that the cluster is mass-segregated with the most massive objects concentrated in the central regions.
-
•
As observed in several globular clusters the BBSs show a bimodal distribution with the majority of the object located in the core an several objects in the outskirts without anything in between. Although the objects at larger radii need to be confirmed as real BSSs.
-
•
The extra-tidal stars in NGC 2682 may originate from external perturbations such as disk shocking or dynamical evaporation from two-body relaxation. The former origin is plausible given the orbit of NGC 2682, which crossed the Galactic disk Myr ago. We plan to further investigate this scenario with direct N-body models.
Acknowledgements.
This work has made use of data from the European Space Agency (ESA) mission Gaia (https://www.cosmos.esa.int/gaia), processed by the Gaia Data Processing and Analysis Consortium (DPAC, https://www.cosmos.esa.int/web/gaia/dpac/consortium). Funding for the DPAC has been provided by national institutions, in particular the institutions participating in the Gaia Multilateral Agreement. This project has received funding from the European Union’s Horizon research and innovation programme under the Marie Skłodowska-Curie grant agreement No. This work was partly supported by the MINECO (Spanish Ministry of Economy) through grant ESP2016-80079-C2-1-R (MINECO/FEDER, UE) and MDM-2014-0369 of ICCUB (Unidad de Excelencia ’María de Maeztu’), European Community’s Seventh Framework Programme (FP7/2007-2013) under grant agreement GENIUS FP7 - 606740 and the European Commission Framework Programme Horizon 2020 Research and Innovation action under grant agreement ASTERICS 653477. Support from PREMIALE 2016 MITiC is acknowledged. Based on Clusterix 2.0 service at CAB (INTA-CSIC). DB is supported in the form of work contract FCT/MCTES through national funds and by FEDER through COMPETE2020 in connection to these grants: ;References
- Arenou et al. (2018) Arenou, F., Luri, X., Babusiaux, C., et al. 2018, A&A, 616, A17
- Bailer-Jones (2015) Bailer-Jones, C. A. L. 2015, Publications of the Astronomical Society of the Pacific, 127, 994
- Balaguer-Núñez et al. (2007) Balaguer-Núñez, L., Galadí-Enríquez, D., & Jordi, C. 2007, A&A, 470, 585
- Balaguer-Núñez et al. (2017) Balaguer-Núñez, L., Galadí-Enríquez, D., López del Fresno, M., et al. 2017, in Highlights on Spanish Astrophysics IX, ed. S. Arribas, A. Alonso-Herrero, F. Figueras, C. Hernández-Monteagudo, A. Sánchez-Lavega, & S. Pérez-Hoyos, 328–333
- Bastian & Gieles (2008) Bastian, N. & Gieles, M. 2008, in Astronomical Society of the Pacific Conference Series, Vol. 388, Mass Loss from Stars and the Evolution of Stellar Clusters, ed. A. de Koter, L. J. Smith, & L. B. F. M. Waters, 353
- Baumgardt & Makino (2003) Baumgardt, H. & Makino, J. 2003, MNRAS, 340, 227
- Belloni et al. (1998) Belloni, T., Verbunt, F., & Mathieu, R. D. 1998, A&A, 339, 431
- Binney & Tremaine (1987) Binney, J. & Tremaine, S. 1987, Galactic dynamics
- Bonatto & Bica (2003) Bonatto, C. & Bica, E. 2003, A&A, 405, 525
- Bossini et al. (2019) Bossini, D., Vallenari, A., Bragaglia, A., et al. 2019, A&A, 623, A108
- Cantat-Gaudin et al. (2018a) Cantat-Gaudin, T., Jordi, C., Vallenari, A., et al. 2018a, A&A, 618, A93
- Cantat-Gaudin et al. (2018b) Cantat-Gaudin, T., Vallenari, A., Sordo, R., et al. 2018b, A&A, 615, A49
- Davenport & Sandquist (2010) Davenport, J. R. A. & Sandquist, E. L. 2010, ApJ, 711, 559
- Dias et al. (2002) Dias, W. S., Alessi, B. S., Moitinho, A., & Lépine, J. R. D. 2002, A&A, 389, 871
- Elson et al. (1987) Elson, R. A. W., Fall, S. M., & Freeman, K. C. 1987, ApJ, 323, 54
- Fan et al. (1996) Fan, X., Burstein, D., Chen, J.-S., et al. 1996, AJ, 112, 628
- Fernandez-Trincado (2017) Fernandez-Trincado, J. G. 2017, PhD thesis
- Ferraro et al. (1997) Ferraro, F. R., Paltrinieri, B., Fusi Pecci, F., et al. 1997, A&A, 324, 915
- Fürnkranz et al. (2019) Fürnkranz, V., Meingast, S., & Alves, J. 2019, arXiv e-prints [arXiv:1902.07216]
- Gaia Collaboration et al. (2018a) Gaia Collaboration, Babusiaux, C., van Leeuwen, F., et al. 2018a, A&A, 616, A10
- Gaia Collaboration et al. (2018b) Gaia Collaboration, Brown, A. G. A., Vallenari, A., et al. 2018b, A&A, 616, A1
- Gaia Collaboration et al. (2016) Gaia Collaboration, Prusti, T., de Bruijne, J. H. J., et al. 2016, A&A, 595, A1
- Galadi-Enriquez et al. (1998) Galadi-Enriquez, D., Jordi, C., & Trullols, E. 1998, A&A, 337, 125
- Gao (2018) Gao, X. 2018, ApJ, 869, 9
- Geller et al. (2015) Geller, A. M., Latham, D. W., & Mathieu, R. D. 2015, AJ, 150, 97
- Gieles et al. (2009) Gieles, M., Portegies Zwart, S. F., & Athanassoula, E. 2009, The Effect of Giant Molecular Clouds on Star Clusters, ed. T. Richtler & S. Larsen, 375
- Hills & Day (1976) Hills, J. G. & Day, C. A. 1976, Astrophys. Lett., 17, 87
- Hurley et al. (2005) Hurley, J. R., Pols, O. R., Aarseth, S. J., & Tout, C. A. 2005, MNRAS, 363, 293
- Jurić et al. (2008) Jurić, M., Ivezić, Ž., Brooks, A., et al. 2008, ApJ, 673, 864
- Katz et al. (2019) Katz, D., Sartoretti, P., Cropper, M., et al. 2019, A&A, 622, A205
- Kharchenko et al. (2013) Kharchenko, N. V., Piskunov, A. E., Schilbach, E., Röser, S., & Scholz, R.-D. 2013, A&A, 558, A53
- King (1962) King, I. 1962, AJ, 67, 471
- Krone-Martins & Moitinho (2014) Krone-Martins, A. & Moitinho, A. 2014, A&A, 561, A57
- Küpper et al. (2010) Küpper, A. H. W., Kroupa, P., Baumgardt, H., & Heggie, D. C. 2010, MNRAS, 401, 105
- Lamers et al. (2005) Lamers, H., Gieles, M., Bastian, N., et al. 2005, Astronomy & Astrophysics, 441, 117
- Lanzoni et al. (2007) Lanzoni, B., Dalessandro, E., Ferraro, F. R., et al. 2007, ApJ, 663, 267
- Lauer et al. (1995) Lauer, T. R., Ajhar, E. A., Byun, Y.-I., et al. 1995, AJ, 110, 2622
- Lindegren et al. (2018) Lindegren, L., Hernández, J., Bombrun, A., et al. 2018, A&A, 616, A2
- Liu et al. (2016) Liu, F., Asplund, M., Yong, D., et al. 2016, MNRAS, 463, 696
- Luri et al. (2018) Luri, X., Brown, A. G. A., Sarro, L. M., et al. 2018, A&A, 616, A9
- Mapelli et al. (2004) Mapelli, M., Sigurdsson, S., Colpi, M., et al. 2004, ApJ, 605, L29
- Markwardt (2009) Markwardt, C. B. 2009, in Astronomical Society of the Pacific Conference Series, Vol. 411, Astronomical Data Analysis Software and Systems XVIII, ed. D. A. Bohlender, D. Durand, & P. Dowler, 251
- McCrea (1964) McCrea, W. H. 1964, MNRAS, 128, 147
- McGaugh (2016) McGaugh, S. S. 2016, ApJ, 816, 42
- McMillan (2017) McMillan, P. J. 2017, MNRAS, 465, 76
- Meingast & Alves (2019) Meingast, S. & Alves, J. 2019, A&A, 621, L3
- Ostriker et al. (1972) Ostriker, J. P., Spitzer, Jr., L., & Chevalier, R. A. 1972, ApJ, 176, L51
- Pichardo et al. (2012) Pichardo, B., Moreno, E., Allen, C., et al. 2012, The Astronomical Journal, 143, 73
- Pichardo et al. (2012) Pichardo, B., Moreno, E., Allen, C., et al. 2012, AJ, 143, 73
- Robin et al. (2012) Robin, A. C., Marshall, D. J., Schultheis, M., & Reylé, C. 2012, A&A, 538, A106
- Robin et al. (2003) Robin, A. C., Reylé, C., Derrière, S., & Picaud, S. 2003, A&A, 409, 523
- Röser & Schilbach (2019) Röser, S. & Schilbach, E. 2019, arXiv e-prints [arXiv:1903.08610]
- Röser et al. (2019) Röser, S., Schilbach, E., & Goldman, B. 2019, A&A, 621, L2
- Smith & Eichhorn (1996) Smith, Haywood, J. & Eichhorn, H. 1996, MNRAS, 281, 211
- Soubiran et al. (2018) Soubiran, C., Cantat-Gaudin, T., Romero-Gómez, M., et al. 2018, A&A, 619, A155
- Spitzer (1958) Spitzer, Lyman, J. 1958, ApJ, 127, 17
- Spitzer (1987) Spitzer, L. 1987, Dynamical evolution of globular clusters
- van der Marel & Anderson (2010) van der Marel, R. P. & Anderson, J. 2010, ApJ, 710, 1063
- Yeh et al. (2019) Yeh, F. C., Carraro, G., Montalto, M., & Seleznev, A. F. 2019, AJ, 157, 115
Appendix A Clusterix membership selection
Clusterix is a web-based tool for the determination of membership probabilities from proper motion data using a non-parametric approach based on the formalism described by Galadi-Enriquez et al. (1998), in a new implementation whose details can be found in Balaguer-Núñez et al. (2017). In the sky area occupied by the cluster, the frequency function is assumed to be made up from two contributions: cluster and field stars. The tool performs an empirical determination of the frequency functions from the vector-point diagram (VPD) without relying on any previous assumption about their profiles. To disentangle the two populations, Clusterix studies the VPD corresponding to two areas on the plane of the sky: one in the cluster core and another one far enough from the cluster to have a small (negligible) cluster contribution, but close enough to still be a good representation of the field in the cluster area. Clusterix allows to search in an interactive and visual way the appropriate areas until an optimal separation is obtained (more details will be given in Balaguer-Núñez et al, in preparation). Several limits can be adjusted to make the calculation computationally feasible without interfering in the quality of the results: in this case we have set a constrain in proper motions (-15+15 and -15+15 mas yr-1), proper motions errors (below 5 mas yr-1) and magnitude (18). Given that the Clusterix selection is only based on proper motions we added an additional constrain in parallaxes choosing only those objects within from the median of the distribution. The current version of Clusterix does not apply any criteria based on spatial distribution nor photometry for membership assessment.
There is no rigorous way to decide where to set the limit between members and non-members in a list sorted by membership probabilities. This non-parametric membership method produces an expected number of cluster members that serves as an indication of the probability limit for the most probable cluster members. However, when the study is done over a large sky area, as in this case, the field surrounding the cluster cannot be considered perfectly homogeneous, due to the existence of other structures in the background and surroundings (e.g. other clusters). This is not a problem for the calculation of the membership, as long as the area chosen to represent the cluster is not too far from the cluster core, but it has an impact on the calculation of the expected number of cluster members, as this quantity depends on the total number of stars in the area. In this case, we have performed this study in two steps: first considering an area of 5 deg where the field is homogeneous enough and the number of expected cluster members gives a reliable result, followed by a second step, using that list of members (where most of the cluster is found) to fix the membership probability cut on the study of the 10 deg area (0.81).
Appendix B Bayesian inference of stellar distances for reconstructing the 3D shape of NGC 2682
As commented in Sect. 4 the propagation of the non negligible uncertainties causes that the determination of distances through the inversion of the parallax, , produces erroneous results. In order to overcome this issue we have used a Bayesian approach to determine distances, , to the objects analysed in this paper. To do that we follow Bailer-Jones (2015) Bayesian approach, using for each star the parallax to update a prior distribution in distance , obtaining an (un-normalized) posterior distribution as follows:
| (7) |
where
| (8) |
with equal to the quoted error bar on each parallax measurement, i.e. we assumed that uncertainties on the parallax are Gaussian, with a standard deviation equal to the quoted error bar . Regarding the prior, we used a Gaussian centred at the average distance of NGC 2682, 860 pc (Cantat-Gaudin et al. 2018a) to represent the cluster, plus a term that accounts for field stars or more in general stars that may be forming a diffuse envelope around NGC 2682, for which we do not wish to make overly restrictive assumptions. The standard deviation of the Gaussian term, was chosen equal to the standard deviation of physical distances of member stars projected on the plane of the sky. This is equivalent to assuming, in the prior, that the cluster term is spherical. While the choice of a Gaussian prior may seem unjustified from the physical point of view we chose it for simplicity, as it is significantly easier to implement than e.g. a King model. The resulting prior is as follows:
| (9) |
where is a (normalized) exponentially decreasing volume density prior (see Eq. 17 of Bailer-Jones 2015, with =8 kpc), and is the UPMASK membership score. As the Bailer-Jones (2015) prior is essentially a smoothly truncated constant density prior it is a good choice for not making strong assumptions about the start that happen to be loosely associated to NGC 2682. The adopted distance for each star is estimated with the mode of the posterior distribution. As pointed out in Luri et al. (2018), the whole posterior distribution should be kept, rather than summarized, as the end result of a correct Bayesian inference procedure. This applies in our case a fortiori, because we are not interested in the position of individual stars as much as we are interested in the overall mass density distribution of the whole cluster. However in this letter, for the sake of concreteness, we decided to obtain anyway a point estimate from the posterior distribution.