Investigating molecular mechanism for the stability of ternary systems containing cetrimide, fatty alcohol and water by using computer simulation
Abstract
Computer simulations using atomistic model are carried out to investigate the stability of ternary systems of pure or mixed fatty alcohols, cetrimide, and water. These semisolid oil-in-water systems are used as the main component of pharmaceutical creams. Experiments show that the mixed alcohol systems are more stable than pure ones. The current experimental hypothesis is that this is the result of the length mismatch of the alkyl chains. This leads to higher configurational entropy of the chain tip of the longer alcohol molecules. Our simulation results support this hypothesis. The results also show that the shorter alcohol molecules become stiffer with higher values of the deuterium order parameters and smaller area per molecule. The magnitude in fluctuations in the area per molecule also increases in mixed systems, indicating a higher configurational entropy. Analysis of the molecular structure of simulated systems also shows good agreements with experimental data.
pacs:
87.16.D−, 88.20.fj, 87.10.Tf, 81.16.Dn, 87.16.A-, 82.70.UvI Introduction
Pharmaceutical creams are one of the common types of topical formulations, used as a means of delivering an active ingredient directly to the skin. Generally speaking, they are oil-in-water semisolid emulsions.
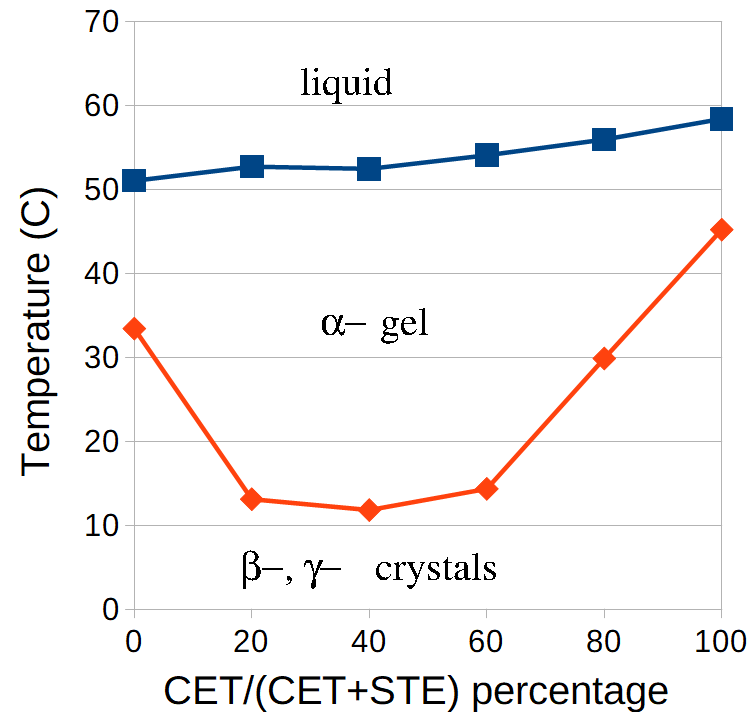
According to the gel network theory G.M.Eccleston (1997); Junginger (1984), these formulations consist of at least four phases: (i) crystalline/hydrophilic gel phase is composed of bilayers of surfactant and fatty amphiphile and water molecules are inserted between the bilayers (i.e. interlamellarly fixed water); (ii) water molecules bound as free bulk water are in equilibrium with the interlamellarly fixed water in the gel phase; (iii) lipophilic gel phase is built up by the excess of the fatty amphiphile, which is not part of the hydrophilic gel phase; and (iv) dispersed oil phase (i.e. inner phase) is mainly immobilized mechanically from the lipophilic gel phase. In practice, surfactant-fatty alcohol-water ternary systems could be used as representative models of the continuous phases of the corresponding semisolid o/w emulsions. Previous works on the characterization of semisolid oil-in-water emulsions containing pure and mixed homologue fatty alcohols (i.e. cetyl, stearyl and cetostearyl alcohols) and cetrimide Iwata (2017); G.M.Eccleston (1985); Eccleston (1977) have shown that the oil-in-water emulsions increased in consistency and remained stable on the addition of cetostearyl alcohol, whereas the emulsion stability decreased markedly to mobile liquid when cetyl or stearyl alcohol was added individually on the preparation. This is demonstrated in the phase diagram, Fig. 1, where it is shown that the gel is stable down to lower temperature for mixed cetyl and stearyl alcohol as compared to either of them individually.
Although the above-mentioned studies partially showed the correlation between various fatty alcohol combinations and their influence on the microstructure and consistency of the corresponding oil-in-water emulsions prepared with them, no comprehensive studies at the molecular level has been carried out. The aim of this study is to elucidate the molecular mechanism for the higher stability of the mixed cetostearyl bilayer gel network as compared to each component used separately. Previous experiments Snyder et al. (1983); Iwata (2017) suggested this is due to the alkyl chain length mismatch in the mixed system. As a result, the alkyl chain tip of C18OH has a high degree of freedom, and, in this part gauche coordination increases. Our computational study supports this hypothesis at the molecular level. We also show that upon mixing the alkyl chain of C16OH becomes stiffer and the C18OH alkyl chain tip becomes more flexible. Also, the inplane area per molecule fluctuations is more pronounced for mixed systems. This explanation provides further insights into the molecular mechanism of the stability of mixed system.
The paper is organized as follows. After the Introduction section, in Sec. II, the model of our system and various physical parameters used in the simulation are presented in details. In Sec. III, the results are presented and their relevance to available experimental data is discussed. We conclude in Sec. IV.
II Computational details
The chemical structure of cetyl (CH3(CH2)15OH), stearyl (CH3(CH2)17OH) alcohols and cetrimide (C17H38BrN) are downloaded from pubchem database (https://pubchem.ncbi.nlm.nih.gov/) with CID 2682, 8221 and 14250 respectively. Gaussian 09 software package is used to optimize their three dimensional structures, and to calculate the partial charges on each atom. These partial charges are then adjusted and rounded to match the values of the hydrocarbon tails, hydroxyl and choline head groups of forcefield for the united atom model for polyalcohols Ferrando et al. (2009) and of the slipid forcefields Jämbeck and Lyubartsev (2012, 2013). These parameters are then combined with the bonded interactions in the Amber GAFF forcefield by using AmberTools 2017 to create the full forcefield for the molecules used in the computer simulations. For the bromide ions, the AMBER99-ILDN forcefield is used. For the water molecules, the common TIP3P forcefield is used for its high compatibility with the AMBER forcefields.
The initial coordinates of the atoms of a bilayer of these molecules are then constructed in the following way. First, the corresponding optimized atom coordinates in the previous step are duplicated at random site in either a square or hexagonal lattice in the -plane with a lattice constant of 0.48nm. The hydrocarbon tails are directed inward the bilayer along the -axis, while the hydroxyl polar group are exposed outward the solution (see Fig. 2). We prepare the system of cetyl and stearyl alcohol mixture at 100:0, 70:30, 50:50, 30:70, 0:100 number ratios. For easy identification in later discussion, we name these systems 100CET, 70CET, 50CET, 30CET, and 0CET respectively. Beside the alcohol molecules, there are also positively charged cetrimide molecules embedded in the bilayer to make them stable. Their number is about 10% of the total number to match experimental systems. The bilayer is then solvated with 37210 water molecules, creating simulation box of about 24nm along the -axis. The electrostatic repulsion between parallel bilayer among these cetrimide molecules keeps the bilayer structure stable. To compensate for the charges of cetrimide, the system is made neutral by replacing randomly 64 water molecules by bromide ions, Br-.
The periodic boundary condition is used for all three directions. The thickness of the water layer (24 nm) has been chosen so that it is much larger than the typical electrostatic screening in the system (about 1nm) and the electrostatic coupling between neighboring simulation boxes is well screened out. This value also lies in the range of the repeat distance of these cetyl/stearyl lamellar value from 6 to 100nm Eccleston et al. (2000) while keeping the computational cost reasonable. For reference, the number of each type of molecules for each of our simulated systems are listed in Table. 1. Particle Mesh Ewald method Darden et al. (1993) was used to treat the long-range electrostatic interaction with a real space cutoff of 1.4 nm. Van der Waals interactions are also cut off at 1.4 nm, with the appropriate cut-off corrections added to pressure and energy.
| System name | 0CET | 30CET | 50CET | 70CET | 100CET |
|---|---|---|---|---|---|
| STE:CET # ratio | 100:0 | 70:30 | 50:50 | 30:70 | 0:100 |
| # of Cetyl | 0 | 176 | 292 | 408 | 584 |
| # of Stearyl | 584 | 408 | 292 | 176 | 0 |
| # of Cetrimide | 64 | 64 | 64 | 64 | 64 |
| # of Br ions | 64 | 64 | 64 | 64 | 64 |
| # of water molecules | 37146 | 37146 | 37146 | 37146 | 37146 |
After constructing the initial coordinates of the atoms and topology of the molecules, the systems are further processed and simulated by using GROMACS 2018.3 molecular dynamics software package Berendsen et al. (1995); Abraham et al. (2015). The whole system of surfactants, water and ions are equilibrated for 100 ns at temperature 300K and pressure of 1 atm by using NPT ensemble using Berendsen thermostat and barostat. The barostat maintains independently the pressure along each of the three directions , and axes of the system. This ensures that each dimension of the simulation box varies independently from each other, allowing the bilayer molecules to relax into its optimal lattice structure regardless of the initial lattice configuration. For production run, the systems are simulated for additional 1 at the same temperature and pressure by using NoseHoover thermostat and ParrinelloRahman barostat. All barostats are kept at 1 atm so that on average the surface tension of the bilayers simulated are zero. For taking statistics, all the configurations within the first 100ns of simulation, where the systems are relaxing to its equilibrium state, are dropped. All the simulations are performed on the High Performance Computing cluster of the VNU Key Laboratory for Multiscale simulation of complex systems at the Vietnam National University Hanoi. For analysis, beside standard tools from GROMACS software, the VMD software package Humphrey et al. (1996) and MEMBPLUGIN plugin Guixà-González et al. (2014) is used for visualization, calculation of the order parameters, area per molecules, tilt angles, and other physical properties of the bilayer.
III Results and discussions
Experimentally, it is established by various synchrotron Xray studies that the lamellar bilayer of the cetyl, stearyl alcohols is of hexagonal lattice packing with diffraction spacing of 4.06Å for the amount of water and temperature that we simulate Eccleston et al. (2000); Iwata (2017); Fukushima et al. (1976, 1977). This corresponds to the hexagonal lattice with lattice constant (or nearest neighbor distance) of Å and the area per molecule of 19.13Å2. Additionally, in experimental studies of on the bilayer made of different types of molecules with different chain lengths and head groups, it is shown that this inplane lattice distance depends very weakly on the length of the hydrocarbon chain, and mostly depends on the interaction among the head groups Langmuir (1917). Therefore, our immediate concerns are to reproduce these experimental facts to verify that our forcefield parameters are reasonable.
III.1 Relaxation to equilibrium
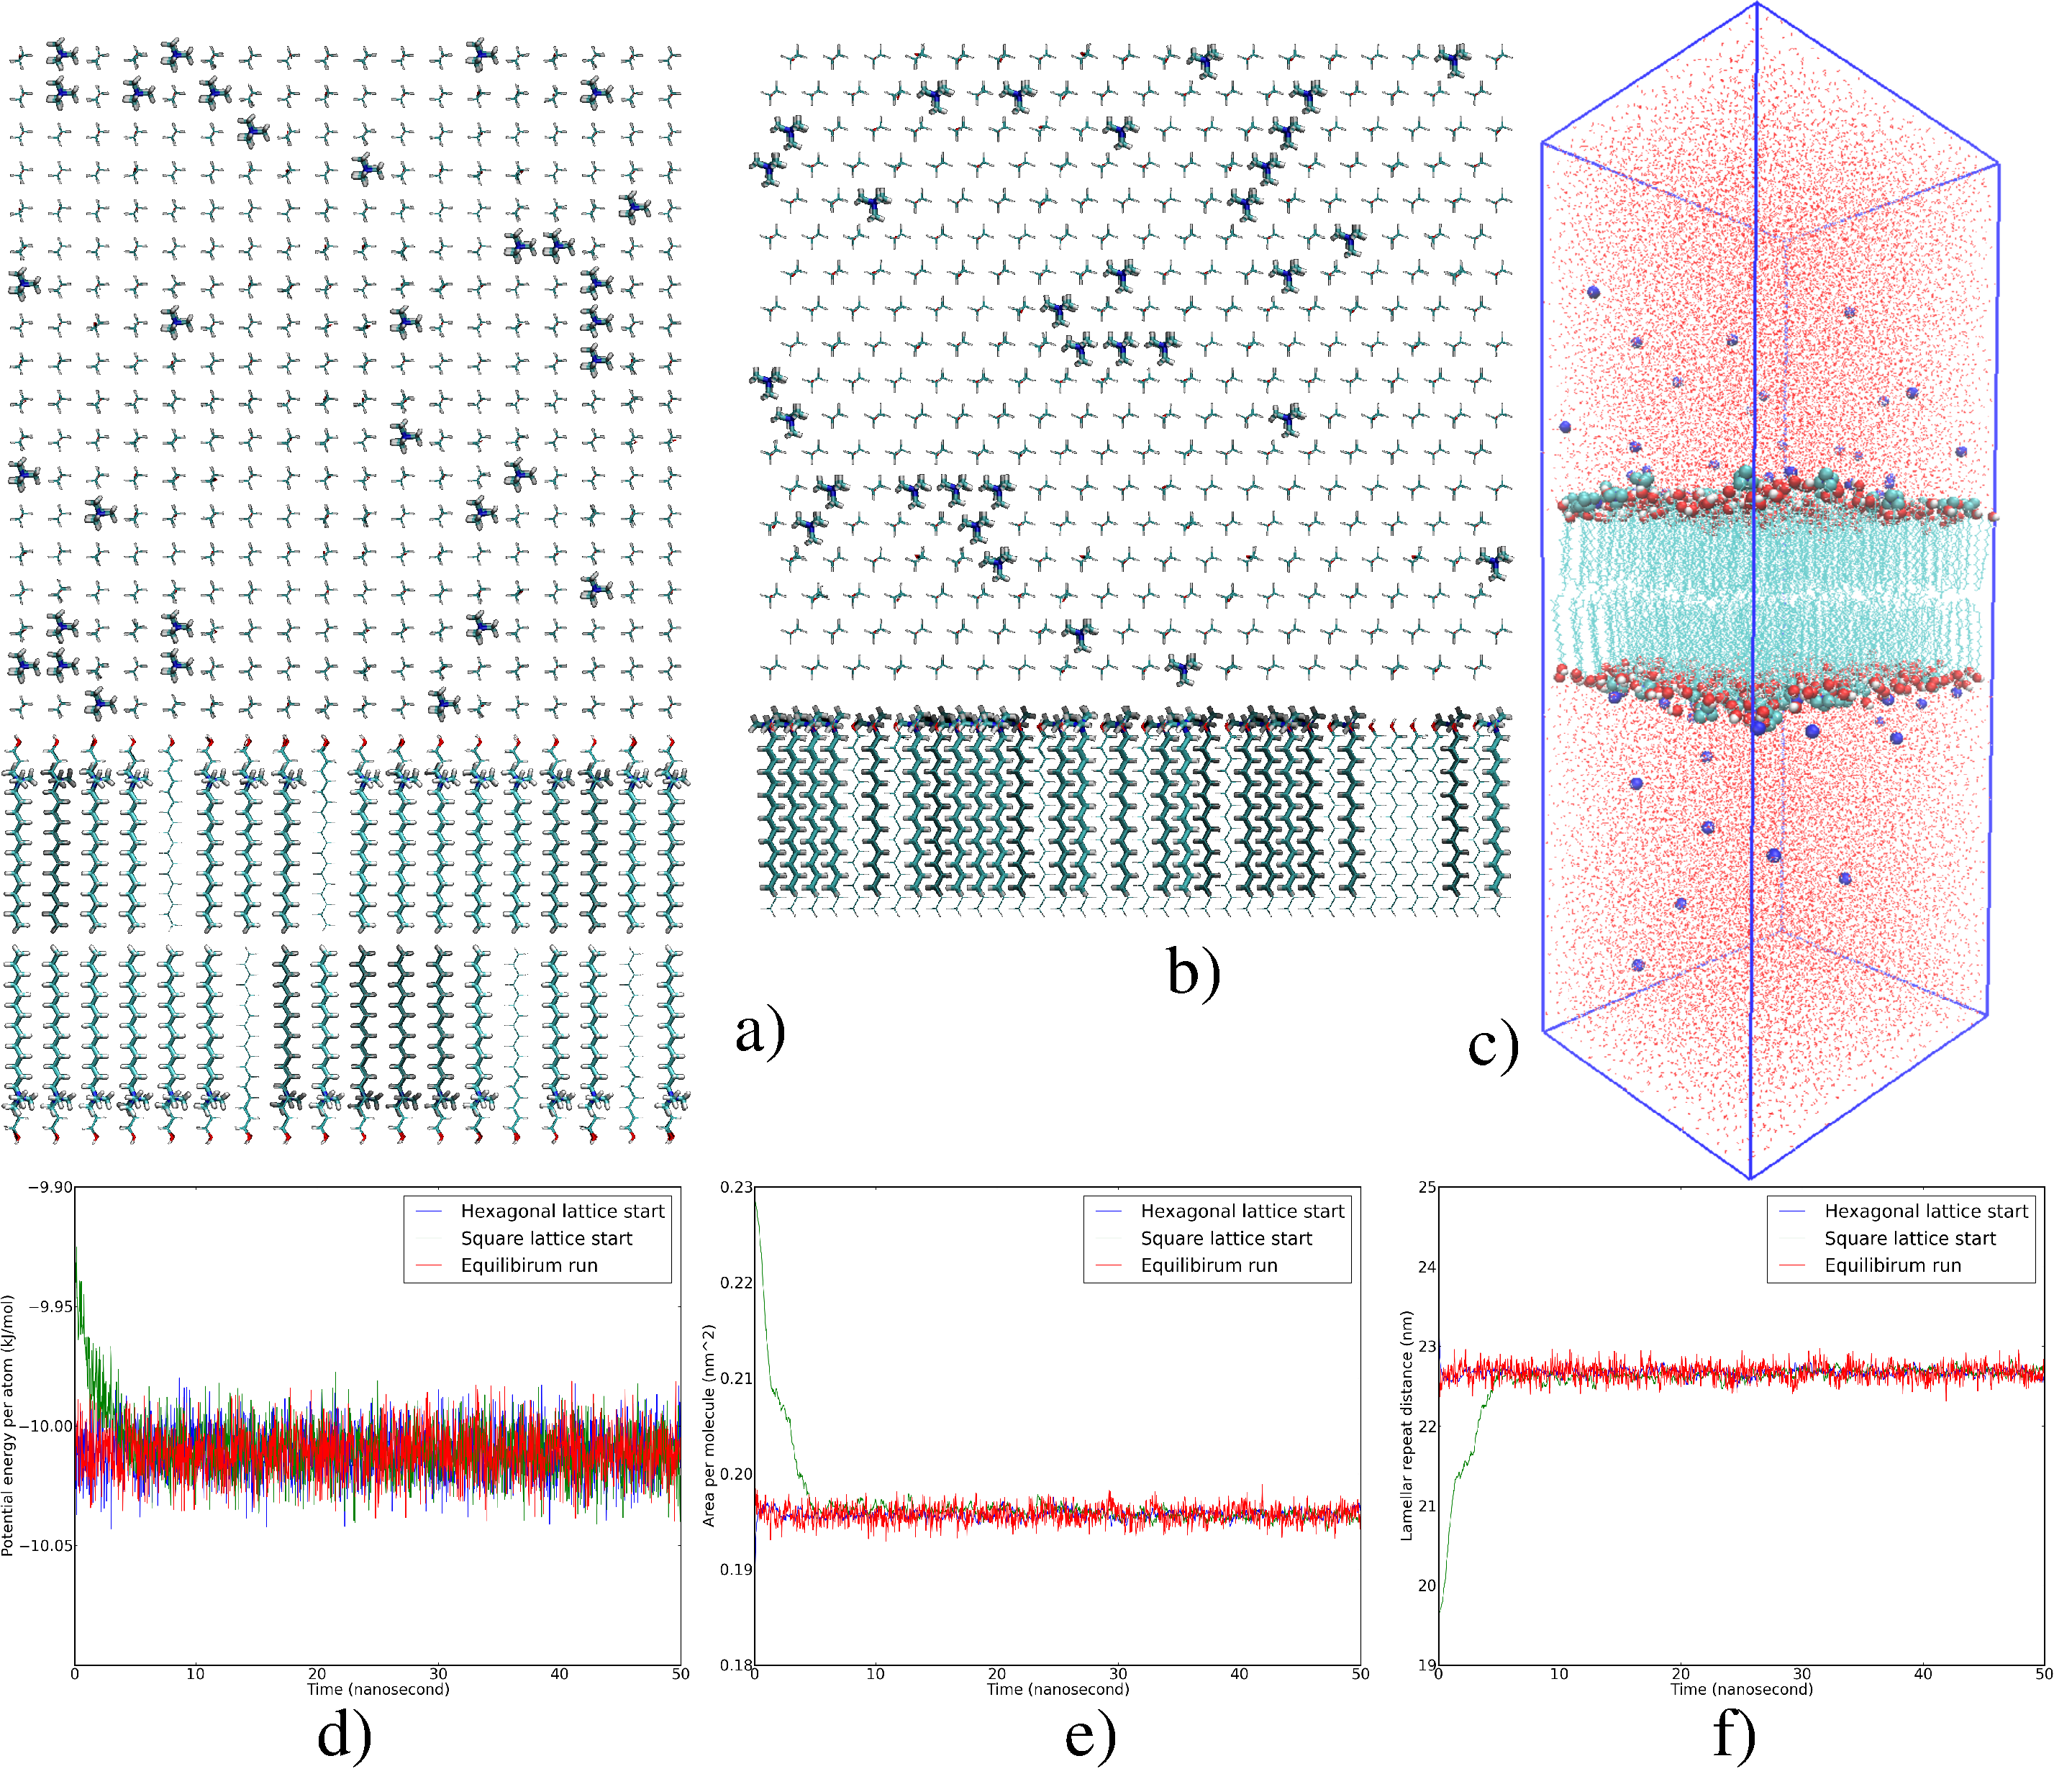
The first question one would like to address is whether our systems have sufficient time within our simulation to relax into its equilibrium structure, at least at short range order. To do this, two very different initial starting configurations of the bilayer is used (see Fig. 2). In the first starting configuration, the 292 alcohol molecules and 32 cetrimide molecules in each leaflet are positioned randomly at the sites of a 1818 square lattice with a lattice constant of 0.48nm (Fig. 2a). The initial simulation box dimension in the inplane direction is 8.46mm8.46nm. In the second starting configuration, these 324 molecules are positioned at the sites of a 1818 hexagonal lattice with a lattice constant of 0.46nm (Fig. 2b). The initial simulation box dimension in the inplane direction is 8.42nm7.17nm. These two initial systems are both solvated with the same numbers of water molecules and Br- ions as listed in Tab. 1. They are then relaxed in NPT ensemble of 1 atm and 300∘K by using Berendsen thermostat and barostat. Each dimension of the simulation box can relax independently of each other, hence the bilayer can adopt to any optimal gel or crystal packing that minimizes the system free energy. In Fig. 2d, e and f, we plot as a function of time, the potential energy of the system per atom, the inplane projected area per molecule, and the repeat distance of the lamellar bilayer (the dimension of the box). For comparison, these quantities are also plotted for an equilibrium MD run after the systems has been equilibriated, using NoseHoover thermostat and ParrinelloRahman barostat. As one can clearly sees, after at most 20ns, all our quantities converge to their equilibrium value regardless of initial starting configuration. The convergence is rather remarkable based on the fact that the individual dimensions of the box, and , remain very different for different starting configurations, but the inplane area per molecule
is the same for all simulations within statistical errors. Although, these graph are plotted for the 0CET system, data for all other four systems (not plotted) show similar behaviours. All the relevant parameters of the system converged after about 20ns of relaxation. Additionally, as we will see in the next section, the local order for the alcohol molecules in the bilayer is indeed hexagonal packing with lattice spacing of 4.69Å in excellent agreement with high angle Xray diffraction data.
In light of these results, for the rest of this paper, unless explicitly stated, all systems are initialized very closed to their equilibrium structure by using hexagonal lattice starting configuration to minimize the relaxation time of each system. Furthermore, in each analysis for equilibrium properties, data from the first 100ns of a MD production run is dropped to make sure the systems are well equilibriated.
III.2 Molecular structure of the bilayers
Let us turn now to describe the molecular structure of the bilayer to show that they reproduce well the available experimental data as well as provide additional insights obtained from the simulations. First, the inplane radial distribution function, , of the carbon atoms in the hydrocarbon tail of the molecules are calculated. This is the probability of an atom being at the radial distance from a given atom. Only the inplane components of the atom positions are used for this calculation. In Fig. 3a, the radial distribution for the tenth carbon atom (counted from the OH polar head) deep in the leaflets are plotted for the systems with 100% cetyl alcohol and 100% stearyl alcohol. As one can sees, the first two peaks of these distribution functions occur at almost the same locations regardless of the length of the hydrocarbon chain. This also means that the nearest neighbor distance between the alcohols is nearly independent of the length of the hydrocarbon chains for the two lengths simulated. This suggests that the hydrocarbon tail plays small roles in determining the projected area per molecules of these bilayers. Rather, it would be the head group (both are OH group for our molecules) that determine the position of the peaks, as supported by experimental studies Langmuir (1917).
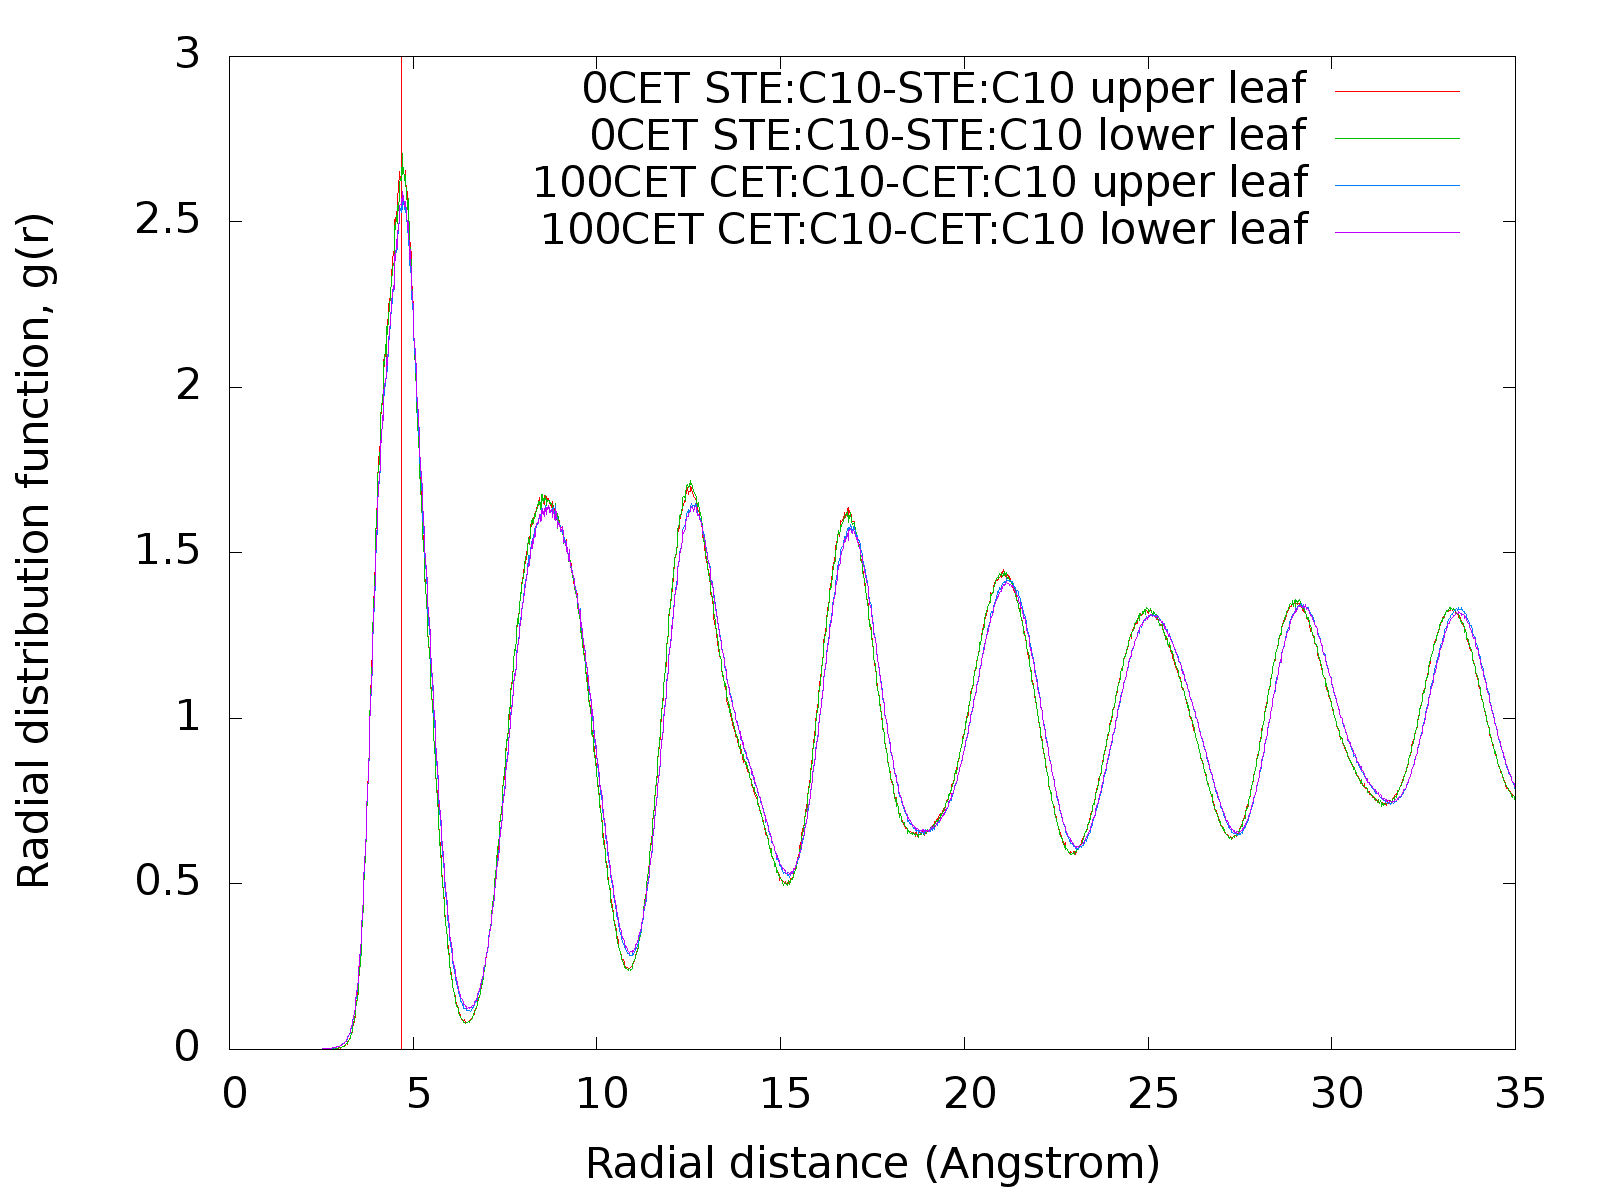
Although, depending on the specific lipids, the lamella phases can be orthorhombic, monoclinic or hexagonal crystals, the cetyl and stearyl mixture is known to exhibit hexagonal order in lamella phases: gel at higher temperature, and crystals at lower temperature. Xray experiments Eccleston et al. (2000) shows hexagonal order with the diffraction spacing of 4.06Å for various cetostearyl alcohol ternary gel. This translates into the nearest neighbor distance of 4.69Å and an unit cell area of 19.13Å2. Our simulation agrees well with these experimental facts. Even though the starting configuration is that of either a square lattice or hexagonal lattice of lattice constant 4.8Å, both systems settle to an equilibrium hexagonal order. Figure 3a shows that the most probable nearest neighbor distance of our alcohol molecules projected on the plane is Å in excellent match to experimental data. Furthermore, both cetyl and stearyl molecules show almost the same interatom distance. This suggests that the length of the alkyl chain has only a small influence on the short range order in the bilayer. The difference only shows up in a slight difference in the locations of higher order peaks in the radial distribution. This also agrees with experimental data Langmuir (1917) showing this length depends mostly on the type of the head group, not on the length of the alkyl chain. This provides strong support for the chosen physical parameters of the atoms and molecules that we use. Further detail investigation of these parameters will be published in a near future work, where the phase diagram and energetics of these alcohol systems are computed computationally.
| System | (nm) | (nm) | (nm) | (nm2) |
|---|---|---|---|---|
| 0CET | 8.500.06 | 7.380.05 | 23.380.09 | 0.1940.003 |
| 30CET | 8.510.05 | 7.400.04 | 23.170.09 | 0.1940.003 |
| 50CET | 8.540.05 | 7.390.04 | 23.020.09 | 0.1950.003 |
| 70CET | 8.540.05 | 7.410.04 | 22.880.09 | 0.1950.003 |
| 100CET | 8.560.05 | 7.410.04 | 22.680.09 | 0.1960.003 |
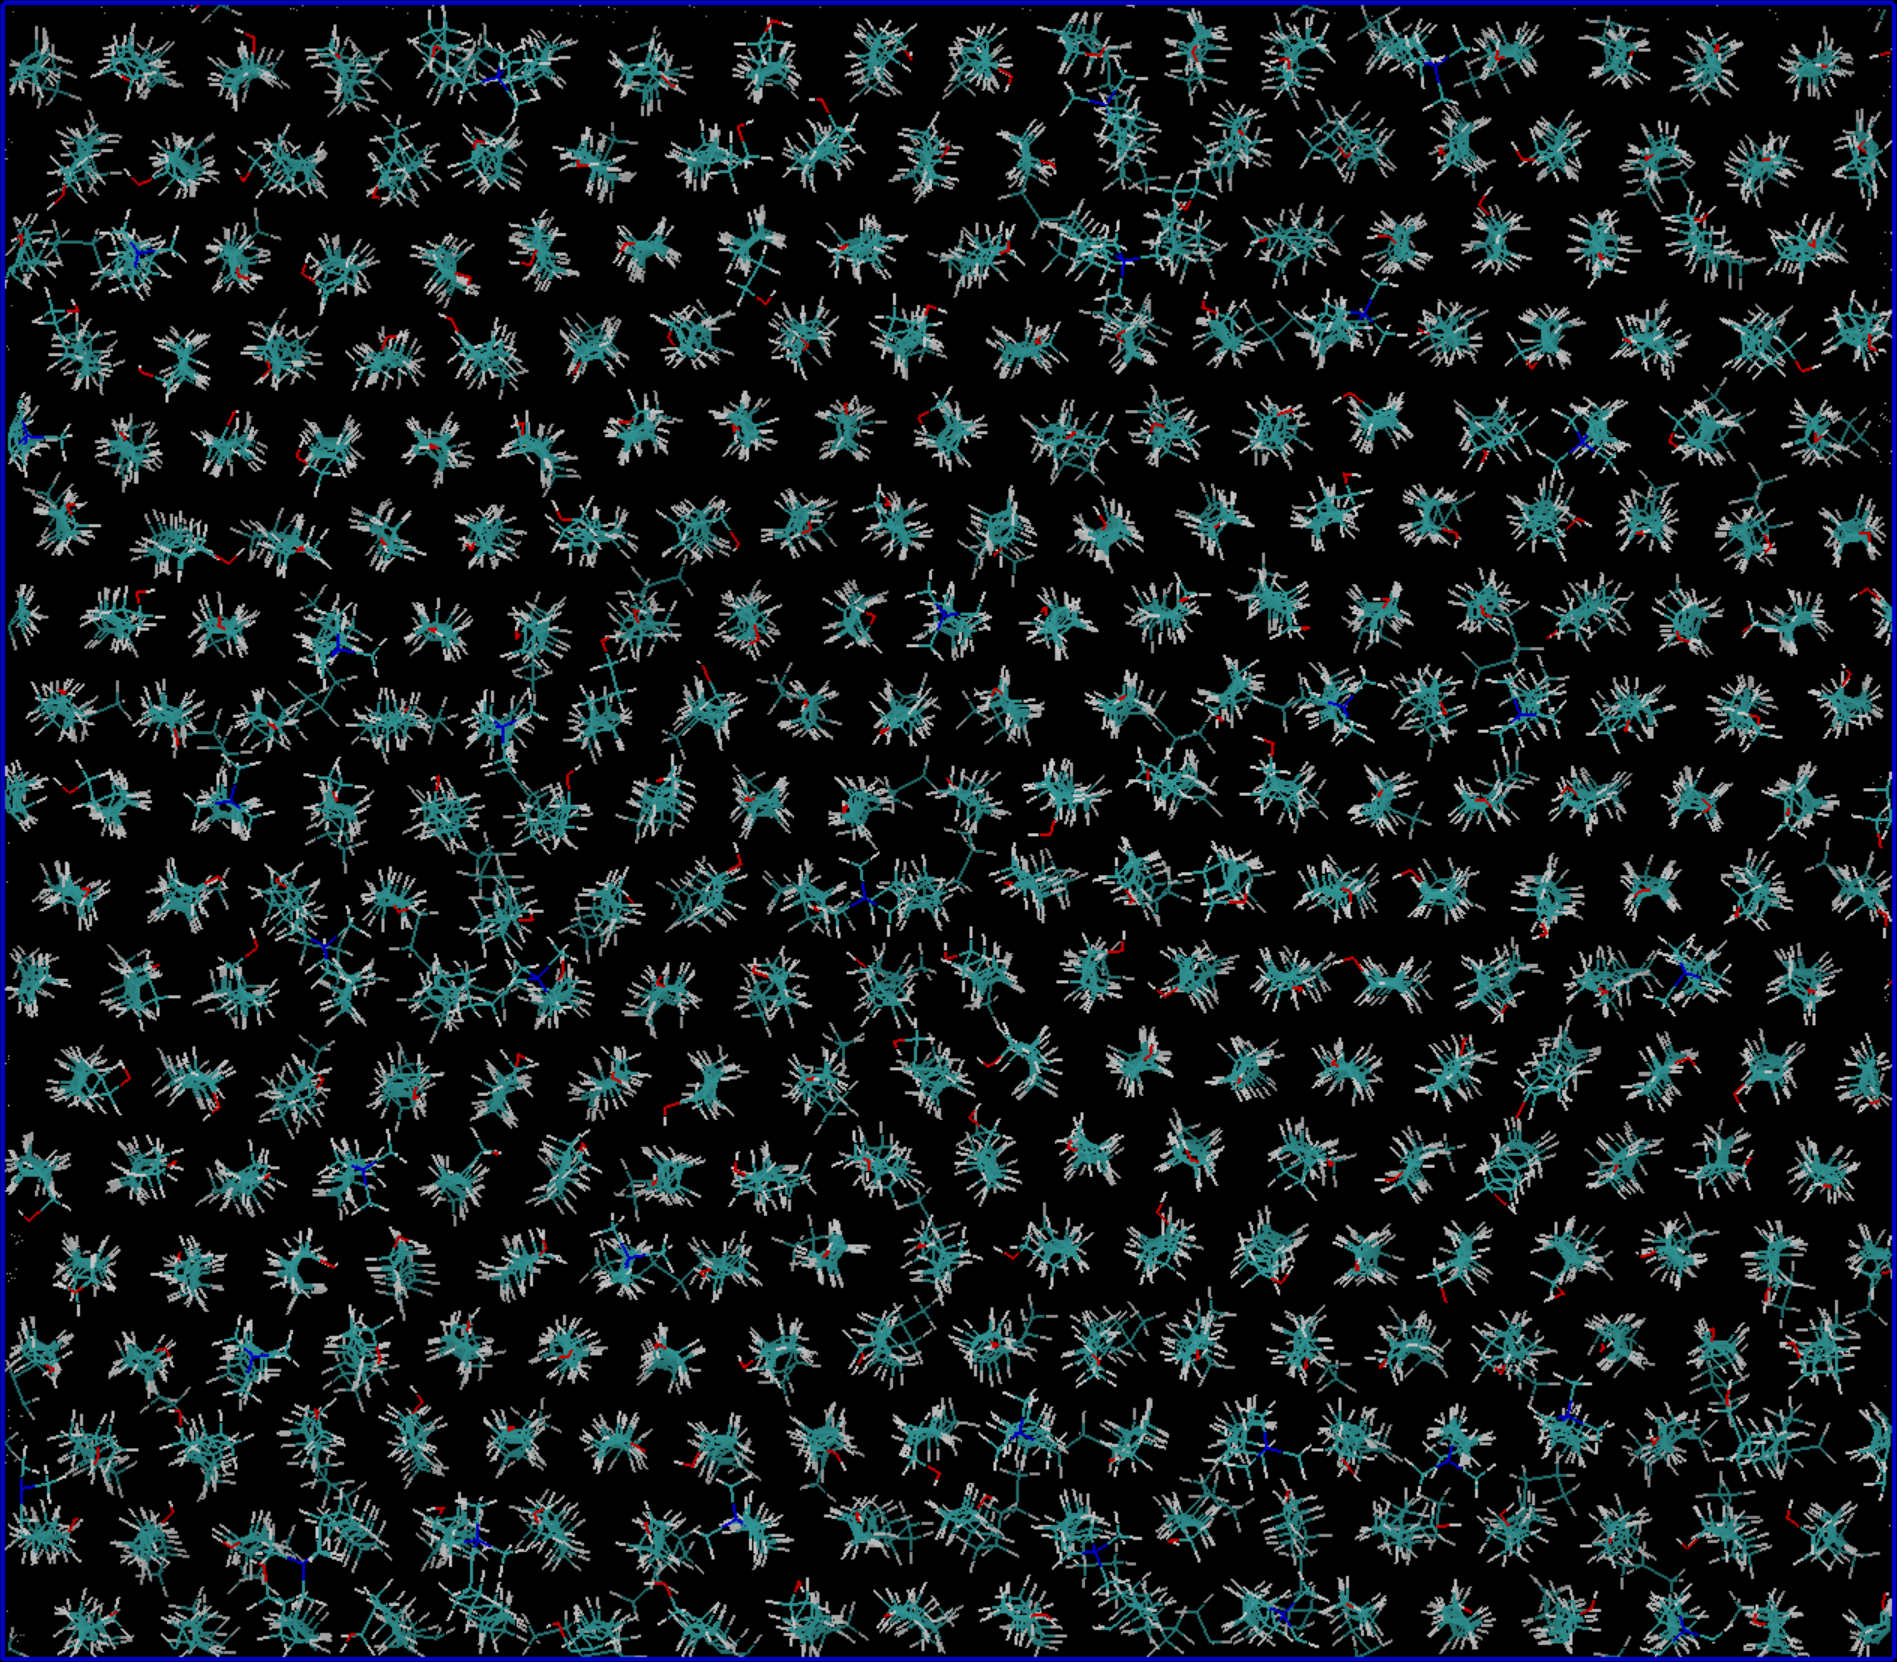
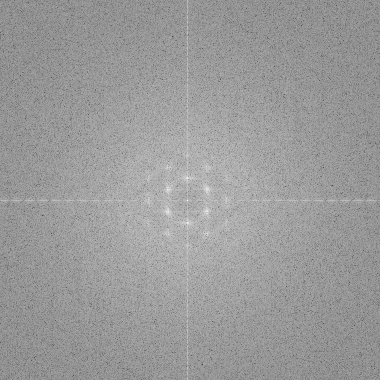
One can also look at the local ordering in each leaf of the bilayer from a different perspective. In Fig. 4a, the configuration of the molecules forming the “upper” leaf of the bilayer for the system of 100% stearyl alcohol after 1 s of simulation is visualized by using the VMD program. A colored picture of the snapshot is taken, and then Fourier analysis is performed by using ImageJ photo analysis program. The result is shown on Fig. 4b, where the first few order peaks of a sixfold symmetry is clearly seen. This confirms once again the hexagonal nearest neighbor peak in the radial distribution function.
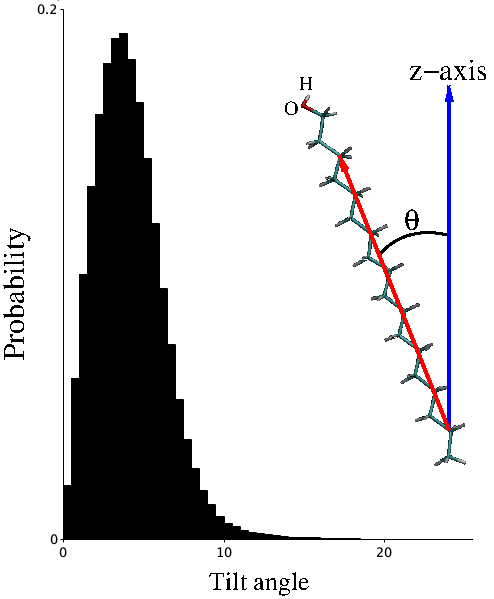
The gel and crystal lamellar phases of the alcohol bilayers are also distinguished from other phases by the fact that the hydrocarbon tail of the molecules lies parallel to the normal direction to the bilayer. This is indeed the case for our systems. In Fig. 4, the histogram of the tilt angle of the vector from C2 to C17 carbon atoms of the cetyl alcohol molecules are plotted. As one can clearly sees, the hydrocarbon tail typically tilts about 4∘ from the axis. This small angle shows that our bilayer leaflets are in lamellar and phases.
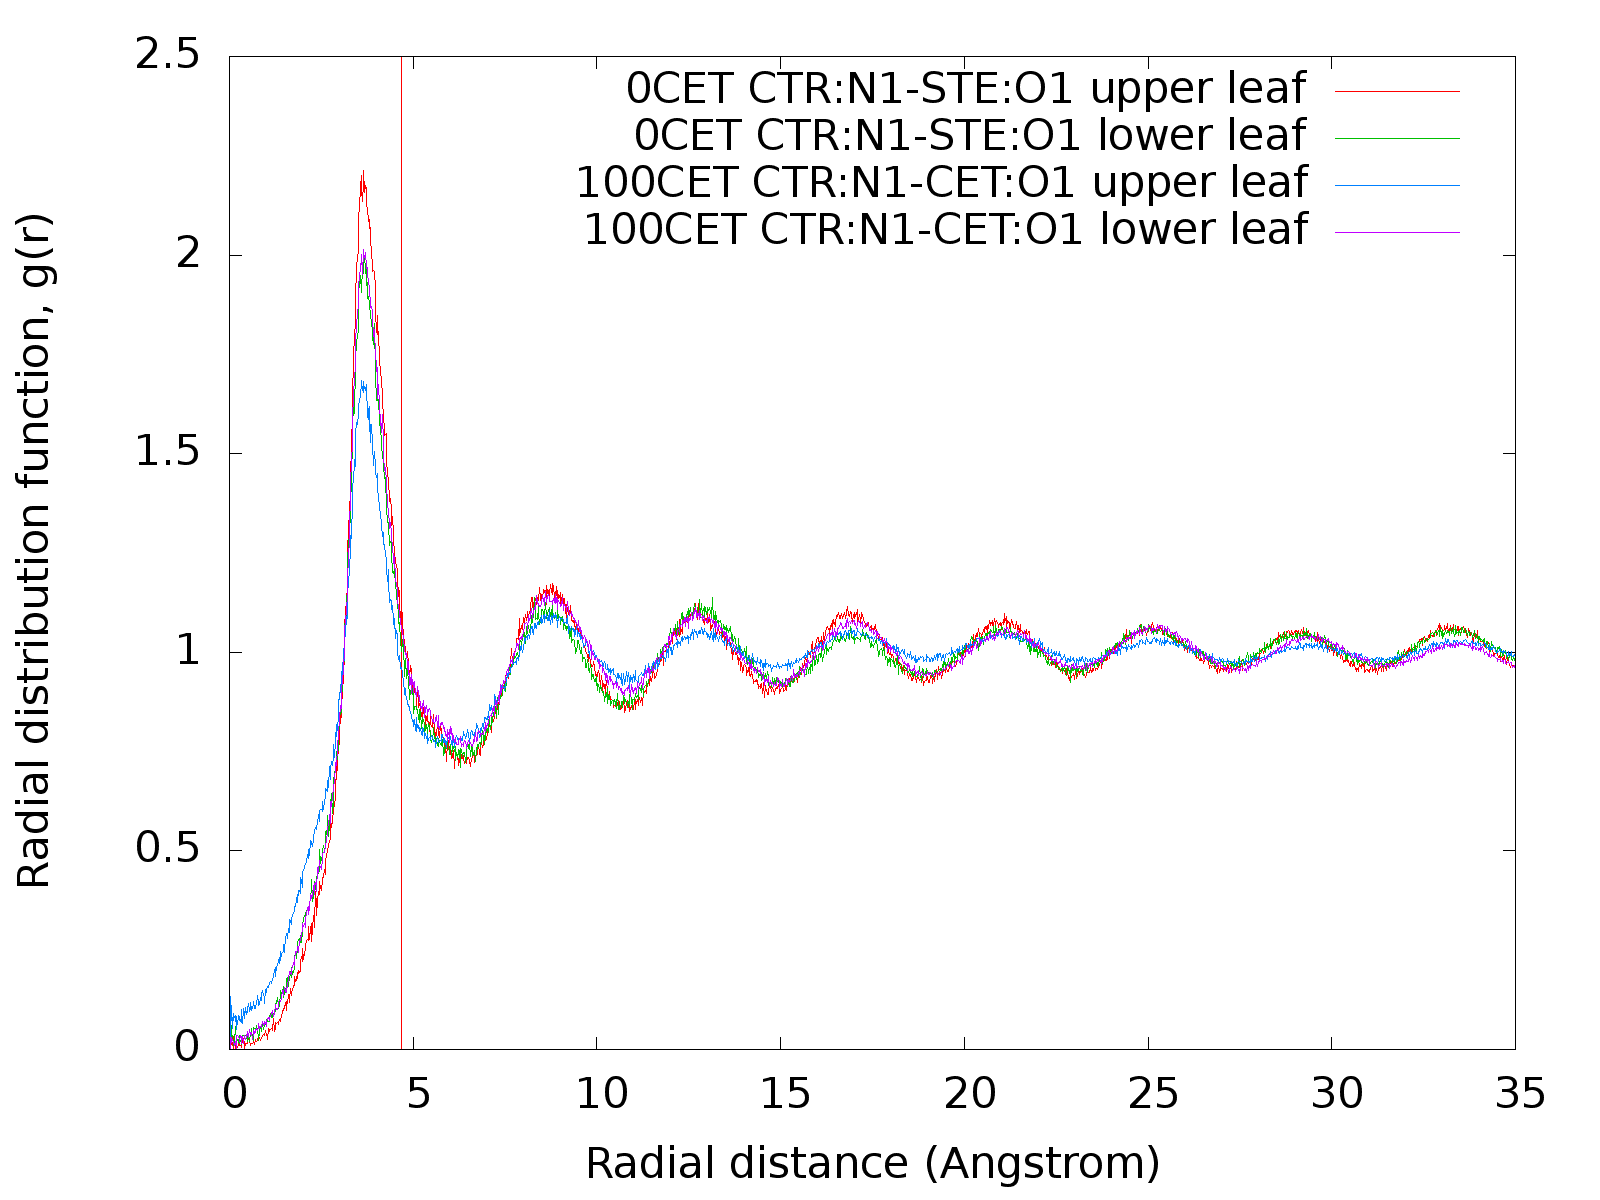
Further information on the system can be obtained by investigating the electrostatic interaction in the bilayer and mobile Br- counterions. First, one also wants to study the distribution of the neutral alcohol molecules around a charged cetrimide molecules. To this end, the radial distribution function of the head group of the alcohol molecules (represented by the position of the oxygen atom) around the head group of the cetrimide molecules (represented by the position of the nitrogen atom) in the inplane projection is calculated. The results for different cases are shown in Fig. 3b. The lines correspond to radial distribution function in the upper and lower leaves of the bilayer for the system with 100% stearyl alcohol (red and green), and for the system with 100% cetyl alcohol (blue and violet).
From the comparison with alkylalkyl radial distribution function, one can clearly see from these graphs that the charged head group of the cetrimide molecules attracts the polar head group of the alcohol towards it. The first peak location is smaller than that of the alkyl first peak. The probability of finding the OH head group of the alcohol near the cetrimide N+(CH3)3 head group is also finite at small .
Next, one looks at the distribution of the Br- counterions in the water layer between the bilayers. Within standard self-consistent meanfield PoissonBoltzmann (PB) theory of electrolytes Landau and Lifshitz (2013), the distribution of the counterions in the water solution between two infinite similarlycharged parallel planar surfaces at distance is given by Netz (2001); Moreira and Netz (2002); Andelman (1995):
| (1) |
where is the normal distance from one of the surfaces; is the charge density per unit area of the parallel charged surface. is the socalled Bjerrum length of the solution, is the dielectric permeability of free space, and is the dielectric constant of the solution. It is the length at which two elementary charges interact with Coulomb potential energy equal to the thermal energy, . In Eq. (1), is a length related to the thickness of the water layer by the transcendent equation:
| (2) |
In application to our bilayer system, Br- ions play the role of mobile counterions while each leaf of the bilayer plays the role of the charged planar surface with charge density
. For convenience, we measure the distance from the center of the bilayer, then the PB solution can be rewritten as:
| (3) |
Since the water solution is explicitly simulated in our system, by fitting the PB solution to the Br- counterion profile, one can obtain the effective dielectric constant of the system as well as the water layer thickness, and compare it to the above analysis. It should be noted that, due to a mismatch of the dielectric constants of the bilayer and water layer, the dielectric constant varies near the bilayer surface Schlaich et al. (2016). Taking into consideration the fact that the bilayer is not ideal planar surface, one expects the PB solution is applicable in about few water layers from the bilayer surface. In this section, we chose to fit the analytic formula from a distance of 3nm from the center of the bilayer to the center of the water. The results of our fitting is shown in Fig. 5 and Table 3.
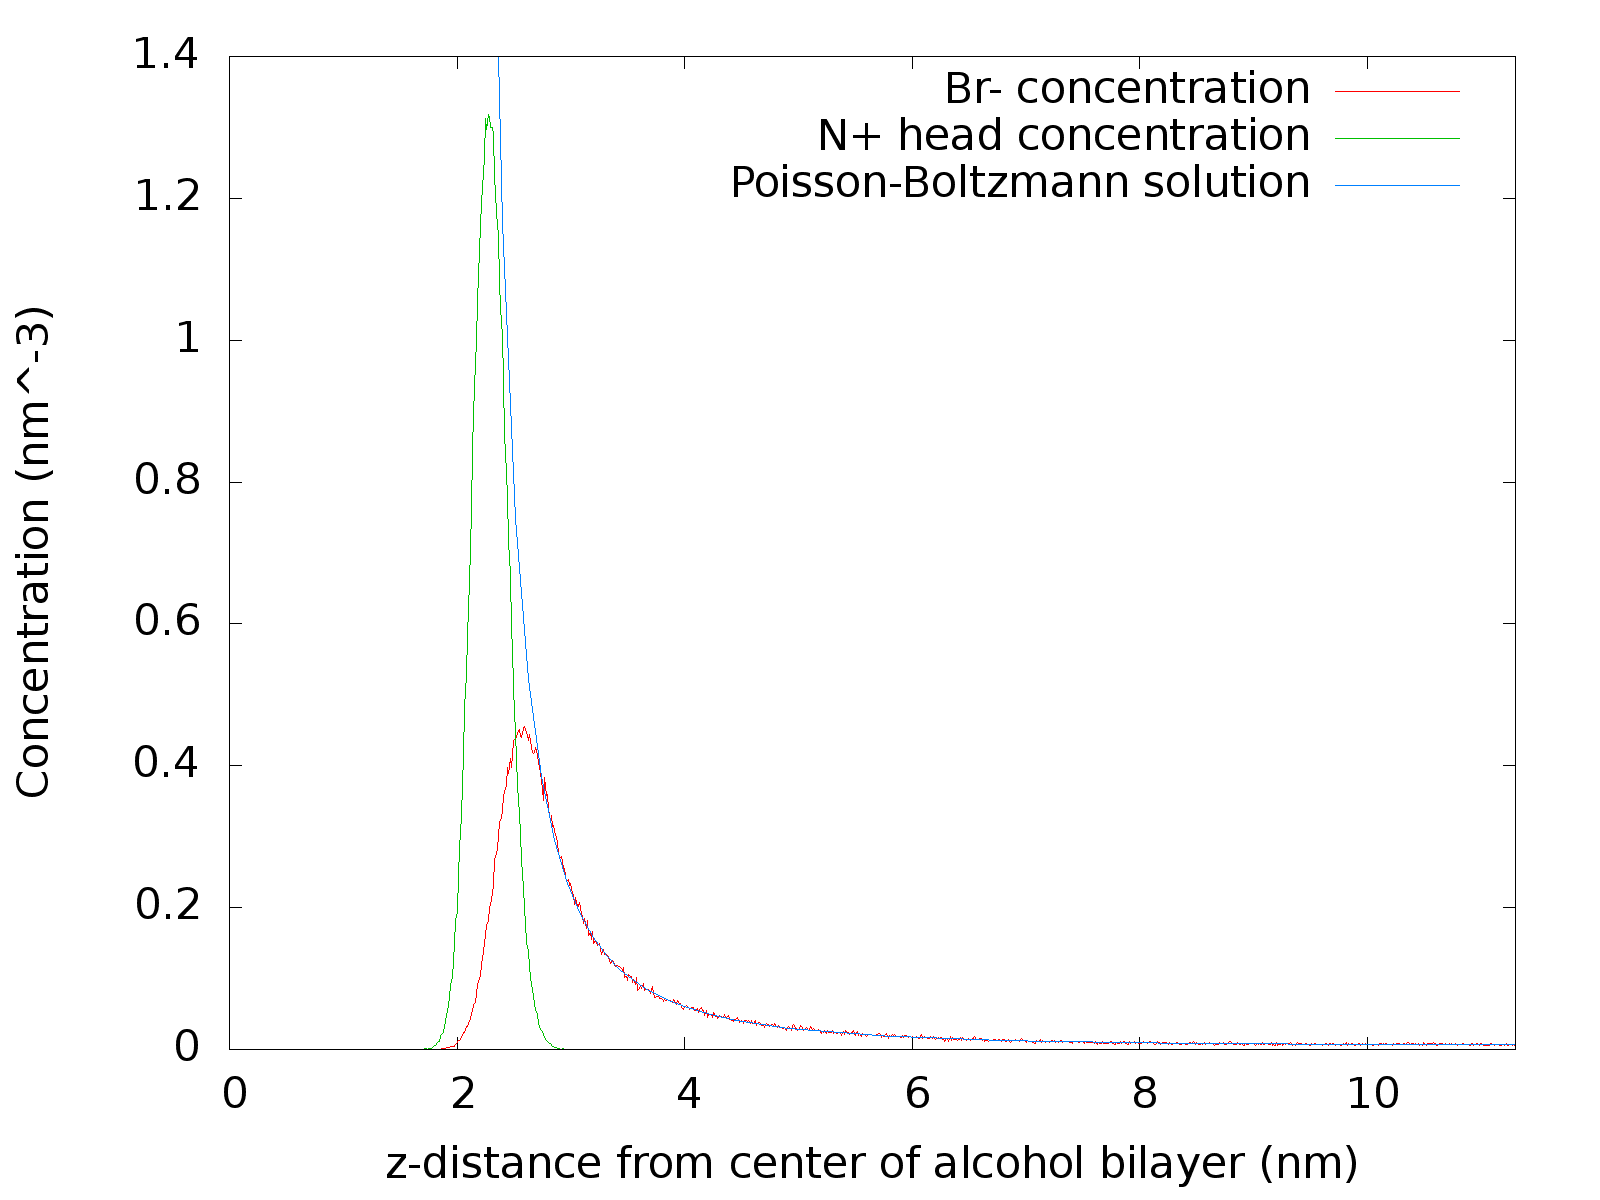
In Fig. 5, typical concentrations of the positive charges of the bilayer head group represented by the atom N+, of the negative mobile counterions Br-, and the fitted PB solution are plotted. The PB solution shows an excellent agreement to our simulated counterion profile suggesting this meanfield theory is highly applicable for calculation of electrostatics of our system.
| System | (nm) | (nm) | (nm3) | (nm) | |
|---|---|---|---|---|---|
| 0CET | 6.038 | 76.85 | 18.51 | 1159.9 | 4.88 |
| 30CET | 6.019 | 75.10 | 18.44 | 1160.1 | 4.74 |
| 50CET | 6.015 | 74.59 | 18.42 | 1162.4 | 4.60 |
| 70CET | 5.896 | 73.99 | 18.32 | 1158.7 | 4.56 |
| 100CET | 5.880 | 74.02 | 18.30 | 1160.6 | 4.38 |
Table 3 shows the fitting results for various parameters. One sees that the “effective” dielectric constant of our systems is about 75, which is 10% smaller than the known dielectric constant of bulk water in TIP3P model of 82 Kusalik and Svishchev (1994). Obviously, the presence of the hydrophobic hydrocarbon tail of the bilayer molecules leads to this decrease in the effective dielectric constant as one expects. Knowing and , one can calculate the thickness of the water layer from Eq. (2). This value is listed in column 3 of the Table 3. Although, decreases slightly with increasing cetyl percentage, the total water volume nm3 shown in column 4 is the same for all systems. This is because the same number of water molecules are simulated in all systems. The fitting result shows the consistency of our parameters.
Finally, knowing , one can calculate the thickness of the bilayer as seen electrostatically by the counterions as . Column 5 of Table 3 lists these values for our systems. Clearly as the percentage of shorter cetyl molecules increases, the thickness of the bilayer decreases correspondingly. The total decrease in bilayer thickness from 100% stearyl system to 100% cetyl system is 0.5 nm. Thus, the positively charged cetrimide molecules layers shrink together with the bilayer.
III.3 The effect of mixing ratio of cetyl and stearyl alcohol
In this section, the effect of mixing different ratios of cetyl and stearyl alcohol on the physical properties of the bilayer are investigated. As we already mentioned in the previous section, the lateral area of the alcohol is very weakly dependent on the length of the hydrocarbon, and more on the interaction of the head groups. However, one expects in the -component, the length of the hydrocarbon would dictate the thickness of the bilayer as well as regulate the interaction among different bilayers. This is indeed what we observed. Table 2 shows that as the percentage of the cetyl alcohol molecules increases, the dimension of our box decreases monotonically from 23.380.09 nm to 22.680.09 nm. Since the total amount of water and the pressure are the same for all systems considered, this means the membrane thickness decreases by 0.155 0.03 nm per CH2 group (note that the stearyl alcohol bilayer is longer than the cetyl alcohol bilayer by 2 carbon atoms per leaflet, or 4 carbon atoms per bilayer). Accidentally, this is almost the same as the typical length of a CC bond of 0.154 nm, but that does not mean the hydrocarbon chain is stretched because this length also has to account for the inter-space between the leaflets. Additionally, the shorter hydrocarbon also make the individual molecules tilt more from the axis making the apparent bilayer thickness decreases more.
As it is already known from the experiment data, after a few weeks, the cetyl/stearyl mixture are always more stable than either pure or stearyl alone. It is believed that the reason why the alcohol mixtures is more stable is due to alkyl chain length mismatch Iwata (2017); Snyder et al. (1983). The roughness and irregularities in the leaflets can lead to higher configuration space for the tip of the hydrocarbon tails, as compared to mostly trans configuration for pure alcohol bilayers. Of course, within computer simulation, it is an impossible task to simulate the systems at the length scale of weeks required for stability analysis. Nevertheless, within our micro second time scale, one is already able to elucidate aspects of the molecular picture of the increased configuration space of the tail tips. This is indeed the case from our simulation results.
| Catom | 100STE | 70STE | 50STE | 30STE | 30CET | 50CET | 70CET | 100CET |
|---|---|---|---|---|---|---|---|---|
| 2 | 0.300 | 0.285 | 0.278 | 0.269 | 0.319 | 0.310 | 0.306 | 0.295 |
| 3 | 0.412 | 0.399 | 0.391 | 0.384 | 0.419 | 0.411 | 0.409 | 0.403 |
| 4 | 0.448 | 0.440 | 0.435 | 0.430 | 0.450 | 0.447 | 0.445 | 0.442 |
| 5 | 0.462 | 0.458 | 0.455 | 0.453 | 0.463 | 0.461 | 0.460 | 0.458 |
| 6 | 0.467 | 0.465 | 0.463 | 0.461 | 0.467 | 0.465 | 0.464 | 0.462 |
| 7 | 0.470 | 0.467 | 0.466 | 0.465 | 0.469 | 0.467 | 0.467 | 0.465 |
| 8 | 0.471 | 0.469 | 0.468 | 0.466 | 0.469 | 0.468 | 0.468 | 0.466 |
| 9 | 0.471 | 0.470 | 0.468 | 0.467 | 0.470 | 0.469 | 0.468 | 0.466 |
| 10 | 0.471 | 0.469 | 0.468 | 0.466 | 0.470 | 0.468 | 0.467 | 0.465 |
| 11 | 0.470 | 0.468 | 0.467 | 0.465 | 0.468 | 0.466 | 0.466 | 0.464 |
| 12 | 0.468 | 0.466 | 0.464 | 0.462 | 0.465 | 0.462 | 0.462 | 0.459 |
| 13 | 0.463 | 0.460 | 0.458 | 0.454 | 0.458 | 0.452 | 0.453 | 0.450 |
| 14 | 0.454 | 0.449 | 0.447 | 0.442 | 0.446 | 0.439 | 0.438 | 0.431 |
| 15 | 0.436 | 0.427 | 0.420 | 0.414 | 0.418 | 0.407 | 0.404 | 0.392 |
| 16 | 0.414 | 0.396 | 0.385 | 0.371 | 0.383 | 0.369 | 0.363 | 0.347 |
| 17 | 0.375 | 0.346 | 0.331 | 0.311 | ||||
| 18 | 0.332 | 0.296 | 0.279 | 0.256 |
In order to analyze this configuration entropy of the chain tips, one calculates the deuterium order parameter, . This is a sensitive measure of the structural orientation and flexibility of the alcohol molecules in the bilayers (for review, see Ref. Vermeer et al. (2007)). Its definition is given by
| (4) |
where the time dependent is the angle between the CD (H atom in our case) bond vector and a reference axis ( axis in our case). For ideal perfect crystal phase, the CH bond lies perpendicular to the axis, this order parameter is . For very flexible bond, such as at very higher temperature, this bond can adopt all available directions and this order parameter is 0. The value varies in the range 0 to 0.5 dependent on the order in the system.
On the table Table. 4, the deuterium order parameter, for each methyl group along the hydrocarbon tails is listed for the longer stearyl and shorter cetyl alcohols. One can obtain many important conclusions from this table. First of all, in the middle of the chains, all the methyl groups have regardless of the mixing ratio. This is also the highest value of this order parameter among all methyl groups. Therefore, one can conclude that the middle of the hydrocarbon chain remain highly ordered and is unaffected by the length mismatch of the alkyl chains. The role of the middle methyl groups is to maintain the structures of the gel or crystal phase.
The second observation one sees from this table is that the tail of the stearyl becomes more flexible, with decreasing order as the mixing percentage of cetyl increases. This trend happens for both tips of the chain (near the head group and near the end chain). The behaviour is opposite for the cetyl alcohol molecules. As one increases the mixing ratio of stearyl alcohol, the cetyl molecule becomes more ordered with increases. Same as for stearyl alcohol, this trend happens to both tips of the chains. Thus, our molecular analysis of the order parameters supports the argument of stability observed experimentally by confirming an increase in configuration entropy of the tips due to the length mismatch. Our results pointed out further that this effect works on the longer chain only. The shorter chain is squeezed and becomes more ordered upon mixing.
The increased disorder of the longer chain, and increased order of the shorter chain also show up when one calculates the area per molecules for individual species. This can be done by projecting the oxygen atom of the polar head group of each alcohol and perform a voronoi construction to calculate the area per lipid for individual molecules. The results after averaging are listed in Table 5. One can observe the same disorder for mixed system similar to the deuterium order parameter analysis. For pure alcohol systems, the standard fluctuations in the area per lipid for both cetyl and stearyl molecules are smaller, 0.09Å2. However, in mixed systems, the magnitude of fluctuations increases by 20-100% to the values 0.11-0.19Å2. This matches with the physical picture that mixed systems causes higher configurational entropy. Additionally, the mean values of the area per lipid increases for the longer stearyl molecule upon mixing, while the mean value for the area per lipid decreases for the shorter cetyl alcohol. This also agree with the more order structure of cetyl alcohol in the bilayer upon mixing with longer alcohol.
| System | Stearyl | Cetyl | Cetrimide |
|---|---|---|---|
| 0CET | 19.300.09 | 19.760.31 | |
| 30CET | 19.370.11 | 19.410.18 | 19.800.32 |
| 50CET | 19.410.14 | 19.480.14 | 19.830.32 |
| 70CET | 19.450.19 | 19.500.11 | 19.840.32 |
| 100CET | 19.550.09 | 19.880.33 |
Overall, our analysis supports the current experimental point of view that the stability of our mixed ternary system at long time scale is due to an increase in the configurational entropy of the chain tips due to length mismatch. This leads to more flexibility of the bilayer to relax and fluctuations around equilibrium concentration. At the same time, we show that in the middle of the chain, the shorter alkyl becomes stiffer.
IV Conclusion
In this paper, we investigate the structure of cetyl and stearyl alcohol bilayers at different mixing ratios by using atomistic computer simulation. Unlike typical unified atom models, our atomistic model allows one to study additional details in the bilayer such as the deuterium order parameters, area per molecule and fluctuations. The forcefield for our molecules was derived from quantum mechanical calculations and general Amber forcefield for biomolecules.
Structurally, our results agree well with various Xray experiment data on the system. At the temperature studied of 27∘, all our systems exhibit the lamellar phases, specifically the gel and phases, where the local order is hexagonal. The nearest neighbor distance is found to be 4.69Å matches the experimental result. The area per molecule of the cetostearyl alcohol ternary system is numerically found to be 19.5Å2, lying within 5% of the experiment value. The electrostatics in the system is well described by the meanfield PoissonBoltzmann theory with effective dielectric constant reduced compared to bulk water by 10%.
The effect of mixing ratio on the stability of the alcohol ternary system is studied by investigating various molecular order parameters in our system. The experimental hypothesis for the observed stability of mixed system, as compared to pure alcohol system, is that this is probably due to the increased configurational entropy of individual molecules of the longer alkyl chains. Our analysis of the ordering of molecules in the bilayer supports this hypothesis. The deuterium order parameter for the methyl group at the chain tips for the longer stearyl alcohol decreases upon mixing. Our simulation results provide additional details to this hypothesis, showing that the shorter molecule becomes more ordered upon mixing, leaving more available space to the longer molecule. The inplane projection for the area per molecule for this species also show stronger fluctuation upon mixing as compared to pure alcohol systems. The shorter molecules is also shown to have difficulty keeping the cetrimide remaining in the bilayer at the simulated molar ratio of various species. It suggests that these system would more stable at lower water and/or cetrimide molar ratio.
Overall, through detail atomistic simulation at one microsecond time scale, we are able to elucidate and quantify several important atomistic details of the mechanism for stability of ternary systems that support current dominant hypothesis as well as the atomistic structure of the bilayer gel.
Acknowledgements.
We would like to thank the financial support of the Vietnam National Foundation for Science and Technology NAFOSTED grant number 104.99-2016.39.References
- G.M.Eccleston (1997) G.M.Eccleston, Colloids and Surfaces A: Physicochemical and Engineering Aspects 123-124, 169 (1997).
- Junginger (1984) H. E. Junginger, Pharmaceutisch Weekblad Scientific Edition 6, 141 (1984).
- Iwata (2017) T. Iwata, Pharm. Tech. Japan 33, 75 (2017).
- G.M.Eccleston (1985) G.M.Eccleston, International Journal of Pharmaceutics 27, 311 (1985).
- Eccleston (1977) G. M. Eccleston, Journal of Pharmacy and Pharmacology 29, 157 (1977).
- Snyder et al. (1983) R. G. Snyder, M. Maroncelli, H. L. Strauss, C. A. Elliger, D. G. Cameron, H. L. Casal, and H. H. Mantsch, Journal of the American Chemical Society 105, 133 (1983), https://doi.org/10.1021/ja00339a033 .
- Ferrando et al. (2009) N. Ferrando, V. Lachet, J.-M. Teuler, and A. Boutin, The Journal of Physical Chemistry B 113, 5985 (2009), pMID: 19344171, https://doi.org/10.1021/jp810915z .
- Jämbeck and Lyubartsev (2012) J. P. M. Jämbeck and A. P. Lyubartsev, The Journal of Physical Chemistry B 116, 3164 (2012), pMID: 22352995, https://doi.org/10.1021/jp212503e .
- Jämbeck and Lyubartsev (2013) J. P. M. Jämbeck and A. P. Lyubartsev, Journal of Chemical Theory and Computation 9, 774 (2013), pMID: 26589070, https://doi.org/10.1021/ct300777p .
- Eccleston et al. (2000) G. Eccleston, M.K, Behan-Martina, G.RJones, and ETowns-Andrews, International Journal of Pharmaceutics 203, 127 (2000).
- Darden et al. (1993) T. Darden, D. York, and L. Pedersen, J. Chem. Phys. 98, 10089 (1993), https://doi.org/10.1063/1.464397 .
- Berendsen et al. (1995) H. J. Berendsen, D. van der Spoel, and R. van Drunen, Computer physics communications 91, 43 (1995).
- Abraham et al. (2015) M. J. Abraham, T. Murtola, R. Schulz, S. Páll, J. C. Smith, B. Hess, and E. Lindahl, SoftwareX 1, 19 (2015).
- Humphrey et al. (1996) W. Humphrey, A. Dalke, and K. Schulten, Journal of Molecular Graphics 14, 33 (1996).
- Guixà-González et al. (2014) R. Guixà-González, I. Rodriguez-Espigares, J. M. Ramírez-Anguita, P. Carrió-Gaspar, H. Martinez-Seara, T. Giorgino, and J. Selent, Bioinformatics 30, 1478 (2014).
- Fukushima et al. (1976) S. Fukushima, M. Takahashi, and M. Yamaguchi, Journal of Colloid and Interface Science 57, 201 (1976).
- Fukushima et al. (1977) S. Fukushima, M. Yamaguchi, and F. Harusawa, Journal of Colloid and Interface Science 59, 159 (1977).
- Langmuir (1917) I. Langmuir, Proceedings of the National Academy of Sciences of the United States of America 3, 251 (1917).
- Landau and Lifshitz (2013) L. Landau and E. Lifshitz, Statistical Physics, Vol. 5 (Elsevier Science, 2013).
- Netz (2001) R. R. Netz, Eur. Phys. J. E 5, 557 (2001).
- Moreira and Netz (2002) A. G. Moreira and R. R. Netz, Eur. Phys. J. E 8, 33 (2002).
- Andelman (1995) D. Andelman, in Handbook of Biological Physics, Vol. 1, edited by E. S. R. Lipowsky (Elsevier Science B.V., Amsterdam, The Netherlands, 1995) Chap. 12, pp. 603–642.
- Schlaich et al. (2016) A. Schlaich, E. W. Knapp, and R. R. Netz, Phys. Rev. Lett. 117, 048001 (2016).
- Kusalik and Svishchev (1994) P. G. Kusalik and I. M. Svishchev, Science 265, 1219 (1994).
- Vermeer et al. (2007) L. S. Vermeer, B. L. de Groot, V. Reat, A. Milon, and J. Czaplicki, Eur. Biophys. J. 36, 919 (2007).