Nonmagnetic substitution in pyrochlore iridate Y2(Ir1-xTix)2O7: Structure, magnetism and electronic properties
Abstract
Tuning of spin-orbit coupling and electron correlation effects in pyrochlore iridates is considered for many interesting phenomena. We have investigated the temperature evolution of structural, magnetic and electronic properties in doped Y2(Ir1-xTix)2O7 ( = 0.0, 0.02, 0.05, 0.10 and 0.15) where the substitution of nonmagnetic Ti4+ (3) for Ir4+ (5) amounts to dilution of magnetic network and tuning of these parameters in opposite way. The system retains its original structural symmetry but local structural parameters show an evolution with Ti content. While the magnetic transition temperature is not largely influenced, both magnetic moment and magnetic frustration decreases with Ti doping. Magnetic relaxation measurement shows the parent compound Y2Ir2O7 as well as its Ti doped analogues are in nonequilibrium magnetic state where the magnetic relaxation rate increases with Ti. Temperature dependent Raman measurements indicate no changes in structural symmetry, however, across the magnetic transition temperature an anomaly in A1g Raman mode is observed. Temperature dependent x-ray diffraction data also support the Raman spectroscopy data, however, an evolution of lattice parameters with temperature is observed. The electrical resistivity data of Y2(Ir1-xTix)2O7 series exhibits insulating behavior throughout the temperature range, however, the resistivity decreases with Ti doping. The nature of charge conduction is found to follow power-law behavior in whole series but the validity of this model varies with temperature. A negative magnetoresistance has been observed at low temperature in present series which is explained with weak localized mechanism. Similar to other Ir based oxides, a crossover from negative to positive MR has been observed in present system.
pacs:
75.47.Lx, 71.70.Ej, 61.20.Lc, 78.30.-jI Introduction
In recent times, physics driven interplay between spin-orbit coupling (SOC) and electronic correlation () has generated lot of interest as it promises to host many topological phases of mater.pesin ; william The 5 based iridium oxides are of particular interest as SOC effect becomes very prominent in these materials ( 0.5 eV) due to heavy character of Ir. Moreover, with relatively weaker in 5 orbitals, these materials exhibit a comparable scale between relevant energies such as, SOC, and crystal field effect. This offers an ideal playground to study the fascinating physics which comes out as an interplay between these competing parameters. Pyrochlore based structures (A2Ir2O7 where A = trivalent rare earth elements) further add interest due to its structural arrangement where the A and Ir atoms form corner shared interpenetrating tetrahedra which introduces geometrical frustration and resultantly new physics.gingras ; yoshii ; gardner1 ; nakatsuji ; bramwell ; fukazawa1 Theoretical calculation further suggests that inclusion of Dzyaloshinskii-Moriya (DM) type interaction in original nearest-neighbor Heisenberg model which basically generates frustration and hiders magnetic transition at low temperature, induces a long-range ordered magnetic transition at low temperature.elhajal This is important at the backdrop of pyrochlore iridates given that these materials simultaneously possess geometrical frustration and reasonable SOC where the later acts as an ingredient for DM interaction. Pyrochlore iridates mostly exhibit antiferromagnetic (AFM) insulating phase at low temperature, however, their physical properties notably evolve with A-site element: from magnetic insulating to paramagnetic (PM) metallic phase.Matsuhira
The Y2Ir2O7 is an interesting compound among pyrochlore iridates because it has nonmagnetic Y3+ at A-site which excludes the possibility of f-d exchange interactions.chen In this sense, the magnetic properties are mostly governed by the Ir-sublattice. The Y2Ir2O7 is a strong insulator and exhibits a bifurcation between zero field cooled and field cooled magnetization data at 160 K.shapiro ; disseler ; taira ; fukazawa ; soda ; zhu ; harish There are, however, contradictory data about the low temperature magnetic state in Y2Ir2O7. The muon spin relaxation results show a long-range ordered magnetic state while the neutron diffraction experiments apparently find no sign of magnetically ordered state within the accuracy of instrument.disseler ; shapiro In another study, weak ferromagnetism (FM) with AFM background is reported for Y2Ir2O7.zhu Recently, using magnetic relaxation measurements a nonequilibrium magnetic state in Y2Ir2O7 and its Ru doped samples is reported at low temperature.harish ; kumar Theoretical calculation has predicted Y2Ir2O7 a possible candidate for novel Weyl semimetal with all-in/all-out (AIAO) type AFM spin order.wan Further band calculations employing DFT+DMFT, LDA+DMFT and LSDA+ techniques have shown a transition to an AIAO-type AF state with varying , however, the threshold value of is not uniquely defined.shinaoka ; Ishii ; Hon Here to be noted that photoemission spectroscopy data suggest 4 eV in Y2Ir2O7 which is surprisingly high for 5 electron systems.kalo Therefore, Y2Ir2O7 definitely comes out as good model system to tune the relative strength of SOC and and study its interplay.
With an aim to study the effect of site dilution as well as to tune the both SOC and , we have substituted Ti at Ir-site in Y2Ir2O7. The Ti4+ (3) being a nonmagnetic, one would expect a magnetic dilution and opposite modification of SOC and parameters accordingly. Therefore, Ti4+ sitting at the vertices of Ir tetrahedra will alter the magnetic interaction and electronic charge conduction accordingly. Moreover, Ti4+ and Ir4+ has comparable ionic radii, thus no major structural modifications would be expected in this series. This being important as structural distortion in the pyrochlore iridates has been shown to have significant influences on the electronic and magnetic properties.yang
Our studies show original cubic structural is retained in Y2(Ir1-xTix)2O7 though an evolution of structural parameters have been observed. The parent Y2Ir2O7 shows magnetic irreversibility around 160 K which monotonically decreases with Ti content. Furthermore, both the magnetic moment and the level of frustration decreases with Ti substitution. Y2Ir2O7 shows a nonequilibrium low temperature magnetic state as revealed by magnetic relaxation data, however, relaxation rate increases with Ti. An anomaly in temperature evolution of Raman mode frequency and linewidth is observed around Tirr for = 0.0 and 0.15, however, the magnetic transition at is not accompanied with structural phase transition as confirmed from x-ray diffraction data. The insulating behavior in Y2Ir2O7 is retained with Ti substitution. The charge conduction follows the power-law behavior for each sample in present series. However, we find that the temperature range for validity of power-law behavior changes with compositions.
II Experimental Details
Polycrystalline samples of Y2(Ir1-xTix)2O7 series with = 0.0, 0.02, 0.05, 0.10 and 0.15 have been prepared by solid state reaction following the method described in earlier reports. harish ; kumar The structure and phase purity of these materials have been characterized by powder x-ray diffraction (XRD) using a Rigaku made diffractometer with CuKα radiation. XRD data are collected in the range of 2 = 10 - 90o at a step of = 0.02o and with a scan rate of 2o/min. Temperature dependent XRD data have been collected using a PANalytical X’Pert powder diffractometer at different temperatures in the range of 20 - 300 K. The low temperature is achieved using a helium close cycle refregerator (CCR) based cold head where proper temperature stabilization is ensured by waiting sufficiently before collecting the data. The collected XRD data have been analyzed using Rietveld refinement program (FULLPROF) by Rodriguez et al.Rodriguez DC Magnetization () measurements have been carried out with a vibrating sample magnetometer (PPMS, Quantum Design). Temperature dependent Raman spectra have been collected using Diode based laser ( = 473 nm) coupled with a Labram-HR800 micro-Raman spectrometer. Electrical transport properties have been measured using a home-built insert fitted with Oxford superconducting magnet.
III Results and Discussions
III.1 Structural analysis
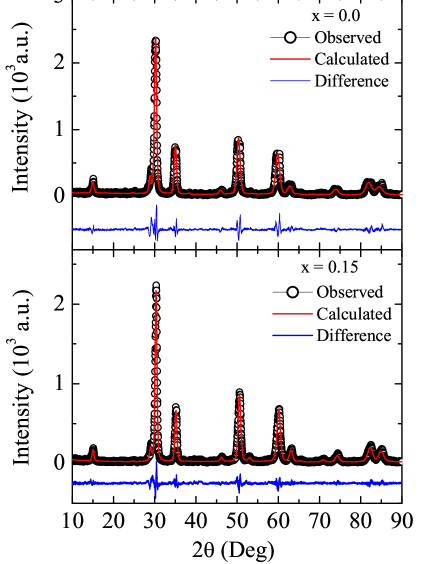
Figure 1(a) and (b) show room temperature XRD data along with Rietveld analysis for the parent with = 0 and for highest doped material with = 0.15, respectively. The XRD pattern for the parent material is already reported in our earlier studies,harish ; kumar ; hkumar and this closely match with other studies.disseler ; shapiro ; zhu The Rietveld refinement of the XRD data shows Y2Ir2O7 crystallizes in Fdm cubic symmetry with lattice constant = 10.2445 Å. The analysis of XRD data for present series suggest that the same crystallographic structure and symmetry is retained with Ti substitution which is also expected from the matching ionic radii of Ir4+ (0.625 Å) and Ti4+ (0.605 Å). The ratio /, which is known as goodness of fit (GOF), is found to be around 1.96, 1.95, 1.92, 1.85, and 1.46 for x = 0.0, 0.02, 0.05, 0.1 and 0.15, respectively, which is indicative of good fitting. The Rietveld analysis indicates an evolution of structural parameters with as shown in Fig. 2. The unit cell lattice parameter decreases with Ti concentration (Fig. 2a). This change in is not substantial as we calculate the change is about -0.34 % over the series. The decrease in the value of lattice parameter with Ti concentration can be explained by the reduced ionic size of Ti4+ compared to Ir4+.
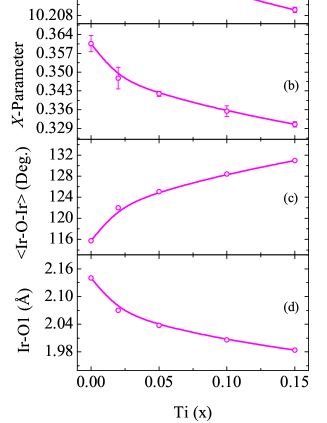
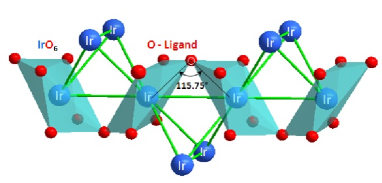
The variation in structural parameters play an important role in determining the electronic and magnetic properties of a material, in general. There are two adjustable parameters in pyrochlore structure, lattice constant () and the coordinate of oxygen site (). Apart from the cubic lattice parameter , the structural organization of IrO6 octahedra is also important. In present pyrochlore structure, the IrO6 octrahedra are connected through oxygen atom i.e., corner oxygen atom is shared between adjacent octahedra. Moreover, in individual octahedra, the six Ir-O bonds have equal length. However, the position of oxygen provides a measure of the distortion of the IrO6 octahedra. For instance, with = 0.3125 implies octahedra are perfect and undistorted where Ir ions are under the perfect cubic field. Deviation of from this ideal value generates a distortion to octahedra which lowers the cubic symmetry and induces trigonal crystal field.JP ; Hozo The value for this series is shown in Fig. 2b. For Y2Ir2O7, the value has been found to be 0.36 which implies IrO6 octahedra are distorted and compressed. With substitution of Ti, value decreases with increasing Ti substitution. This decrease of value suggests that system is heading toward perfect octahedra, hence trigonal crystal field is reduced. The Ir-O-Ir bond angle and the Ir-O bond length have also significant role on orbital overlapping and charge transfer mechanism, thus those contribute to the electronic properties enormously. The straightening of Ir-O-Ir bond with angle value 180o realizes a situation where two corner sharing IrO6 octahedra have two IrO4 plaquettes on the same plane and favors maximum electrons hopping between two iridium atoms via oxygen atom. The bending of the Ir-O-Ir bond consequently narrows down the bandwidth and leads to smaller hopping of the electrons along Ir-O-Ir channel. The schematic of Ir-O bond angle and length along with IrO6 octahedra is shown in Fig. 3. Similarly, a shorter Ir-O distance can enhance the overlapping between Ir(5d) and O(2p) orbitals, leading to larger the hopping of the Ir electrons. An evolution of Ir-O-Ir bond angle and Ir-O bond length for present series is shown in Fig. 2c and d, respectively. With the substitution of Ti, bond-length and bong angle decreases and increases, respectively where both structural modifications are in favor of maximizing the orbital overlapping, hence the electron transport mechanism.
III.2 Magnetization study
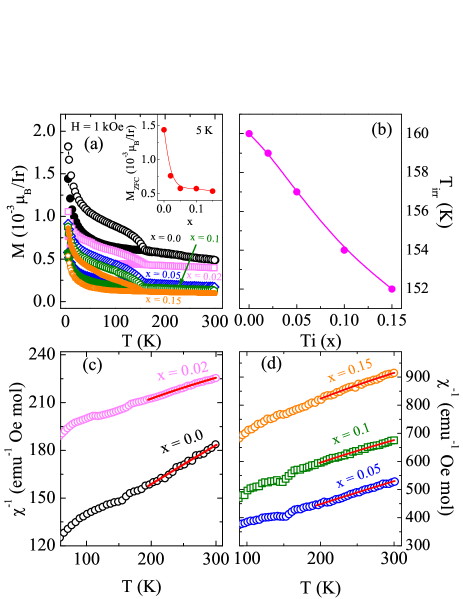
Temperature dependent magnetization data measured in 1000 Oe field under the zero field cooled (ZFC) and field cooled (FC) protocol are shown in Fig. 4a for the series Y2(Ir1-xTix)2O7. It is seen in Figure, the ZFC and FC branches of magnetization for parent compound exhibits a clear magnetic irreversibility around 160 K, below which a large bifurcation between magnetization branches is observed.harish It can be noted that does not show any cusp or peak around the . Given that low temperature magnetic state in Y2Ir2O7 is debated showing possible presence of long-range magnetic ordering or nonequilibrium ground state,disseler ; shapiro ; harish ; kumar the dilution of magnetic lattice with substitution of nonmagnetic Ti4+ will be quite interesting. As evident in Fig. 4a, the notable observations are, bifurcation temperature shifts toward low temperature, difference between and decreases and the low temperature magnetic moment decreases. The inset of Fig. 4a shows moment at 5 K initially rapidly decreases with Ti doping, however, for higher value of () the decrease is not substantial. Similarly, the variation of with is shown in the Fig. 4b which shows decreases only by 8 K with 15% of Ti substitution. This is rather surprising with present nonmagnetic Ti4+ as previous study with magnetic substitution in Y2(Ir1-xRux)2O7 shows substantial decrease of ( 40 K) with similar doping concentration.kumar
To understand the magnetic state in further detail, we have plotted inverse susceptibility () as a function of temperature for this series in Fig. 4c ( = 0.0, 0.02) and 4d ( = 0.05, 0.1, 0.15). As evident, the data almost show linear behavior above . The data have been fitted in high temperature range (200 - 300 K) with modified Curie-Weiss law;
| (1) |
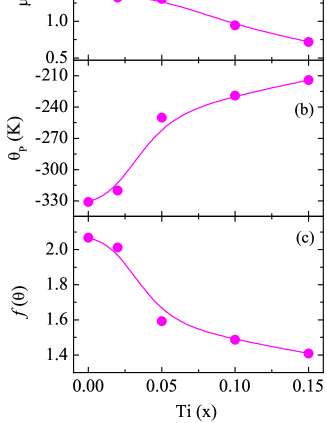
where , , and are the temperature independent magnetic susceptibility, the Curie constant, and Curie-Weiss temperature, respectively. For = 0.0 parent material, the obtained fitted parameters are = 9.7 10-4 emu/mole, = 2.83 emu K/mole and = -331 K.kumar Using the fitted parameter , we have calculated the effective paramagnetic moment = 2.37 /Ir for = 0.0 which appears higher than the expected value () 1.73 /Ir in case of spin-only value ( = 2 and = 1/2). Fig. 5(a) shows the composition dependent for Y2(Ir1-xTix)2O7 series. As evident in figure, the value of decreases with Ti substitution. Ti is assumed to adopt Ti4+ (3, = 0) which implies a decrease of in present series. The composition dependent is plotted in Fig. 5b shows its magnitude decreases with . The sign as well as magnitude of suggest an antiferromagnetic type interaction type magnetic interaction with reasonable strength. The nature of evolution of underlines the fact that nature of magnetic interaction remains to be antiferromagnetic type interaction but its strength is weakened with introduction of Ti. We have further calculated the relevant frustration parameter which is defined as the ratio /. These pyrochlore structures are inherently frustrated due to their geometrical configuration and often leads to different magnetic ground states such as, spin-glassgingras ; yoshii , spin-liquid gardner1 ; nakatsuji , spin-ice bramwell ; fukazawa1 , etc. For example, corresponding values for highly frustrated pyrochlore oxides such as, Y2Ru2O7 and Y2Mo2O7 are about 16 and 8.8, respectively which exhibit spin-glass behavior.kmiec ; Gardner . Fig. 5 (c) shows the is reasonable in parent compound though decreases with Ti. It is interesting to observe in Fig. 5 that all the parameters (, and ) exhibit rapid changes with initial doping concentration of Ti till = 0.05 and then a slow evolution at higher Ti doping which is also consistent with value at 5 K (inset of Fig. 4a).
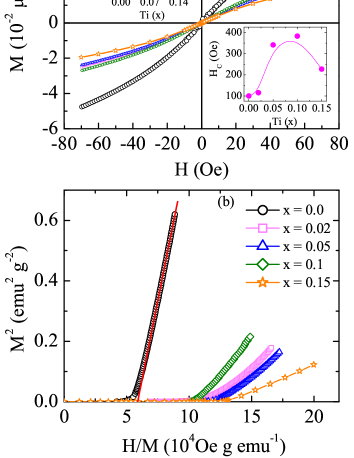
The magnetic field dependent of magnetization data collected at 5 K in the field range of 70 kOe have been shown in Fig. 6a. As evident in figure, the data for the = 0.0 parent material does not show linear behavior and the magnetization increases continuously without showing any saturation till 70 kOe. With Ti substitution, the moment at high field decreases though not linearly as expected from site dilution with nonmagnetic element. The upper inset of Fig. 6a shows variation of with . Further, a close observation of data shows a small hysteresis with coercive field 100 Oe at 5 K for Y2Ir2O7. The initially increases with and then decreases at higher doping (lower inset in Fig. 6a) which is indicative of increasing FM behavior. To understand the nature of magnetic state in further detail, we have plotted the data in form of Arrott plot ( vs ).arrott Fig. 6b shows the Arrott plot of data as shown in Fig. 6a. The detail significance of Arrott plot is discussed elsewhere.harish ; kumar As evident in Fig. 6b, the intercept of straight line fitting turns out to be negative for all the materials, though we find the negative value decreases with Ti doping. This indicates low temperature magnetic state in the Y2Ir2O7 is not FM type, and Ti substitution reduces the non-FM character in this series which is also supported by the fact that increases in this series.
Above discussion of magnetic behavior in Y2(Ir1-xTix)2O7 series imply that both the magnetic moment as well as level of frustration decreases with Ti which is quite interesting (Figs. 4a, 5a and Fig. 5c). The substitution of nonmagnetic Ti4+ (3) for Ir4+ (5) will unlikely introduce its own magnetic interaction and it will act for site dilution. Due to high crystal field splitting in 5 materials, all the five electrons will occupy the low energy level. It is commonly believed that the strong SOC effect further splits the level into = 1/2 doublet and = 3/2 quartet where the latter has low energy.kim This gives a situation of partially filled = 1/2 state where the Fermi level EF resides. In picture of strong SOC, therefore, Ir4+ gives moment () value 0.33 . This further argues that in presence of on-site Coulomb repulsion , a Mott-like gap is driven in the = 1/2 state which makes these materials insulator. The suppression of the magnetic moment in Y2(Ir1-xTix)2O7 can be explained as Ti will simply dilute the observed magnetic moment. The similar weakening of magnetic ordering and insulating state has previously been observed in Y2Ir2O7 with magnetic Ru4+ substitution kumar , however, effect of Ru appears stronger than Ti. The Ti being a 3 element has comparatively higher electron correlation effect than Ru. Whether this plays a role for small decrease of in Y2(Ir1-xTix)2O7 need to be investigated throughly. Nonetheless, Ru doping in different iridate materials has shown a common trend of suppressing magnetic state.kumar ; cava ; yuan ; calder Note, that Ti substitution in other Ir based materials has shown similar rather interesting results. For example, in Sr2IrO4 the moment is seen to decrease with progressive Ti content.Gatimu ; ge In case of Na2Ir1-xTixO3, the similar weakening of magnetic ordering is observed, though the system evolved to a glassy state, indicating a presence of strong frustration.Manni Apart from strong SOC picture, recent theoretical studies have further considered the possible influence of non-cubic crystal field such as, trigonal crystal field on the magnetic and electronic properties in iridium oxides.yang ; liu Whether such effects are responsible for present evolution of magnetic behavior needs to be investigated.
| (s) | |||
|---|---|---|---|
| 102 | 0.0 | 5.6 109 | 0.33(1) |
| 0.1 | 4.4 108 | 0.39(1) | |
| 103 | 0.0 | 1.78 109 | 0.41(2) |
| 0.1 | 1.07 108 | 0.50(2) | |
| 104 | 0.0 | 0.10 109 | 0.82(8) |
| 0.1 | 0.41 108 | 0.85(2) |
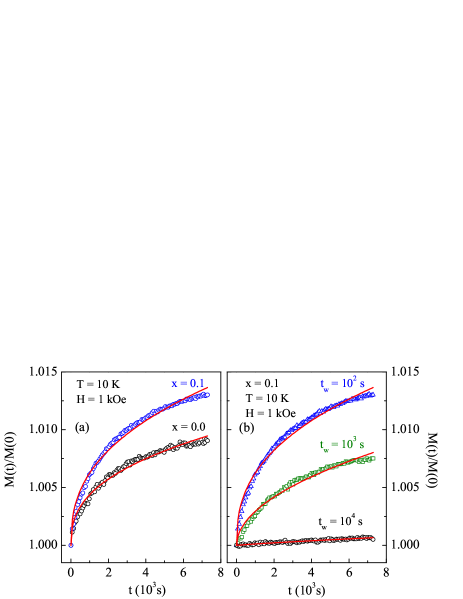
Pyrochlore structures are inherently frustrated due to its geometrical arrangement of magnetic atoms on vertices of tetrahedra. This frustration generates various metamagnetic states including glassy behavior. While for classical magnetic systems the magnetization normally depends only on temperature and magnetic field. However, in metamagnetic states the moment shows an unusual evolution with time () even sample is held at same temperature and field. Additionally, time evolution of magnetic moment shows a dependence on history how magnetic field is applied, a phenomenon called as aging behavior. Recently, we have reported nonequilibrium magnetic state in Y2Ir2O7 at low temperature showing reasonable magnetic relaxation and aging behavior.harish To understand the evolution of relaxation and aging behavior with Ti substitution, we have measured following a protocol where the material is cooled in zero field from room temperature to 10 K. After stabilization of temperature, a magnetic field of 1000 Oe is applied after a wait time and then magnetic moment is measured as a function of time for about 7200 s. Fig. 7a shows normalized relaxation data at = 0 with time for two representative samples i.e., = 0.0 and 0.1 of present series. We find that the magnetization () increases continuously without any saturation for both the materials, however, the relaxation rate is higher in doped sample. This magnetic relaxation in these compounds suggests that the low temperature magnetic state is basically a nonequilibrium state as it tries to achieve low energy state(s) with time crossing the barriers which separate the energy states.
We have further measured magnetic relaxation measurement with different , as presented in Fig. 7b for = 0.1 sample. For the aging measurement, the sample is similarly cooled in zero field and a magnetic field of 1000 Oe is applied after certain . During wait time the system relaxes toward the equilibrium state. The data have been shown for = 102, 103 and 104 s. The normalized relaxation data show relaxation rate diminishes significantly with increasing which implies that the system waits more time at 10 K before applying the field shows less relaxation, thus the magnetic relaxation depends on history how the magnetic field is applied even at the same temperature and with same magnetic field. This indicates that during the wait time, system ages and tries to achieve the low energy state which is evident from low relaxation rate in Fig. 7b.
For quantitative analysis of relaxation data, we find that data can be best explained with stretched exponential function.chamberlin
| (2) |
where is the stretching exponent with 0 1, is the magnetization at = 0 and is the characteristic relaxation time. The stretched exponential form of magnetic relaxation explains well the system which has multiple energy barrier. The solid lines in Figs. 7a and 7b show the fitting of our data using Eq. 2 for different samples and different . The parameters and obtained from the fitting are shown in Table 1 for = 0.0 and 0.1 compound. For = 102 s, decreases by an order while increases in doped sample (Table 1). This decrease of and simultaneous increase of exponent with in doped sample is in agreement with higher relaxation behavior as evident in Fig. 7a. Table 1 further shows this pattern is maintained for all . To understand the effect of , Table 1 shows with increasing the decreases where increases for both the samples which are consistent with slow relaxation with increasing (Fig. 7b). This clearly indicates doped Ti somehow helps the spin system to attain the low-energy equilibrium state at faster rate which is also supported by reduced frustration parameter in doped samples (Fig. 5c).
III.3 Temperature dependent Raman mode study
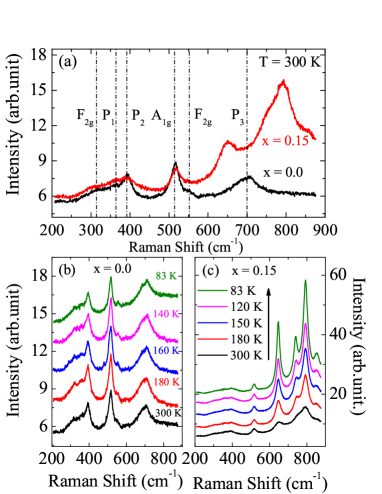
The structural information in present series has further been obtained using Raman spectrum, which is generally sensitive to oxygen-cation vibrations and the identity of pyrochlore structure. The Y2Ir2O7 belongs to the cubic-Fdm structural symmetry which has six Raman active modes that are expected according to group factor, = A1g + Eg + 4F2g. han ; hasegawa ; Jurel These Raman modes involve only the motion of oxygen atoms. Fig. 8a shows Raman spectra collected for two end members of Y2(Ir1-xTix)2O7 series with = 0.0 and x = 0.15 at room temperature. For Y2Ir2O7, six Raman active modes are observed in Fig. 8a which are consistent with the previous Raman data for pyrochlore iridates.han ; hasegawa ; Jurel We observe F2g, P1, P2, A1g, F2g and P3 modes appear at 314, 361, 393, 516, 552, and 700 cm-1. The A1g mode at 516 cm-1 has an important role in pyrochlore structure because it is related to the trigonal distortion of IrO6 octrahedra as well as with the changes of Ir-O-Ir bond angle.Taniguchi As discussed, trigonal distortion of IrO6 octrahedra mainly arises due to the change in value of parameter of oxygen atom (Fig. 2b). Therefore, A1g mode is directly involved in the modulation of parameter of the oxygen atom residing at 48 site.Sanjuan ; tracy Similarly, Eg mode is assigned to IrO6 bending vibrations and F2g relates to the mixture of Y-O and Ir-O bond stretching vibrations.sreena In previous study, the peak P2 at 392 cm-1 is assigned as Eg or F2g.hasegawa Fig. 8b shows the Raman spectrum for Y2Ir2O7 at temperatures 300, 180, 160, 140 and 83 K where the temperatures represent the room temperature PM state (300 K), above (180 K) and below (140 K) the and low temperature state (83 K). It is clear from the figure that Raman spectra does not show any change with temperature in terms of appearing of new mode(s) or mode shifting. This implies that there is no change in structural symmetry with temperature in agreement with the temperature dependent of XRD and neutron scattering measurements.harish ; shapiro On other hand, Raman spectra for = 0.15 material at room temperature (Fig. 8a) shows two new additional peaks at 648, and 792 cm-1 and two humps at 748, and 855 cm-1, however, one original peak at 700 cm-1 is not evident in doped = 0.15 system. These new peaks are commonly found in Ti/Ir based pyrochlores as an intense and broad peak in the frequency range 640 to 900 cm-1,Sanjuan ; tracy and are often assigned to the second order Raman scattering of pyrochlore oxides.Saha ; hasegawa ; Jurel
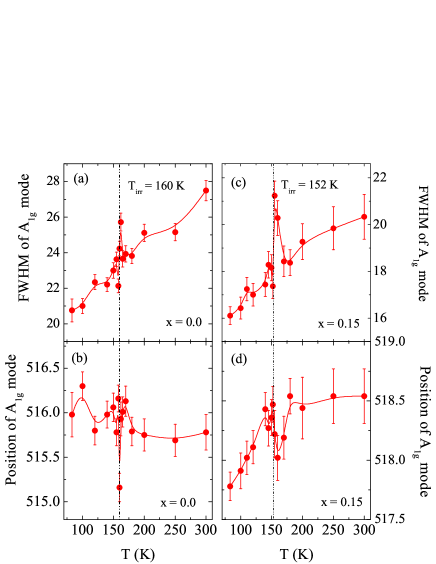
Temperature dependent Raman spectra for = 0.15 sample are shown in Fig. 8c. With decreasing temperature, while there is no change in spectra in low frequency modes but the four new peaks/humps at 648, 748, 792 and 855 cm-1 become more intense and prominent at low temperature. Given that role of A1g mode in pyrochlore structure is important, we have analyzed this mode of Raman data in detail. The evolution of line width as represented by full width at half maximum (FWHM) and the position of A1g mode are shown with temperature in Fig. 9 for = 0.0 and 0.15. For = 0.0, Fig. 9a depicts the FWHM of A1g peak decreases with the decreasing temperature where the change in FHWM is - 24% over this temperature range. It is notable that a distinct peak in FWHM around is observed. The changes of A1g peak position with temperature is presented in Fig. 9b which shows some fluctuations across . Given that A1g mode is directly related to the oxygen parameter, therefore, the observed fluctuations in Fig. 9b is quite consistent with the parameter fluctuation of this materials as reported previously.harish The FWHM and position of A1g mode for the Ti-doped material ( = 0.15) are shown in Figs. 9c and 9d, respectively. The results are quite similar with the parent material in terms of FWHM and frequency fluctuation of A1g peak around respective . This anomaly in Raman data may possibly arise due to sudden rotation/distortion of IrO6 octahedra across . Compared to the parent system, the phonon parameters for the Ti-doped material ( = 0.15) are shifted to low temperature by 8 K, consistent with a suppression of magnetic ordering with Ti doping ( = 0.15) in parent material. Similar evolution of phonon parameters with magnetic ordering has been reported in its Ru doped analogues Y2(Ir1-xRux)2O7 and doped iridate Sr2Ir1-xRuxO4.Jurel ; glama ; cetin
III.4 Temperature dependent structural investigation
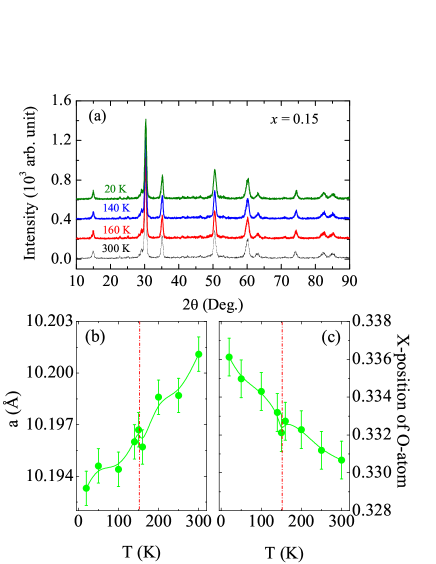
Previous studies imply a strong correlation between the magnetic behavior and the Raman data, therefore it is necessary to understand the evolution of structural parameters with temperature particularly across the . Previous XRD study demonstrate that there is no structural phase transition down to low temperature in Y2Ir2O7 where the parameter related to oxygen position anomalous fluctuation across the .harish With this aim, in present study we have done temperature dependent XRD measurements for = 0.15 material at various temperatures down to 20 K. Fig. 10a shows the representative XRD plots of Y2(Ir1.85Ti0.15)2O7 at 300, 160, 140 and 20 K where the temperatures represent different magnetic states (Fig. 4). The Fig. 10a shows no major modification in XRD patterns in terms of splitting of the peaks or arising of new peak(s) implying that the magnetic phase transition is not accompanied by any change in the structural symmetry. The XRD patterns are analyzed with Rietveld refinement (not shown) which indicates this material retains its original cubic-Fdm structural symmetry down to 20 K. Fig. 10b represents the temperature dependent lattice constant as obtained from the Rietveld analysis. The lattice constant decreases with decreasing the temperature similar to parent compound.harish The parameter of oxygen atom in IrO6 octahedra though increases but shows a small fluctuation across (Fig. 10c) which is consistent with Raman study where the line width (FWHM) and position of A1g mode show an anomaly around this transition temperature (see Fig. 9).
III.5 Electrical transport
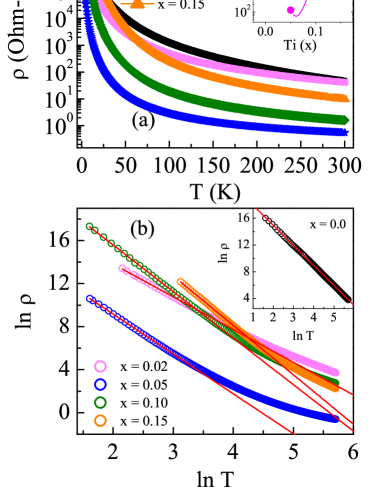
The effect of Ti substitution on charge transport in Y2(Ir1-xTix)2O7 is shown in Fig. 11a which demonstrates electrical resistivity as a function of temperature. The Y2Ir2O7 is reported as a strong insulator where the nature of charge transport follows a power-law dependence on temperature.disseler ; harish ; kumar ; Ramirez In that respect, Ti substitution which is expected to dilute the magnetic network as well as to tune the both SOC and will have strong ramification on the electron transport behavior. The for Y2Ir2O7 shows highly insulating behavior where the resistivity increases by couple of orders at low temperature. With Ti doping, all the samples remain insulating while the resistivity shows nonmonotonic behavior (Fig. 11). For instance, resistivity initially decreases substantially up to = 0.05 and then it increases. The evolution of resistivity with Ti doping at 25 K is shown in inset of Fig. 11a where this behavior arises due to a likely interplay between the Ti induced factors mentioned above. We have previously shown that the nature of charge conduction follows the power-law behavior as
| (3) |
where is power exponent. The inset of Fig. 11b shows ln-ln plot and straight line fitting of data following Eq. 3 for the parent compound where the data can be fitted throughout the temperature range with exponent = 2.98. For the doped samples, however, we can fit the data with Eq. 3 only in low-temperature range as shown in Fig. 11b. The range of straight line fitting for the series extends from low temperature to 52, 21, 37 and 88 K and the obtained values are 3.04, 3.69, 4.3 and 4.54 for = 0.02, 0.05, 0.1 and 0.15, respectively. While the exponent increases continuously, the fitting temperature range follow similar pattern of resistivity value showing minimum range for = 0.05 sample.
Further, we have studied the electronic transport behavior in presence of magnetic field at low temperature. This adds interest because magnetoresistance (MR) has shown an interesting effect in SOC dominated systems i.e., Bi2Se3,chen1 Bi2Te3,he Au covered Mg film,berg even in Ir based Na2IrO3 films,jender where the positive MR has mostly been explained with weak antilocalization (WAL) or weak localization (WL) effect. Fig. 12 (a) shows isothermal magnetoresistance measured at 5 K for Y2(Ir1-xTix)2O7 series with = 0.0, 0.05 and 0.1. Magnetoresistance is understood as a change in the electrical resistance in presence of magnetic field,
| (4) |
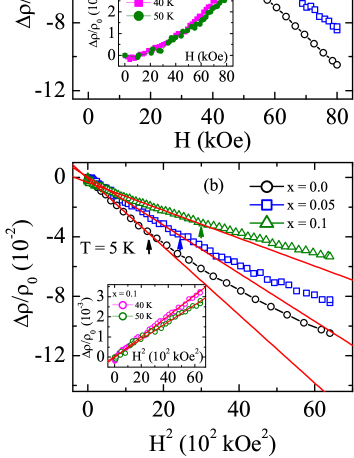
where, and are the resistivity at zero field and presence of magnetic field, respectively. As evident in Fig. 12 (a), all the samples show negative MR at 5 K i.e., the resistivity decreases in presence of magnetic field. The parent Y2Ir2O7 exhibits 11 % MR at 80 kOe field. The negative MR in SOC dominated systems is mostly theoretically explained with weak localization (WL) effect. With Ti substitution, the general feature of MR remains similar but its magnitude decreases continuously with . For example, at same temperature and field, MR value is found around 8.5 and 5.3 % for = 0.05 and 0.1, respectively. Theoretical calculations explain this negative MR in disordered systems through quantum interference effect which causes the localization of charges where the application of magnetic field destroy this interference effect and negative MR is realized. The calculations employing critical path analysis further show a quadratic field dependence of MR.sivan
Fig. 12(b) presents MR at 5 K as a function of for selective samples with = 0.0, 0.05 and 0.1, which shows a quadratic field dependence in low field region. However, field range of quadratic dependence increases with . We observe MR vs. follows linear dependence till field 43, 52 and 55 kOe for = 0.0, 0.05 and 0.1, respectively. This behavior in Fig. 12(b) implies charge transport in present series follows weak localization mechanism. The MR evolution with both and magnetic field can be explained with significant weakening of SOC and dilution of charge transport path due to Ti4+ ions. This is direct evidence of tuning of SOC with Ti4+ in Y2Ir2O7. Following that evolution of MR from negative to positive with temperature in Ir based Sr2IrO4 films,Miao we have checked MR with temperature in one selective sample i.e., = 0.1. Inset of Fig. 12(a) shows MR exhibits positive value in high temperature at 40 and 50 K. This crossover from negative to positive MR is interesting and may be due to an interplay between magnetic field and magnetic moment where the increasing value of the later induces negative MR at low temperature. We find the magnitude of positive MR is almost one order lower than its negative component, as observed for Sr2IrO4 films.Miao The positive MR does not exhibit any cusp or peak close to zero field which excludes the possibility of weak-antilocalization effect as has been observed in other Ir based oxides such as, Na2IrO3 films.jender We, however, find that positive MR follows quadratic field dependence till the highest measuring field of 80 kOe which is in contrast with negative MR that shows dependence in only low field regime (Fig. 12 (b)).
The insulating states in Ir-based materials are of general interest which have been investigated using different substitutions. In case of doped layered Sr2Ir1-xTixO4, the resistivity is increases considerably where the another end member i.e., Sr2TiO4 is highly insulating.Gatimu ; ge The changes of resistivity in present Y2(Ir1-xTix)2O7 is rather interesting. Along with the dilution of Ir-O-Ir connectivity and tuning the SOC and , the structural modification due to Ti also need to be considered for resistivity analysis. As seen in Fig. 2, the Ir-O bond length and angle change continuously with Ti doping which promotes an orbital overlapping of Ir- and O- orbitals. This likely to facilitate the electronic transfer, hence decreasing the resistivity of material in initial doped samples. However, other competing factors such as, site dilution and possible role of opposing tuning of SOC and realized through Ti substitution may contribute to increase of resistivity in higher doped samples.
From the above discussion it is clear that Ti substitution has interesting effects on structural, magnetic and electronic transport behavior in Y2(Ir1-xTix)2O7 series. While the magnetic moment in present series decreases but the ordering temperature shows an insignificant change with (Fig. 4). It can be mentioned that Ti4+ doping shows a weaker effect on compared to magnetically active Ru4+ doping in Y2Ir2O7,kumar and whether this effect is a result of comparatively higher in 3 Ti, needs to be understood. Generally, Ti4+ with its 3 character causes site dilution in magnetic structure, in addition to tuning of both SOC and parameters. Interestingly, previous studies show magnetism survives to higher concentration of Ti in various iridate systems with different crystal structures. For instance, in Sr2IrO4 system which has layered and squared Ir structure, magnetism exists at least up to 40 % of Ti substitution.Gatimu ; ge In honeycomb based Na2IrO3, trace of magnetism has been observed above 26% of Ti doping where the systems exhibit spin-glass like behavior in higher doped systems.Manni The present Y2Ir2O7 has different pyrochlore structure but similar evolution of magnetic behavior emphasizes that both theoretical calculations as well as microscopic experimental tools need to be extended to comprehend this evolution of magnetic and electronic behavior.
IV Conclusion
In summary, we have investigated the evolution of the structural, magnetic and transport properties in pyrochlore iridate Y2(Ir1-xTix)2O7. The system shows no structure phase transition with Ti doping, but the structural parameters show systematic changes. Magnetization data revels that magnetic transition temperature is weakly influenced by Ti substitution but the magnetic moment and magnetic frustration decreases with Ti doping. The parent Y2Ir2O7 is in nonequilibrium magnetic state at low temperature showing magnetic relaxation and aging effect, however, the magnetic relaxation rate increases with Ti doping. Raman spectroscopy measurements indicate no changes in structural symmetry but the position as well as linewidth related to A1g mode show an anomaly around the magnetic transition temperatures. Temperature dependent structural investigation using XRD also imply no change of structural symmetry down to low temperature, although structural parameters show unusual changes around magnetic transitions. Resistivity data of Y2(Ir1-xTix)2O7 show insulating behavior throughout the temperature range, however, resistivity is decreased with Ti doping and the electronic transport mechanism follows power law behavior with temperature. Whole series of samples exhibit a negative MR at low temperature which is considered to be a signature of weak localization (WL) effect in SOC dominated system. A crossover from negative to positive MR with temperature has been observed and is understood to arise as an interplay between magnetic moment and magnetic field.
The 3 based non-magnetic Ti4+ is substituted in place of 5 Ir4+ to tune the spin-orbit coupling (SOC) and electronic correlation () in Y2Ir2O7. Unlike to magnetic substitution with 4 based Ru4+,kumar the Ti4+ appears to have weaker effect on the magnetic transition temperature. This is probably due to 3 and 4 character of dopants as it has different influence on SOC and parameters. This Ti4+, in addition to tuning both these parameters, also act for site dilution, hence its contribution to magnetic and transport properties will have added effect. For instance, nonmagnetic Ti4+ sitting at vertices of Ir tetrahedra will dilute the magnetic interaction. It has been theoretically discussed that SOC induced Dzyaloshinskii-Moriya interaction reduces magnetic frustration in pyrochlore lattice and renders long-range type ordering.elhajal Similarly, onset of AIAO-type AFM spin ordering is predicted in pyrochlore structure with high value of .shinaoka ; Ishii ; Hon Faster magnetic relaxation in Figure 7 is an indicative of tuning of SOC. Further, crossover from negative to positive MR with temperature is understood to be due an interplay between SOC and magnetic moment.
V Acknowledgment
We acknowledge UGC-DAE CSR, Indore for the magnetization, electrical transport and Raman spectroscopy measurements. We are thankful to Dr. Alok Banerjee, Dr. Rajeev Rawat and Dr. Vasant Sathe for the magnetization, resistivity and Raman measurements and discussions, and to Mr. Kranti Kumar, Mr. Sachin Kumar and Mr. Ajay Kumar Rathore for the helps in measurements. We are thankful to AIRF, JNU for low temperature XRD measurements and Mr. Manoj Pratap Singh for the help in measurements. We acknowledge DST-PURSE for the funding. HK acknowledges UGC, India for BSR fellowship.
References
- (1) D. Pesin and L. Balents, Nature Phys 6, 376 (2010).
- (2) W. Witczak-Krempa, G. Chen, Y. B. Kim, and L. Balents, Annual Rev. of Condens. Matter Physics. 5, 57 (2014).
- (3) M. J. P. Gingras, C. V. Stager, N. P. Raju, B. D. Gaulin, and J. E. Greedan, Phys. Rev. Lett. 78, 947 (1997).
- (4) S. Yoshii and M. Sato, J. Phys. Soc. Jpn. 68, 3034 (1999).
- (5) J. S. Gardner, S. R. Dunsiger, B. D. Gaulin, M. J. P. Gingras, J. E. Greedan, R. F. Kiefl, M. D. Lumsden, W. A. MacFarlane, N. P. Raju, J. E. Sonier, I. Swainson, and Z. Tun, Phys. Rev. Lett. 82, 1012 (1999).
- (6) S. Nakatsuji, Y. Machida, Y. Maeno, T. Tayama, T. Sakakibara, J. van Duijn, L. Balicas, J. N. Millican, R. T. Macaluso and J. Y. Chan, Phys. Rev. Lett. 96, 087204 (2006).
- (7) S. T. Bramwell, M. J. Harris, B. C. den Hertog, M. J. P. Gingras, J. S. Gardner, D. F. McMorrow, A. R. Wildes, A. L. Cornelius, J. D. M. Champion, R. G. Melko, and T. Fennell, Phys. Rev. Lett. 87, 047205 (2001).
- (8) H. Fukazawa, R. G. Melko, R. Higashinaka, Y. Maeno, and M. J. P. Gingras, Phys. Rev. B 65, 054410 (2002).
- (9) M. Elhajal, B. Canals, R. Sunyer and C. Lacroix, Phys. Rev. B 71, 094420 (2005).
- (10) K. Matsuhira, M. Wakeshima, Y. Hinatsu, and S. Takagi, J. Phys. Soc. Jpn. 80, 094701 (2011).
- (11) G. Chen and M. Hermele, Phys. Rev. B 86, 235129 (2012).
- (12) S. M. Disseler, C. Dhital, A. Amato, S. R. Giblin, C. de la Cruz, S. D. Wilson, and M. J. Graf, Phys. Rev. B 86, 014428 (2012).
- (13) M. C. Shapiro, S. C. Riggs, M. B. Stone, C. R. de la Cruz, S. Chi, A. A. Podlesnyak and I. R. Fisher, Phys. Rev. B 85, 214434 (2012).
- (14) N. Taira, M. Wakeshima and Y. Hinatsu, J. Phys.: Condens. Matter 13, 5527 (2001).
- (15) H. Fukazawa and Y. Maeno, J. Phys. Soc. Jpn. 71, 2578 (2002).
- (16) M. Soda, N. Aito, Y. Kurahashi, Y. Kobayashi, and M. Sato, Physica B 1071, 329 (2003).
- (17) W. K. Zhu, M. Wang, B. Seradjeh, F. Yang, and S. X. Zhang, Phys. Rev. B 90, 054419 (2014).
- (18) H. Kumar and A. K. Pramanik, J. Magn. Magn. Mater 409 20 (2016).
- (19) H. Kumar, R. S. Dhaka and A. K. Pramanik, Phys. Rev. B 95, 054415 (2017).
- (20) X. Wan, A. M. Turner, A. Vishwanath, and S. Y. Savrasov, Phys. Rev. B 83, 205101 (2011).
- (21) H. Shinaoka, S. Hoshino, M. Troyer, and P. Werner, Phys. Rev. Lett. 115 156401 (2015).
- (22) F. Ishii, Y. P. Mizuta, T. Kato, T. Ozaki, H. Weng, and S. Onoda, J. Phys. Soc. Jpn. 84, 073703 (2015).
- (23) H. Zhang, Kristjan Haule, and David Vanderbilt, Phys. Rev. Lett. 118, 026404 (2017).
- (24) R. S. Singh, V. R. R. Medicherla, K. Maiti, and E. V. Sampathkumaran, Phys. Rev. B 77, 201102, (2008).
- (25) B-J. Yang and Y. B. Kim, Phys. Rev. B 82, 085111 (2010).
- (26) J. Rodriguez-Carvajal, Physica B 192 55 (1993).
- (27) H. Kumar and A. K. Pramanik, AIP Conf. Proc. 1832, 130038 (2017).
- (28) J. P. Clancy, H. Gretarsson, E. K. H. Lee, Di Tian, J. Kim, M. H. Upton, D. Casa, T. Gog, Z. Islam, Byung-Gu Jeon, Kee Hoon Kim, S. Desgreniers, Yong Baek Kim, S. J. Julian, and Young-June Kim, Phys. Rev. B 94, 024408, (2016).
- (29) L. Hozoi, H. Gretarsson, J. P. Clancy, B.-G. Jeon, B. Lee, K. H. Kim, V. Yushankhai, P. Fulde, D. Casa, T. Gog, J. Kim, A. H. Said, M. H. Upton, Young-June Kim, and J. van den Brink, Phys. Rev. B 89, 115111, (2014).
- (30) R. Kmie, . wiatkowska, J. Gurkul, M. Rams, A. Zarzycki and K. Tomala, Phys. Rev. B 74, 104425 (2006).
- (31) J.S. Gardner, B.D. Gaulin, S. H. Lee, C. Broholm, N.P. Raju, and J.E. Greedan, Phys. Rev. Lett. 83, 211 (1999).
- (32) A. Arrott, Phys. Rev. 108, 1394 (1957).
- (33) B. J. Kim, H. Jin, S. J. Moon, J.-Y. Kim, B.-G. Park, C. S. Leem, Jaejun Yu, T.W. Noh, C. Kim, S.-J. Oh J.-H. Park, V. Durairaj, G. Cao, and E. Rotenberg, Phys. Rev. Lett. 101, 076402 (2008).
- (34) R. J. Cava, B. Batlogg, K. Kiyono, H. Takagi, J. J. Krajewski, W. F. Peck, Jr., L. W. Rupp, Jr., and C. H. Chen, Phys. Rev. B 49, 11890 (1994).
- (35) S. J. Yuan, S. Aswartham, J. Terzic, H. Zheng, H. D. Zhao, P. Schlottmann, and G. Cao, Phys. Rev. B 92, 245103 (2015).
- (36) S. Calder, J. W. Kim, G.-X. Cao, C. Cantoni, A. F. May, H. B. Cao, A. A. Aczel, M. Matsuda, Y. Choi, D. Haskel, B. C. Sales, D. Mandrus, M. D. Lumsden, and A. D. Christianson, Phys. Rev. B 92, 165128 (2015).
- (37) A. J. Gatimu, R. Berthelot, S. Muir, A. W. Sleight, M. A. Subramanian, J. Solid State Chem. 190, 257 (2012)
- (38) M. Ge, S. Tan, J. Shao, L. Pi, Y. Zhang, J. Magn. Magn. Mater 369 223 (2014).
- (39) S. Manni, Y. Tokiwa, and P. Gegenwart, Phys. Rev. B 89, 241102(R) (2014).
- (40) X. Liu, V. M. Katukuri, L. Hozoi, W-G. Yin, M. P. M. Dean, M. H. Upton, Jungho Kim, D. Casa, A. Said, T. Gog, T. F. Qi, G. Cao, A. M. Tsvelik, J. van den Brink, and J. P. Hill, Phys. Rev. Lett. 109, 157401 (2012).
- (41) R. V. Chamberlin, G. Mozurkewich, and R. Orbach, Phys. Rev. Lett. 52, 867 (1984).
- (42) H. Han, L. Zhang, H. Liu, L. Ling, W. Tong, Y Zou, M. Ge, J. Fan, C. Zhang, L. Pi and Y. Zhang, Philosophical Magazine 95, 3014 (2015).
- (43) T. Hasegawa, N. Ogita, K. Matsuhira, S. Takagi, M. Wakeshima, Y. Hinatsu and M. Udagawa, J. Phys.: Conf. Ser. 200 012054 (2010).
- (44) H. Kumar, V. G. Sathe, and A. K. Pramanik, J. Magn. Magn. Mater 478 148 (2019).
- (45) K. Taniguchi, T. Katsufuji, S. Iguchi, Y. Taguchi, H. Takagi, and Y. Tokura, Phys. Rev. B 70, 100401(R) (2004).
- (46) M. L. Sanjuan, C. Guglieri, S. D´ıaz-Moreno, G. Aquilanti, A. F. Fuentes, L. Olivi, and J. Chaboy, Phys. Rev. B 84, 104207 (2011).
- (47) C. L. Tracy, J. Shamblin, S. Park, F. Zhang, C. Trautmann, M. Lang, and R. C. Ewing, Phys. Rev. B 94, 064102 (2016).
- (48) T. S. Sreena, P. Prabhakar Rao, T. L. Francis, A. K. V. Raj and P. S. Babu, Dalton Trans. 44, 8718 (2015)
- (49) S. Saha, S. Singh, B. Dkhil, S. Dhar, R. Suryanarayanan, G. Dhalenne, A. Revcolevschi, and A. K. Sood, Phys. Rev. B 78, 214102 (2008).
- (50) A. Glamazda, W. J. Lee, P. Lemmens, H. Y. Choi, N. Lee, Y. J. Choi and K. Y. Choi, Phys. Rev. B 89, 104406 (2014).
- (51) M. F. Cetin, P. Lemmens, V. Gnezdilov, D. Wulferding, D. Menzel, T. Takayama, K. Ohashi, and H. Takagi, Phys. Rev. B 85, 195148 (2012).
- (52) P. G. LaBarre, L. Dong, J. Trinh, T. Siegrist, and A. P. Ramirez arXiv:1808.07583 (2018).
- (53) J. Chen, H. J. Qin, F. Yang, J. Liu, T. Guan, F. M. Qu, G. H. Zhang, J. R. Shi, X. C. Xie, C. L. Yang, K. H. Wu, Y. Q. Li, and L. Lu, Phys. Rev. Lett. 105, 176602 (2010).
- (54) H.-T. He, G. Wang, T. Zhang, I.-K. Sou, G. K. L. Wong, J.-N. Wang, H.-Z. Lu, S.-Q. Shen, and F.-C. Zhang, Phys. Rev. Lett. 106, 166805 (2011).
- (55) G. Bergman, Phys. Rev. Lett. 48, 1046 (1982).
- (56) M. Jenderka, J. Barzola-Quiquia, Z. Zhang, H. Frenzel, M. Grundmann, and M. Lorenz, Phys. Rev. B 88, 045111 (2013).
- (57) U. Sivan and O. Entin-Wohlman, and Y. Imry, Phys. Rev. Lett. 60, 1566 (1988).
- (58) L. Miao, H. Xu, and Z. Q. Mao, Phys. Rev. B 89, 035109 (2014)