Constraints on the Dark Matter Interpretation of the Neutron Decay Anomaly with the Perkeo II experiment
Abstract
Discrepancies from in-beam and in-bottle type experiments measuring the neutron lifetime are on the 4 standard deviation level. In a recent publication Fornal and Grinstein proposed that the puzzle could be solved if the neutron would decay on the one percent level via a dark decay mode, one possible branch being . With data from the Perkeo II experiment we set limits on the branching fraction and exclude a one percent contribution for of the allowed mass range for the dark matter particle.
pacs:
13.30.Ce, 12.15.Ji, 12.60.-i, 14.20.DhNeutron decay, as the prototype for nuclear beta decay, and its lifetime are needed to calculate most semileptonic weak interaction processes and used as input to search for new physics beyond the standard model of particle physics Dubbers and Schmidt (2011); Wietfeldt and Greene (2011); Abele (2008); González-Alonso et al. (2018). Measurements of the neutron lifetime fall into two categories Green and Thompson (1990): in the storage method neutrons are confined in a material or magnetic bottle and after a given time the surviving neutrons are counted. In the beta decay method, the specific activity of an amount of neutrons (a section of a neutron beam, a neutron pulse or stored neutrons) is measured by detecting one of the decay products, proton or electron. A review of neutron lifetime measurements can be found in Wietfeldt and Greene (2011). The averaged results of both categories, 879.4(6) s and 888.0(2.0) s, deviate by 8.4 s from each other, corresponding to (all numbers from Czarnecki et al. (2018)).
Although this lifetime discrepancy may be related to underestimated systematics in experiments, there is a basic difference between the two categories: the storage method measures the inclusive lifetime, independent of the decay or disappearance channel, whereas the beta decay method detects the partial lifetime into a particular decay branch. Historically, Green and Thompson have used this argument to derive an upper limit on the decay into a hydrogen atom which would be missed by the beta decay method Green and Thompson (1990); however, the expected branching fraction of Nemenov (1980) is too small to explain the 8.4 s difference observed today. Greene and Geltenbort have speculated that the discrepancy might be caused by oscillations of neutrons into mirror neutrons Greene and Geltenbort (2016). Recently, Fornal and Grinstein Fornal and Grinstein (2018) have proposed different decay channels involving a dark matter particle. These branches would have been missed by the most precise beta decay method experiments which have detected decay protons Yue et al. (2013).
Neutron stars have been used to severely constrain these branches Motta et al. (2018); Baym et al. (2018); McKeen et al. (2018) but some models evade these constraints Cline and Cornell (2018). Czarnecki et al. have derived a very general bound of % ( C.L.) on exotic decay branches of the neutron where they use their favored values of the neutron lifetime from the storage method and the axial coupling from recent beta asymmetry measurements and assume that from superallowed beta decays and CKM unitarity are negligibly affected by exotic new physics. This means that not more than 2.4 s (with C.L.) of the lifetime discrepancy might be explained by a dark decay. This constraint could be overcome by a smaller axial vector coupling constant in the range Czarnecki et al. (2018), in contradiction to the most accurate measurements Mund et al. (2013); Mendenhall et al. (2013); Märkisch et al. (2018). An extended anaysis can be found in Dubbers et al. (2019). We note that the interpretation of the neutron decay anomaly is relevant for tests of the unitarity in the first row of the CKM matrix Abele et al. (2004) with neutron decay. Recent reanalysis of the universal radiative correction to neutron and superallowed nuclear beta decay raises tension with the CKM unitarity constraint based on superallowed beta decays and Kaon decays Seng et al. (2018).
Experimental constraints on the dark matter interpretation of the neutron decay anomaly have been set on two decay branches. A recent experiment at Los Alamos National Lab Tang et al. (2018) excludes the proposed decay channel as sole explanation of the lifetime discrepancy with C.L. via a direct search for a monoenergetic line. Another decay channel, , has been searched for by the UCNA collaboration Sun et al. (2018). For this decay channel, the sum of the kinetic energies of the positron and electron is restricted to the range of , corresponding to a dark matter mass range of between and . The UCNA collaboration sets limits on this branching fraction of ( C.L.) in the energy range which excludes this channel as only explanation for the lifetime discrepancy at the level Sun et al. (2018).
With this letter, we set limits on the same decay channel from data taken by the Perkeo II instrument, which was installed at the PF1B cold neutron beam position Häse et al. (2002); Abele et al. (2006) at the Institut Laue-Langevin (ILL). A drawing and a more detailed description of the Perkeo II spectrometer together with measurements of beta decay correlation coefficients can be found in Mund et al. (2013); Schumann et al. (2008, 2007); Reich et al. (2000). For the investigation of a dark decay of the neutron into an -pair, we re-analyze the data that was used to extract the beta asymmetry parameter Mund et al. (2013). In that set-up the spectrometer is configured for electron detection only. The electrons are transported from the decay volume towards either of the two detectors by a magnetic field of approximately . Details on the adiabatic transport of charged particles in magnetic fields can be found e.g. in Dubbers et al. (2014). For the electron detection we used two plastic scintillators each read out by four fine mesh photomultiplier tubes (PMTs). The integrated pulse size of this detection system is largely proportional to the incident kinetic energy of a single electron or positron. During the measurements, the detector response function was determined and the detector stability checked regularly using four monoenergetic conversion electron sources. The detectors showed a nonlinearity at low energy, which was modelled for this search for a dark neutron decay mode using a quenching model developed by Birks Birks (1951). This extends the analysis of Mund et al. Mund et al. (2013). The stopping power of electrons inside the scintillator material is calculated from ESTAR data Berger et al. (2005). The detector calibration, including the Birks non-linearity parameter, was obtained by a fit to the electron spectra of each detector. The uncertainties in the non-linearity relations of both detectors are taken into account for the analysis. The energy resolution does not play an important role for the present analysis, because a variation of 50% affects the limit on the dark matter branching ratio only on the 10-3 level.
About of the electrons impinging on one of the detectors are scattered back from the detector and deposit only part of their energy in it. However, in the Perkeo II spectrometer such electrons will be guided along a magnetic field line to the other detector and will, a few nanoseconds later, deposit their energy there. For about half of the electrons, which are backscattered near the glancing angle, the fringe field of the magnet acts as a magnetic mirror and projects the electron back onto the same detector. So all electrons are confined by the magnetic field between the two detectors and can lose energy only to them. If, for each event, the total signal amplitudes from both detectors are added up, then the pure line spectrum is recovered. Details on the electron backscatter suppression can be found in Abele et al. (1993).
| ADC channel | Statistical | Calibration | Backscatter |
|---|---|---|---|
| Error | Error | Model Error | |
| 5 | 3.1 | 4.09 | 8.92 |
| 10 | 1.50 | 1.40 | 5.98 |
| 50 | 9.28 | 9.11 | 9.28 |
| 100 | 4.12 | 1.37 | 3.47 |
The search for the proposed dark matter signal proceeded in the following way: Most of the conventional beta decay events are rejected by requiring that both detectors have triggered. For the remaining events, the spectrum of the total energy deposition is obtained by summing up the signals of both detectors. It is composed of conventional beta decay events with electron backscattering, background events that trigger both detectors, and of hypothetical events. Background events contribute with to the spectrum and were measured regularly with the neutron beam closed and subtracted from the data. The pairs are monoenergetic and would create a characteristic peak on the backscattering spectrum, in the range from and depending on the mass of the hypothetical dark matter particle. Note that the selection cut excludes undetected backscattering events (see Schumann and Abele (2008); Roick et al. (2018)) and pairs at low energy or going to the same detector. Positron annihilation gamma effects are small because of the low sensitivity of the thin (5 mm) plastic scintillators to 511 keV gammas and are taken into account in the analysis Klopf et al. (2018). Tests with a 22Na positron source were performed and the effects on the expected signal were simulated with GEANT4 Agostinelli et al. (2003).
The expected backscatter spectrum from conventional beta decay, which is the remaining background in the search for the hypothetical peak, is determined by simulations: Decay electrons are created with the angular and energy distribution from conventional neutron decay. For each electron, the impact angle on the detector is determined from the ratio of the magnetic field in the Perkeo II decay volume and at the detector.
Backscattering splits the kinetic energy of an electron in two parts deposited in the two detectors. It is simulated using GEANT4 Agostinelli et al. (2003)
with the single Coulomb scattering model, which is appropriate for low energy backscattering as this option
reproduces experimental data above a few tens of keV. In the few keV energy range some measurements find a different backscattering fraction Kim et al. (2015). We take this deviation as standard deviation error on our backscatter model.
The magnetic mirror effect for backscattered electrons is taken into account in the simulations. For the energy splitting of -events between the both detectors theoretical predictions from Ivanov et al. (2018) are used. The resulting signals are obtained accounting for quenching in the scintillators, the statistical distribution of the photo-electron conversion of the
PMTs (which is dominating the energy resolution), and
additional broadening due to the noise of the charge to
digital conversion.
The spectrum of the sum
of the simulated signals still needs to be
corrected for the trigger efficiencies of the two detectors.
The experimental trigger efficiencies of both detectors are measured, for a signal in ADC channel of detector 1 e.g. it is
| (1) |
where is the number of events in detector 1 where both detectors have triggered and the number of events in detector 1 where detector 2 has triggered. For the hardware trigger condition of detector at least two out of the four photomultipliers must have triggered.
The correction for the trigger efficiencies is obtained by applying, event by event, the trigger efficiency functions to the simulated signals in the two detectors.
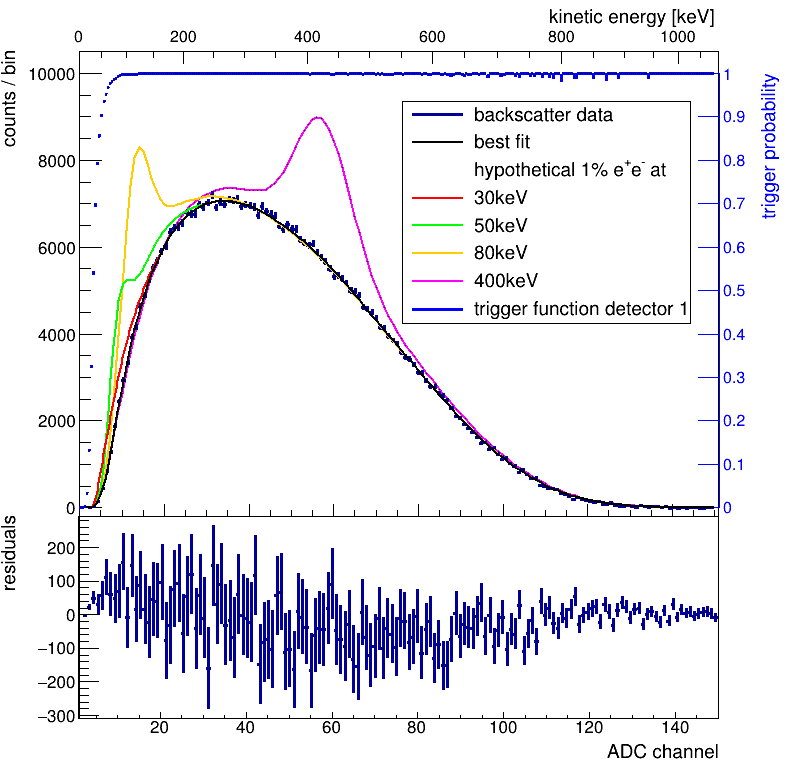
In Fig. 1 we show the experimental spectrum after background subtraction
together with a fit using the results of the GEANT4 simulations.
For illustration of the signature of the hypothetical peak also shown is the expected shape of the
spectrum for a branching to for
total kinetic energies of , , , and .
We scan the spectrum by shifting a
hypothetical peak in steps of one channel of the analog to digital converter (ADC), which corresponds
to approximately , and performing a fit at each position. The height of the peak is the single free parameters of the fit.
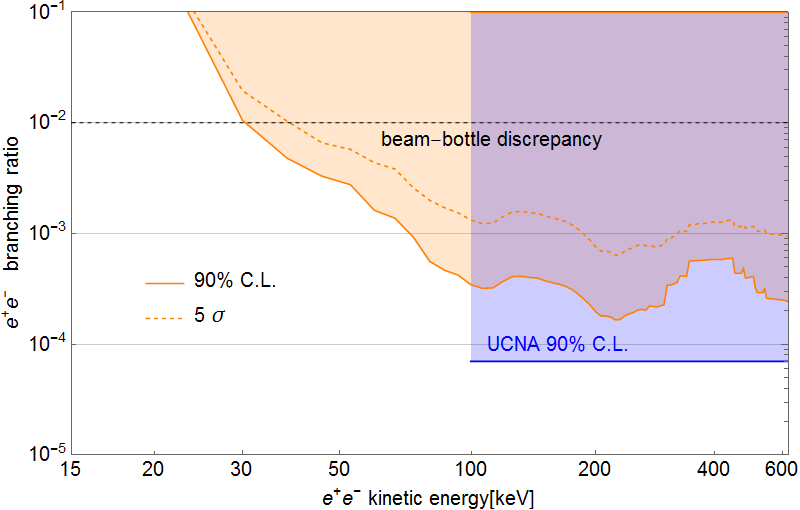
The phase space of pairs in the proposed dark decay has been computed in Ivanov et al. (2018). Under the assumption of a parity conserving dark decay, the probability that the electron and positron are emitted towards opposite detectors varies between and , depending on the mass of the dark matter particle. As only these events can pass our selection cut, we assume the most conservative case for the emission of in the exclusion analysis.
In Fig. 2 we show an exclusion plot for a hypothetical branching fraction at C.L., which corresponds to a one sided 1.3 cut above the best fit value for the dark matter branching ratio. In regions, where the fit to the amplitude of the dark matter signal has a negative outcome, we renormalize the tail probabilities in the positive range and take a cut. We also tested the significance of observing a local excess of events, i.e. a dark matter signal somewhere in a possible mass range if we take into account the probability of observing such an excess anywhere in the range. We quantify this “look-elsewhere effect” by obtaining Monte-Carlo simulations of backscatter only data, and for each channel the largest fluctuation that resembles a signal. Details on the “look-elsewhere effect” can be found e.g. in Gross and Vitells (2010). The proposed contribution to neutron beta decay Fornal and Grinstein (2018) can be excluded with C.L. between and and better than 5 sigma standard deviation for energies between and . This corresponds to respectively of the allowed mass range for the dark matter particle. In general we can derive limits for higher energies, which are, however, excluded by Fornal and Grinstein (2018).
Acknowledgements.
ACKNOWLEDGEMENTS We thank D. Schirra, C. Roick (Technische Universität München) and A. Ivanov (Technische Universität Wien) for useful discussions and F. Müller (Technische Universität Wien) for help with MC simulations. This work was supported by the Austrian Science Fund (FWF) contract nos. P 26630-N20, P 26781-N20 and I 689-N16, and the DFG Priority Programme SPP 1491, contract nos. AB 128/5-2, MA 4944/1-2. The computational results presented have been achieved in part using the Vienna Scientific Cluster.References
- Dubbers and Schmidt (2011) D. Dubbers and M. G. Schmidt, Rev. Mod. Phys. 83, 1111 (2011).
- Wietfeldt and Greene (2011) F. E. Wietfeldt and G. L. Greene, Rev. Mod. Phys. 83, 1173 (2011).
- Abele (2008) H. Abele, Progress in Particle and Nuclear Physics 60, 1 (2008).
- González-Alonso et al. (2018) M. González-Alonso, O. Naviliat-Cuncic, and N. Severijns, Progress in Particle and Nuclear Physics (2018), 10.1016/j.ppnp.2018.08.002, arXiv:1803.08732 .
- Green and Thompson (1990) K. Green and D. Thompson, Journal of Physics G: Nuclear and Particle Physics 16, L75 (1990).
- Czarnecki et al. (2018) A. Czarnecki, W. J. Marciano, and A. Sirlin, Phys. Rev. Lett. 120, 202002 (2018).
- Nemenov (1980) L. L. Nemenov, Sov. J. Nucl. Phys. 31 (1980).
- Greene and Geltenbort (2016) G. L. Greene and P. Geltenbort, Scientific American 314, 36 (2016).
- Fornal and Grinstein (2018) B. Fornal and B. Grinstein, Phys. Rev. Lett. 120, 191801 (2018).
- Yue et al. (2013) A. T. Yue, M. S. Dewey, D. M. Gilliam, G. L. Greene, A. B. Laptev, J. S. Nico, W. M. Snow, and F. E. Wietfeldt, Phys. Rev. Lett. 111, 222501 (2013).
- Motta et al. (2018) T. F. Motta , P. A. M. Guichon and A. W. Thomas, J. Phys. G: Nucl. Part. Phys. 45, 05LT01 (2018).
- Baym et al. (2018) G. Baym, D. H. Beck, P. Geltenbort, and J. Shelton, Phys. Rev. Lett. 121, 061801 (2018).
- McKeen et al. (2018) D. McKeen, A. E. Nelson, S. Reddy, and D. Zhou, Phys. Rev. Lett. 121, 061802 (2018).
- Cline and Cornell (2018) J. M. Cline and J. M. Cornell, J. High Energ. Phys. 2018, 81 (2018).
- Mund et al. (2013) D. Mund, B. Märkisch, M. Deissenroth, J. Krempel, M. Schumann, H. Abele, A. Petoukhov, and T. Soldner, Phys. Rev. Lett. 110, 172502 (2013).
- Mendenhall et al. (2013) M. P. Mendenhall, R. W. Pattie, Y. Bagdasarova, D. B. Berguno, L. J. Broussard, R. Carr, S. Currie, X. Ding, B. W. Filippone, A. García, P. Geltenbort, K. P. Hickerson, J. Hoagland, A. T. Holley, R. Hong, T. M. Ito, A. Knecht, C.-Y. Liu, J. L. Liu, M. Makela, R. R. Mammei, J. W. Martin, D. Melconian, S. D. Moore, C. L. Morris, A. Pérez Galván, R. Picker, M. L. Pitt, B. Plaster, J. C. Ramsey, R. Rios, A. Saunders, S. J. Seestrom, E. I. Sharapov, W. E. Sondheim, E. Tatar, R. B. Vogelaar, B. VornDick, C. Wrede, A. R. Young, and B. A. Zeck (UCNA Collaboration), Phys. Rev. C 87, 032501 (2013).
- Märkisch et al. (2018) B. Märkisch, H. Mest, H. Saul, X. Wang, H. Abele, D. Dubbers, M. Klopf, A. Petoukhov, C. Roick, T. Soldner, and D. Werder, arXiv:1812.04666 Nucl-Ex (2018), arXiv:1812.04666 [nucl-ex] .
- Dubbers et al. (2019) D. Dubbers, H. Saul, B. Märkisch, T. Soldner, and H. Abele, Phys. Lett. B 791, 6 (2019).
- Abele et al. (2004) H. Abele, B. Barberio, D. Dubbers, F. Glück, J. Hardy, W. Marciano, A. Serebrov, and N. Severijns, Eur. Phys. J. C 33, 1 (2004).
- Seng et al. (2018) C.-Y. Seng, M. Gorchtein, H. H. Patel, and M. J. Ramsey-Musolf, Phys. Rev. Lett. 121 (2018), 10.1103/PhysRevLett.121.241804, arXiv:1807.10197 .
- Tang et al. (2018) Z. Tang, M. Blatnik, L. J. Broussard, J. H. Choi, S. M. Clayton, C. Cude-Woods, S. Currie, D. E. Fellers, E. M. Fries, P. Geltenbort, F. Gonzalez, K. P. Hickerson, T. M. Ito, C.-Y. Liu, S. W. T. MacDonald, M. Makela, C. L. Morris, C. M. O’Shaughnessy, R. W. Pattie, B. Plaster, D. J. Salvat, A. Saunders, Z. Wang, A. R. Young, and B. A. Zeck, Phys. Rev. Lett. 121, 022505 (2018).
- Sun et al. (2018) X. Sun, E. Adamek, B. Allgeier, M. Blatnik, T. J. Bowles, L. J. Broussard, M. A.-P. Brown, R. Carr, S. Clayton, C. Cude-Woods, S. Currie, E. B. Dees, X. Ding, B. W. Filippone, A. García, P. Geltenbort, S. Hasan, K. P. Hickerson, J. Hoagland, R. Hong, G. E. Hogan, A. T. Holley, T. M. Ito, A. Knecht, C.-Y. Liu, J. Liu, M. Makela, R. Mammei, J. W. Martin, D. Melconian, M. P. Mendenhall, S. D. Moore, C. L. Morris, S. Nepal, N. Nouri, R. W. Pattie, A. Pérez Galván, D. G. Phillips, R. Picker, M. L. Pitt, B. Plaster, J. C. Ramsey, R. Rios, D. J. Salvat, A. Saunders, W. Sondheim, S. Sjue, S. Slutsky, C. Swank, G. Swift, E. Tatar, R. B. Vogelaar, B. VornDick, Z. Wang, W. Wei, J. Wexler, T. Womack, C. Wrede, A. R. Young, and B. A. Zeck (UCNA Collaboration), Phys. Rev. C 97, 052501 (2018).
- Häse et al. (2002) H. Häse, A. Knöpfler, K. Fiederer, U. Schmidt, D. Dubbers, and W. Kaiser, Nucl. Inst. & Meth. A 485, 453 (2002).
- Abele et al. (2006) H. Abele, D. Dubbers, H. Häse, M. Klein, A. Knöpfler, M. Kreuz, T. Lauer, B. Märkisch, D. Mund, V. Nesvizhevsky, A. Petoukhov, C. Schmidt, M. Schumann, and T. Soldner, Nucl. Inst. & Meth. A 562, 407 (2006).
- Schumann et al. (2008) M. Schumann, M. Kreuz, M. Deissenroth, F. Glück, J. Krempel, B. Märkisch, D. Mund, A. Petoukhov, T. Soldner, and H. Abele, Phys. Rev. Lett. 100, 151801 (2008).
- Schumann et al. (2007) M. Schumann, T. Soldner, M. Deissenroth, F. Glück, J. Krempel, M. Kreuz, B. Märkisch, D. Mund, A. Petoukhov, and H. Abele, Phys. Rev. Lett. 99, 191803 (2007).
- Reich et al. (2000) J. Reich, H. Abele, M. Hoffmann, S. Baeßler, P. Bülow, D. Dubbers, V. Nesvizhevsky, U. Peschke, and O. Zimmer, Nuclear Instruments and Methods in Physics Research Section A: Accelerators, Spectrometers, Detectors and Associated Equipment 440, 535 (2000).
- Dubbers et al. (2014) D. Dubbers, L. Raffelt, B. Märkisch, F. Friedl, and H. Abele, Nucl. Inst. & Meth. A 763, 112 (2014).
- Birks (1951) J. D. Birks, Proceedings of the Physical Society. Section A 64, 874 (1951).
- Berger et al. (2005) M. Berger, J.Coursey, M. Zucker, and J.Chang, National Institute of Standards and Technology, Gaithersburg, MD., (2005), 10.18434/T4NC7P.
- Abele et al. (1993) H. Abele, G. Helm, U. Kania, C. Schmidt, J. Last, and D. Dubbers, Physics Letters B 316, 26 (1993).
- Schumann and Abele (2008) M. Schumann and H. Abele, Nuclear Instruments and Methods A 585, 88 (2008).
- Roick et al. (2018) C. Roick, H. Saul, H. Abele, and B. Märkisch, in International Workshop on Particle Physics at Neutron Sources (2018) submitted.
- Klopf et al. (2018) M. Klopf, E. Jericha, B. Märkisch, H. Saul, T. Soldner, and H. Abele, in International Workshop on Particle Physics at Neutron Sources (2018) accepted.
- Agostinelli et al. (2003) S. Agostinelli et al., Nuclear Instruments and Methods in Physics Research Section A: Accelerators, Spectrometers, Detectors and Associated Equipment 506, 250 (2003).
- Kim et al. (2015) S. H. Kim, M. G. Pia, T. Basaglia, M. C. Han, G. Hoff, C. H. Kim, and P. Saracco, (2015), 10.1109/TNS.2015.2401055, arXiv:1502.01507 .
- Ivanov et al. (2018) A. N. Ivanov, R. Höllwieser, N. I. Troitskaya, M. Wellenzohn, and Y. A. Berdnikov, “Neutron dark matter decays,” (2018), arXiv:1806.10107 .
- Gross and Vitells (2010) E. Gross and O. Vitells, The European Physical Journal C 70, 525 (2010).