Multiwavelength modeling the SED of nova V339 Del:
Stopping the wind
and long-lasting super-Eddington luminosity with dust emission
Abstract
During the classical nova outburst, the radiation generated by the nuclear burning of hydrogen in the surface layer of a white dwarf (WD) is reprocessed by the outer material into different forms at softer energies, which distribution in the spectrum depends on the nova age. Using the method of multiwavelength modeling the SED we determined physical parameters of the stellar, nebular and dust component of radiation isolated from the spectrum of the classical nova V339 Del from day 35 to day 636 after its explosion. The transition from the iron-curtain phase to the super-soft source phase (days 35–72), when the optical brightness dropped by 3–4 mag, the absorbing column density fell by its circumstellar component from to cm-2, and the emission measure decreased from to cm-3, was caused by stopping-down the mass-loss from the WD. The day 35 model SED indicated an oblate shape of the WD pseudophotosphere and the presence of the dust located in a slow equatorially concentrated outflow. The dust emission peaked around day 59. Its co-existence with the strong super-soft X-ray source in the day 100 model SED constrained the presence of the disk-like outflow, where the dust can spend a long time. Both the models SED revealed a super-Eddington luminosity of the burning WD at a level of , lasting from day 2 to at least day 100.
Subject headings:
Stars: novae, cataclysmic variables – Stars: fundamental parameters – Stars: individual: V339 Del1. Introduction
The nova phenomenon results from a thermonuclear runaway (TNR) on the surface of a white dwarf (WD) accreting hydrogen-rich material from its companion in a binary system (e.g. Bode & Evans, 2008; Starrfield et al., 2016, for a review). The TNR event significantly increases the luminosity and ejects material of at velocities km s-1 (e.g., Gallagher & Starrfield, 1978; Kato & Hachisu, 1994). The energy released near the WD surface is thus reprocessed through the outer material giving rise to the spectral energy distribution (SED) that changes across the electromagnetic spectrum with the nova age. In this work we introduce modeling the SED of a classical nova V339 Del at critical dates of its evolution to obtain new information about the nova explosion.
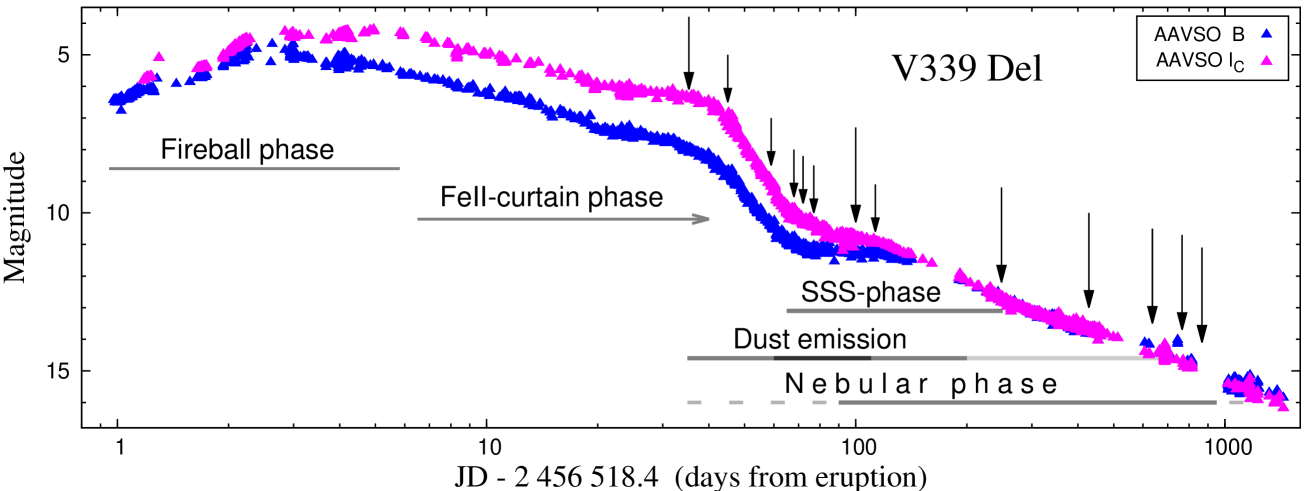
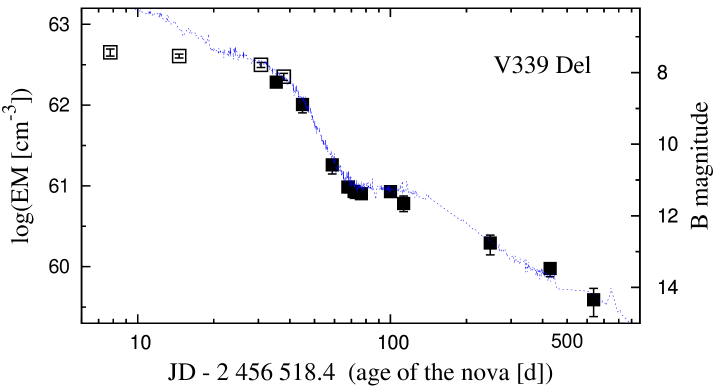
Classical nova V339 Del (Nova Delphini 2013 = PNV J20233073+2046041) was discovered by Koichi Itagaki on 2013 August 14.584 UT at a visual magnitude of 6.8 (Nakano, 2013). Its progenitor was identified by Denisenko et al. (2013) as the blue star USNO-B1.0 1107-0509795 (, ). Munari & Henden (2013) found the progenitor also on the Asiago 1979-82 plates and within observations taken by the APASS survey111http://www.aavso.org/apass in April 2012, whereas Deacon et al. (2014) documented its pre-outburst variability. After 1.85 days of its discovery, the nova peaked at on August 16.45 UT (Munari et al., 2013b), and became to be an attractive target also for amateurs astronomers. As a result, a large amount of observations with a high cadence in the optical, has been performed from -rays (Ackermann et al., 2014; Ahnen et al., 2015) to the radio/mm–2 cm wavelengths (Chomiuk et al., 2013; Anderson et al., 2013). A short review of V339 Del was presented by Munari et al. (2015), Shore et al. (2016), Evans et al. (2017) and Chochol et al. (2017). Figure 1 shows the optical light curve (LC) of the nova from day 1 after its explosion (see below) to day 1800. Main characteristics of V339 Del can be summarized as follows.
Reddening: Based on the equivalent width of Na I 5890, Munari et al. (2013a) determined the interstellar reddening to V339 Del to be = 0.18, which agrees with the Schlegel et al. (1998) extinction maps as found by Burlak et al. (2015). This value has been used in most papers published to date.
Distance: Using the maximum-magnitude-rate-of-decline relation, the distance to the nova was estimated to 2.7–3.5 kpc (Taranova et al., 2014; Chochol et al., 2014; Burlak et al., 2015). On the basis of near-IR interferometry, Schaefer et al. (2014) determined the pre-maximum expansion rate of the nova fireball, which corresponds to a distance of kpc. In a similar way, but using photometry of the expanding fireball, Gehrz et al. (2015) determined the distance of V339 Del to kpc and the day zero (= the nova explosion) on JD 2 456 518.4 (August 13.9, 2013). The distance of kpc was supported by Shore et al. (2016) by comparing the UV spectrum of the CO nova OS And 1986 and V339 Del taken at a comparable stage of their evolution. Using the distance-extinction relation for the independent measurements of reddening, Özdönmez et al. (2016) and Özdönmez et al. (2018) included V339 Del to novae, for which the distance could not be estimated. Finally, the Gaia data release 2 catalog presents the distance of 2130 pc, which was classified by Schaefer (2018) as untrustworthy, because having the parallax error bar %.
Temperature: During the fireball stage (August 14.8–19.9, 2013; day 0.9–6.0), when the maximum of the nova radiation was within the optical, Skopal et al. (2014) determined the effective temperature of the WD pseudophotosphere in the range of 6000–12000 K on the basis of models SED. Comparing photometric flux-points from the optical maximum (August 15.94 and 16.86, 2013; day 2 and 3) to the spectrum of normal supergiants, Taranova et al. (2014) estimated the temperature of the nova to 13600 and 9400 K, respectively. During the super-soft source (SSS) phase, on November 09.75, 2013 (day 88), Nelson et al. (2013) estimated a photospheric temperature of the WD to 27 eV (310000 K) on the basis of the first high resolution X-ray spectrum of the nova obtained by the Chandra observatory. On November 21, 2013 (day 100), Ness et al. (2013) estimated the temperature of the SSS to 30 eV (350000 K) using the spectrum obtained with XMM-Newton.
Luminosity: Around the optical maximum, Taranova et al. (2014), Skopal et al. (2014) and Gehrz et al. (2015) estimated the luminosity of the nova to , and , respectively, i.e., a factor of 10 above the Eddington value. Using the HST/STIS and optical observations on day 35 and 100, Shore et al. (2016) determined the 1200–7400 Å luminosity to , which is still at or above the Eddington value for a Chandrasekhar mass WD.
Dust formation: On the basis of near-IR photometry, Taranova et al. (2014) indicated a dust emission around one month after the optical maximum. On September 21 (day 38.9) and October 11, 2013 (day 58.8), they estimated its color temperature to 1500 and 1200 K, luminosity of 4 and 1.2 and its mass to 1.6 and 1.1 g, respectively. Using the stratospheric observatory SOFIA and ground-based infrared observations, Gehrz et al. (2015) revealed the presence of a dust emission with a blackbody temperature of K, luminosity of 1.7 and a mass of on November 24.04, 2013 (day 102.14). An extensive description of the dust development in V339 Del was presented by Evans et al. (2017), who found that dust formation commenced on day 34.75 at condensation temperature of 1480 K, consistent with graphitic carbon. They determined the rise and fall of the mass of the dust with a maximum at day 100 and the last detection on day 636. Evans et al. (2017) and Shore et al. (2018) considered a possibility of a dust extinction effect in the optical and UV LC, although a strong dust emission in the near-IR was unambiguously indicated (see Sect. 4.1.3 here).
The ejecta mass: Based on the emission measure (EM) from models SED, Skopal et al. (2014) determined the ejecta mass to 1 – 4.6 between day 8 and 38, for the volume filling factor . Using EM and flux measured over the period 253–352 days, Tarasova & Skopal (2016) estimated the ejecta mass to 7 for . Gehrz et al. (2015) obtained 7.5 by estimating the cutoff wavelength during the free–free emission phase, and Shore et al. (2016) derived a range of the ejecta mass to for .
Veiling the WD photosphere: It is best documented by the X-ray emission, which is effectively attenuated by the neutral atoms of hydrogen. X-ray radiation from V339 Del was monitored by the Swift X-ray telescope with the first detection at harder energies (1–10 keV) on September 19 (day 37), whereas a soft component was detected on October 13, 2013 (day 61), indicating the start of visibility of the WD photosphere (Page et al., 2013). Using the data from September 19 to 26, 2013 (day 37 to 44) Page & Beardmore (2013) determined the absorbing hydrogen column density, cm-2. A decrease of around day 45 to cm-2 around day 65 was reported by Osborne et al. (2013). On November 09.75, 2013 (day 88), Gatuzz et al. (2018) determined cm-2 using the Chandra X-ray spectrum. A summary of the X-ray evolution is given by Shore et al. (2016).
| Agea | Date UT | Julian date | Region | Observatory/Ref. |
| JD–JD0 | YYYY-MM-DD | JD 2 456… | ||
| 34.817 | 2013-09-17.717 | 553.217 | CrAOb | |
| 35 | 2013-09-17.5 | 553 | CrAOb | |
| 35.319 | 2013-09-18.219 | 553.719 | 115–289 nm | HST/STIS |
| 35.3 | 2013-09-18.2 | 553.7 | AAVSOc | |
| 35.7 | 2013-09-18.6 | 554.1 | 360–965 nm | FKOd |
| 36.82 | 2013-09-19.72 | 555.22 | 1.15–2.36 m | Mt Abue |
| 44.616 | 2013-09-27.516 | 563.016 | 365–911 nm | FKOd |
| 44.869 | 2013-09-27.769 | 563.269 | CrAOb | |
| 45 | 2013-09-27.5 | 563 | CrAOb | |
| 45.194 | 2013-09-28.094 | 563.594 | n | |
| 58.788 | 2013-10-11.688 | 577.188 | CrAOb | |
| 59 | 2013-10-11.5 | 577 | CrAOb | |
| 59.572 | 2013-19-12.472 | 577.972 | n | |
| 59.637 | 2013-10-12.537 | 578.037 | 365–930 nm | FKOd |
| 67.832 | 2013-10-20.732 | 586.232 | CrAOb | |
| 68 | 2013-10-20.5 | 586 | CrAOb | |
| 68.318 | 2013-10-21.218 | 586.718 | n | |
| 68.582 | 2013-10-21.482 | 586.982 | 365–930 nm | FKOd |
| 71.817 | 2013-10-24.717 | 590.217 | CrAOb | |
| 71.875 | 2013-10-24.775 | 590.275 | 363–720 nm | ARASo |
| 72 | 2013-10-24.5 | 590 | CrAOb | |
| 72.236 | 2013-10-25.014 | 590.636 | n | |
| 74.542 | 2013-10-27.442 | 592.942 | 370–900 nm | FKOd |
| 75.837 | 2013-10-28.737 | 594.237 | n | |
| 76.770 | 2013-10-29.670 | 595.170 | CrAOb | |
| 76.81 | 2013-10-29.71 | 595.21 | CrAOb | |
| 77.534 | 2013-10-30.434 | 595.934 | 371–900 nm | FKOd |
| 77.922 | 2013-10-30.822 | 596.322 | 375–740 nm | ARASo |
| 99.845 | 2013-11-21.745 | 618.245 | 2.3–3.8 nm | XMM-Newton |
| 99.957 | 2013-11-21.857 | 618.357 | 379–736 nm | ARASo |
| 100 | 2013-11-21.5 | 618 | CrAOb | |
| 100.0 | 2013-11-21.9 | 618.4 | AAVSOh | |
| 100.029 | 2013-11-21.929 | 618.429 | 116–307 nm | HST/STIS |
| 100.510 | 2013-11-22.410 | 618.910 | 365–911 nm | FKOd |
| 101.66 | 2013-11-23.56 | 620.06 | Mt Abui | |
| 102.14 | 2013-11-24.04 | 620.54 | OBOi | |
| 102.66 | 2013-11-24.56 | 621.06 | 1.14–11.6 m | Mt Abue |
| 111.835 | 2013-12-03.735 | 630.235 | 375–740 nm | ARASo |
| 112.759 | 2013-12-04.659 | 631.159 | CrAOb | |
| 113.1 | 2013-12-05.0 | 631.5 | AAVSOp | |
| 113 | 2013-12-04.5 | 631 | CrAOb | |
| 113.852 | 2013-12-05.752 | 632.252 | 662–885 nm | ARASo |
| 248.17 | 2014-04-19.07 | 766.57 | 115–570 nm | HST/STIS |
| 248.47 | 2014-04-19.3 | 766.87 | AAVSOj | |
| 253.871 | 2014-04-24.771 | 772.271 | 400–820 nm | FKOd |
| 255.075 | 2014-04-25.975 | 773.475 | 380–750 nm | CrAOk |
| 428.116 | 2014-10-16.016 | 946.516 | 115–307 nm | HST/STIS |
| 428.1 | 2014-10-16.0 | 946.5 | AAVSOl | |
| 393.622 | 2014-09-11.522 | 912.022 | 400–820 nm | FKOd |
| 457.536 | 2014-11-14.436 | 975.936 | 430–730 nm | FKOd |
| 636.076 | 2015-05-11.976 | 1154.476 | 115–307 nm | HST/STIS |
| 636.1 | 2015-05-12.0 | 1154.5 | AAVSOm | |
| 644.851 | 2015-05-20.751 | 1163.251 | 400–743 nm | FKOd |
| 766.198 | 2015-09-19.098 | 1284.598 | 115–171 nm | HST/STIS |
| 867.126 | 2015-12-29.026 | 1385.526 | 115–171 nm | HST/STIS |
aJD0 = 2 456 518.4 (August 13.9, 2013) is the date of nova explosion, bBurlak et al. (2015), c, dFujii Kurosaki Observatory (see Skopal et al., 2014), erepresentative fluxes from Fig. 7 of Evans et al. (2017), h, isee Table 4 of Gehrz et al. (2015), j, kTarasova & Skopal (2016), l, m, nMunari et al. (2013b), ohttp://www.astrosurf.com/aras/ArasDataBase/Novae/Nova-Del-2013.htm, p.
Geometry of the nova: Using the near-IR interferometry, Schaefer et al. (2014) indicated a prolate structure of V339 Del already 2 days after the eruption. Modeling the optical/near-IR SED during first 40 days of the nova evolution, Skopal et al. (2014) suggested a biconical ionization structure of the ejecta with a disk-like H I region encompassing the WD at the orbital plane. During the nebular phase, Tarasova & Skopal (2016) concluded that the ejected material has a disk-polar structure with the orbital inclination of . Values of were suggested by Shore et al. (2016). Using high-resolution spectropolarimetric observations, Kawakita et al. (2019) indicated an expanding equatorial torus surrounding the nova photosphere, which changed to a bipolar geometry during a few days of the nova age.
These results were achieved by analyzing the data covering the X-ray, ultraviolet, optical and near-infrared part of the nova spectrum, in most cases, separately. However, the analysis of multiwavelength observations covering a wide energy range obtained simultaneously at different nova ages can provide a better understanding of the nova evolution.
Accordingly, we reconstruct and model the SED of V339 Del at days when a large fraction of its spectrum is covered by nearly-simultaneous observations taken from day 35 to day 636. In Sect. 2 we summarize the used observations, while Sect. 3 describes our analysis and presents the results. Their discussion and summary are found in Sects. 4 and 5, respectively.
2. Observations
Observations used to model the SED of V339 Del were collected from previous publications and satellite archives. Their timing, spectral range and sources are introduced in Table 1.
The X-ray fluxes of the super-soft source continuum were estimated using the RGS spectrum made with XMM-Newton at day 100. The spectrum was described by Ness et al. (2013). Because of a rich absorption spectrum and a strong C VC VI absorption edge at 31.6 Å, we adopted just the highest peaks in the observed spectrum as the continuum fluxes. We used the figure ‘P0728200201RGX000FLUXED1003.GIF’ available in the XMM-Newton Science Archive (ID: 0728200201).
The ultraviolet HST/STIS spectra were retrieved from the satellite archive with the aid of the Multimission Archive at the Space Telescope Science Institute (MAST). The spectra from days 35 and 100 were first reported by Shore et al. (2013a, b) and published with a detailed description by Shore et al. (2016) together with the spectrum from day 248.
Low resolution optical spectra were carried out at the Crimean Astrophysical Observatory (Tarasova & Skopal, 2016), at the Fujii Kurosaki Observatory (FKO) by M. Fujii222 http://otobs.org/FBO/fko/nova/novadel2013.htm and from the ARAS database333 http://www.astrosurf.com/aras/ArasDataBase/Novae/Nova-Del-2013.htm. Spectroscopic observations from the FKO and ARAS were described by Skopal et al. (2014, 2017). Additional flux-points from the near-IR spectrum obtained at the Mt Abu observatory were reconstructed from Fig. 7 of Evans et al. (2017). Spectroscopic observations were supplemented with the photometric measurements of Burlak et al. (2015), photometry of Gehrz et al. (2015) and magnitudes of Munari et al. (2013b) and/or The AAVSO International Database444https://www.aavso.org/data-download.
To obtain flux-points of the true continuum using the magnitudes, we corrected them for emission lines measured on the low-resolution spectra using the method of Skopal (2007). The contribution of emission lines to the continuum was rather significant, mainly during the nebular phase, because of strong [O III] 4363 Å, 4950 Å, 5007 Å nebular lines and relative faint continuum (see Table 2). Magnitudes of the true continuum were converted to fluxes according to the calibration of Henden & Kaitchuck (1982) and Bessell (1979). Finally, the continuum flux-points were used to scale the relative flux units of the low-resolution spectra to absolute fluxes. Observations were dereddened with = 0.18 using the extinction curve of Cardelli et al. (1989), and resulting parameters were scaled to a distance of 4.5 kpc (see Sect. 1).
| Day | a | |||
|---|---|---|---|---|
| 35 | -0.1 | -0.59 | -0.43 | -1.18 |
| 45 | -0.06 | -0.68 | -0.49 | -1.00 |
| 59 | -0.1 | -0.87 | -0.57 | -1.27 |
| 68 | -0.1 | -1.16 | -0.89 | -1.36 |
| 72 | -0.06 | -1.06 | -0.77 | -1.32 |
| 77 | -0.07 | -1.00 | -0.78 | -1.28 |
| 100 | -0.13 | -0.87 | -0.68 | -1.12 |
| 113 | -0.07 | -1.09 | -0.91 | -1.32 |
| 248 | – | -1.34 | -1.39 | -1.11 |
| 428 | – | -1.42 | -1.64 | -1.18 |
| 636 | – | -1.37 | -1.68 | -1.64 |
a Spectrum covers only a part of the -passband range.
3. Analysis and results
The primary aim of this paper is to model the SED of V339 Del throughout its iron-curtain phase (day 35), transition to the SSS phase (days 45, 59, 68, 72 and 77), the SSS phase (day 100, 113 and 248) and nebular phase (day 428 and 636). We achieve this aim by using the method of multiwavelength modeling the X-ray to IR composite continuum as described by Skopal (2005, 2015a). Its application to the case of classical nova V339 Del is briefly introduced below.
3.1. Multiwavelength modeling the SED
In our modeling we assume that the gamma photons generated in the burning layer on the WD surface are reprocessed by the outside material into softer energies, distribution of which throughout the electromagnetic spectrum depends on the nova age. Other primary sources of the radiation are not considered.
Basic characteristics of the nova V339 Del, as inferred from its spectrum in different domains and dates (see Sect. 1), suggest that the continuum consists of three main components of radiation. The stellar component, , produced by the WD pseudophotosphere, the nebular, , and dust, , component that represent a fraction of the stellar radiation reprocessed by the ejected material. The spectrum of the nova, , as observed at the Earth, is given by their superposition, i.e.,
| (1) |
During the fireball stage, the outer shell transfers the inner energetic photons to its optically thick/thin interface (i.e., the WD pseudophotosphere), which redistributes their energy chiefly within the optical. The observed spectrum can be compared with an atmospheric model for a star of spectral type A to F, while and components can be neglected (see Skopal et al., 2014).
During the transition to harder spectrum the WD pseudophotosphere shrinks and becomes hotter. As a result, the spectrum shifts the maximum of its SED to shorter wavelengths and the WD pseudophotosphere ionizes the outer material, giving rise to the nebular emission. Its continuum is approximated by contributions from f–b and f–f transitions in hydrogen plasma, while the stellar continuum and that from the dust are compared with the blackbody radiation at a temperature and , respectively.
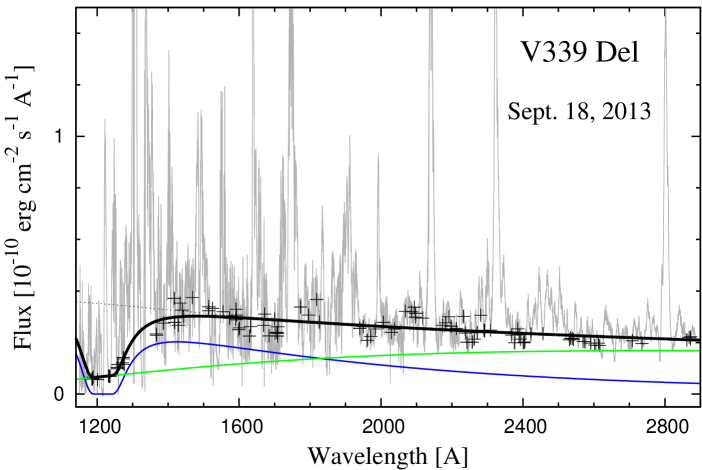
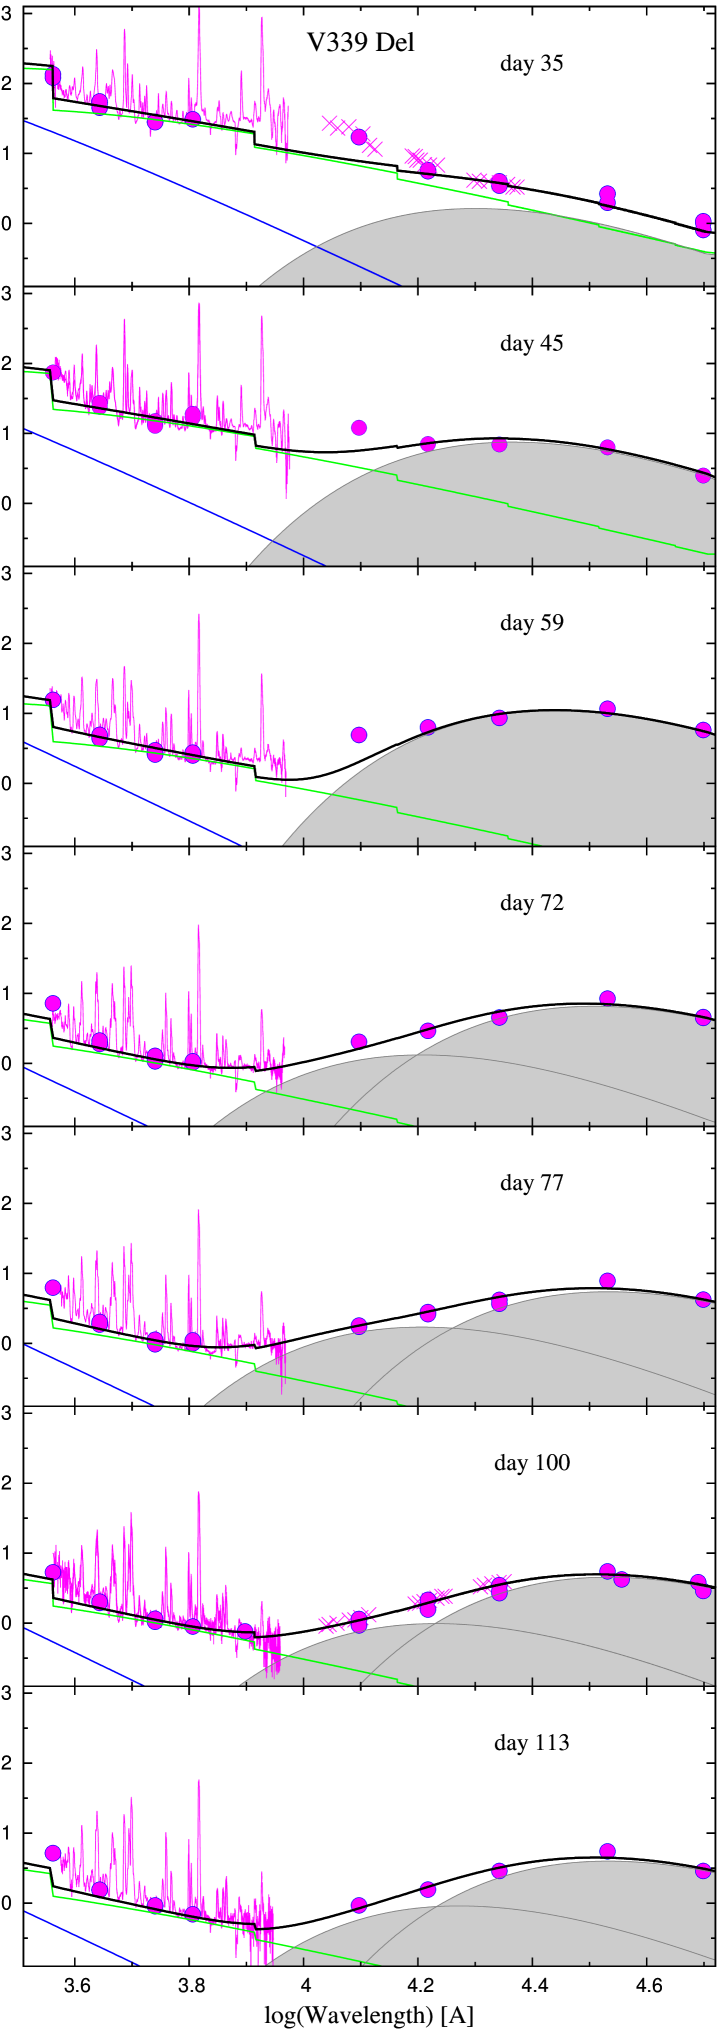
In the SED-fitting analysis, we compare a grid of models (1) for the given day (see below) with the fluxes of the observed continuum and select that corresponding to a minimum of the reduced function. Because of a rich emission line spectrum in the UV, it was difficult to identify its true continuum (see e.g., Fig. 2). Therefore, we adopted uncertainties in the measured continuum as high as 10%.
3.1.1 Modeling the iron-curtain spectrum on day 35
Observations used to model the SED of V339 Del at day 35 cover the spectral range from the far-UV to the near-IR (115 nm to 5 m, Table 1). Specific features of the observed spectrum are the flat UV continuum and its attenuation around the Ly- line (Fig. 2). The latter can be ascribed to the Rayleigh scattering of the far-UV photons by neutral atoms of hydrogen (e.g., Nussbaumer et al., 1989). It causes the optical depth, , where is the Rayleigh cross-section for scattering by hydrogen in its ground state (see Eq. (5) and Fig. 2 of Nussbaumer et al., 1989). Therefore, the attenuation of the continuum by Rayleigh scattering provides an estimate of between the emitting source and the observer. According to the above-mentioned assumptions and Eqs. (5) and (11) of Skopal (2005), our Eq. (1) can be written in the form,
| (2) |
where is the angular radius of the WD pseudophotosphere, given by its effective radius (i.e. the radius of a sphere with the same luminosity) and the distance . The second term at the right is the nebular continuum expressed by its volume emission coefficient, (), scaled with the factor . The emission measure, , is given by the proton and electron concentration, and within the volume of the ionized hydrogen. Finally, the third term represents the radiation from the dust diluted at the Earth with the factor .
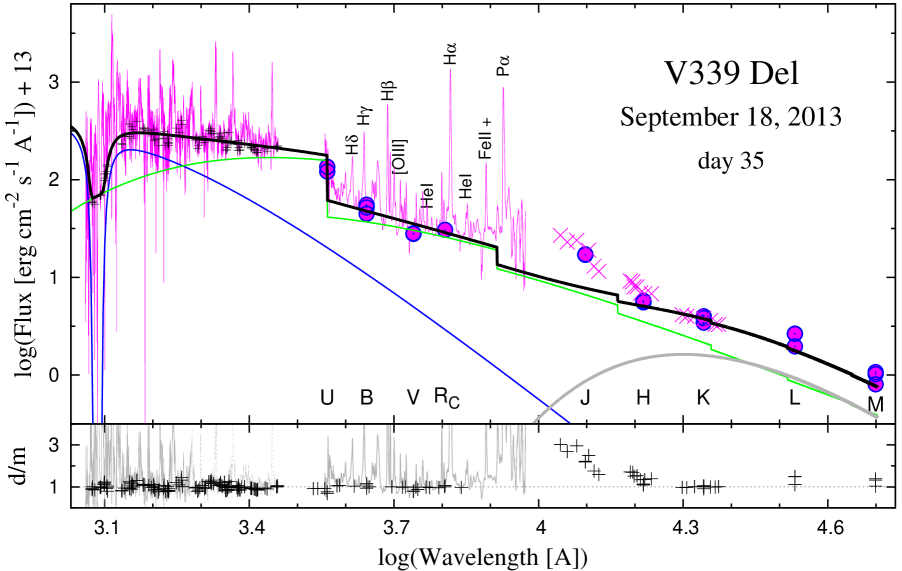
In modeling the global SED, we first fitted 105 UV continuum fluxes from 1185 to 2873 Å and 17 optical fluxes from 3412 to 6918 Å by Eq. (2) without the dust component. Second, we filled in the residual flux at flux-points with a blackbody radiation to estimate parameters of the dust emission. In this way we obtained parameters , and for the stellar component, and for the nebular component and and for the dust component of radiation. The luminosity of the WD pseudophotosphere is given as
| (3) |
Finally, the model SED clearly extracts the unidentified source of emission around 1 m (see Fig. 3), whose presence was already noted by Gehrz et al. (2015).
3.1.2 Modeling the optical/near-IR spectrum during the transition to the SSS phase
This period in the nova evolution is characterized with a steep decline of the optical brightness between day 35 and 72, and the presence of a strong near-IR emission. Our observations cover the nova age between day 45 and 113, and consist of low-resolution optical spectra and photometry (Table 1). During this period, the optical/near-IR continuum is dominated by the nebular emission and that from the dust. Therefore, we used these components to determine the model SED,
| (4) |
where the variables, , , and are explained in Sect. 3.1.1. Dominance of the nebular continuum and the dust emission in the optical and in the near-IR, respectively, allows us to determine both the components independently. Similarly to Eq. (3) we determine the effective dust luminosity as . Finally, we formally included the stellar component with K and scaling, subtly influencing the short-wavelength part of the optical. Models are shown in Fig. 10.
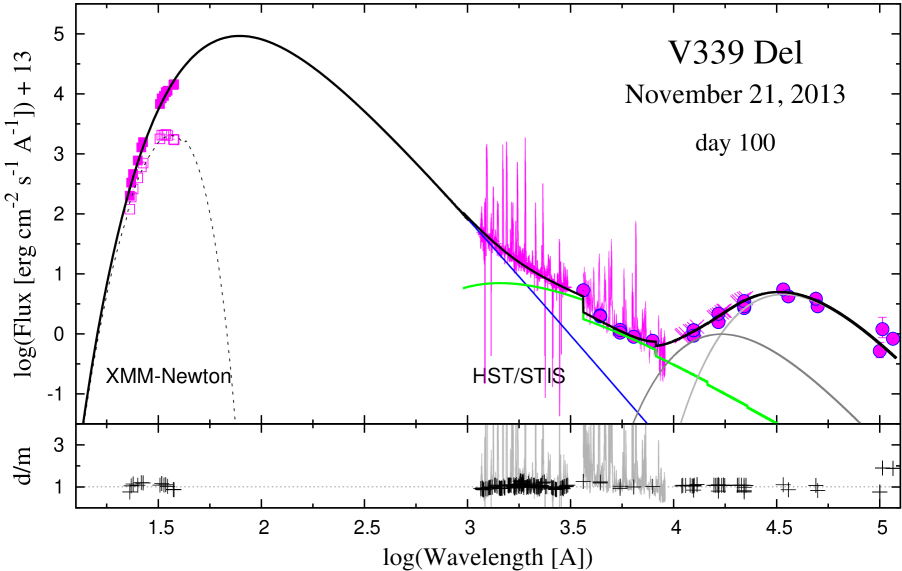
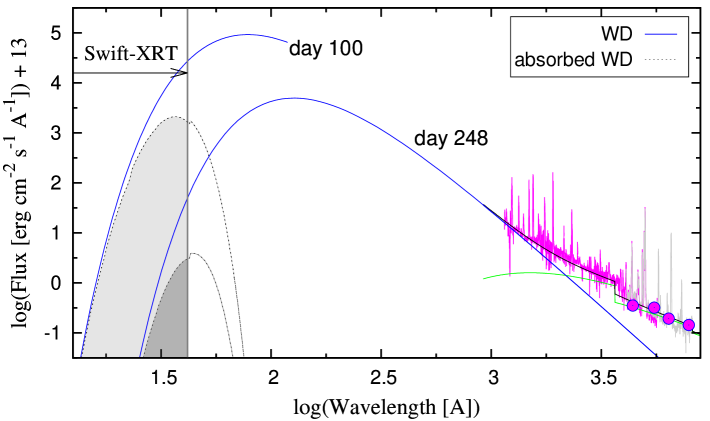
3.1.3 Modeling the SSS spectrum on day 100 and 248
At the nova age of 100 days, we modeled its SED from the super-soft X-rays to the IR/N-band (2.3 nm to 11 m, Table 1). The spectrum is characterized with very high X-ray fluxes, a steep UV/optical continuum and a large emission bump in the IR. In principle, the procedure of modeling is the same as in the previous case, but the observed X-ray fluxes have to be corrected for bound–free absorptions within the interstellar (ISM) and circumstellar (CSM) matter. In this case the first term of Eq. (1) is expressed as,
| (5) |
where is the total cross-section for photoelectric absorption per hydrogen atom (e.g. Cruddace et al., 1974). Here, we used the tbabs absorption model for ISM composition with abundances given by Wilms, Allen & McCray (2000) (e.g., ).
In the spectrum at day 100, we simultaneously fitted 13 absorbed X-ray continuum fluxes from 23 to 38 Å, 105 dereddened UV fluxes from 1161 to 3066 Å and 13 optical fluxes from 3554 to 8095 Å, searching for parameters , , , and . The dust component was determined independently, because of a significant excess of its emission with respect to the nebular and stellar component in the IR. Comparing blackbody radiation to fluxes from 1.1 m to 11.6 m revealed the presence of two components of the dust emission. The larger and cooler component (3.4m) was already identified by Gehrz et al. (2015), while the smaller and hotter one (1.7m) is constrained by our global SED (see Fig. 4).
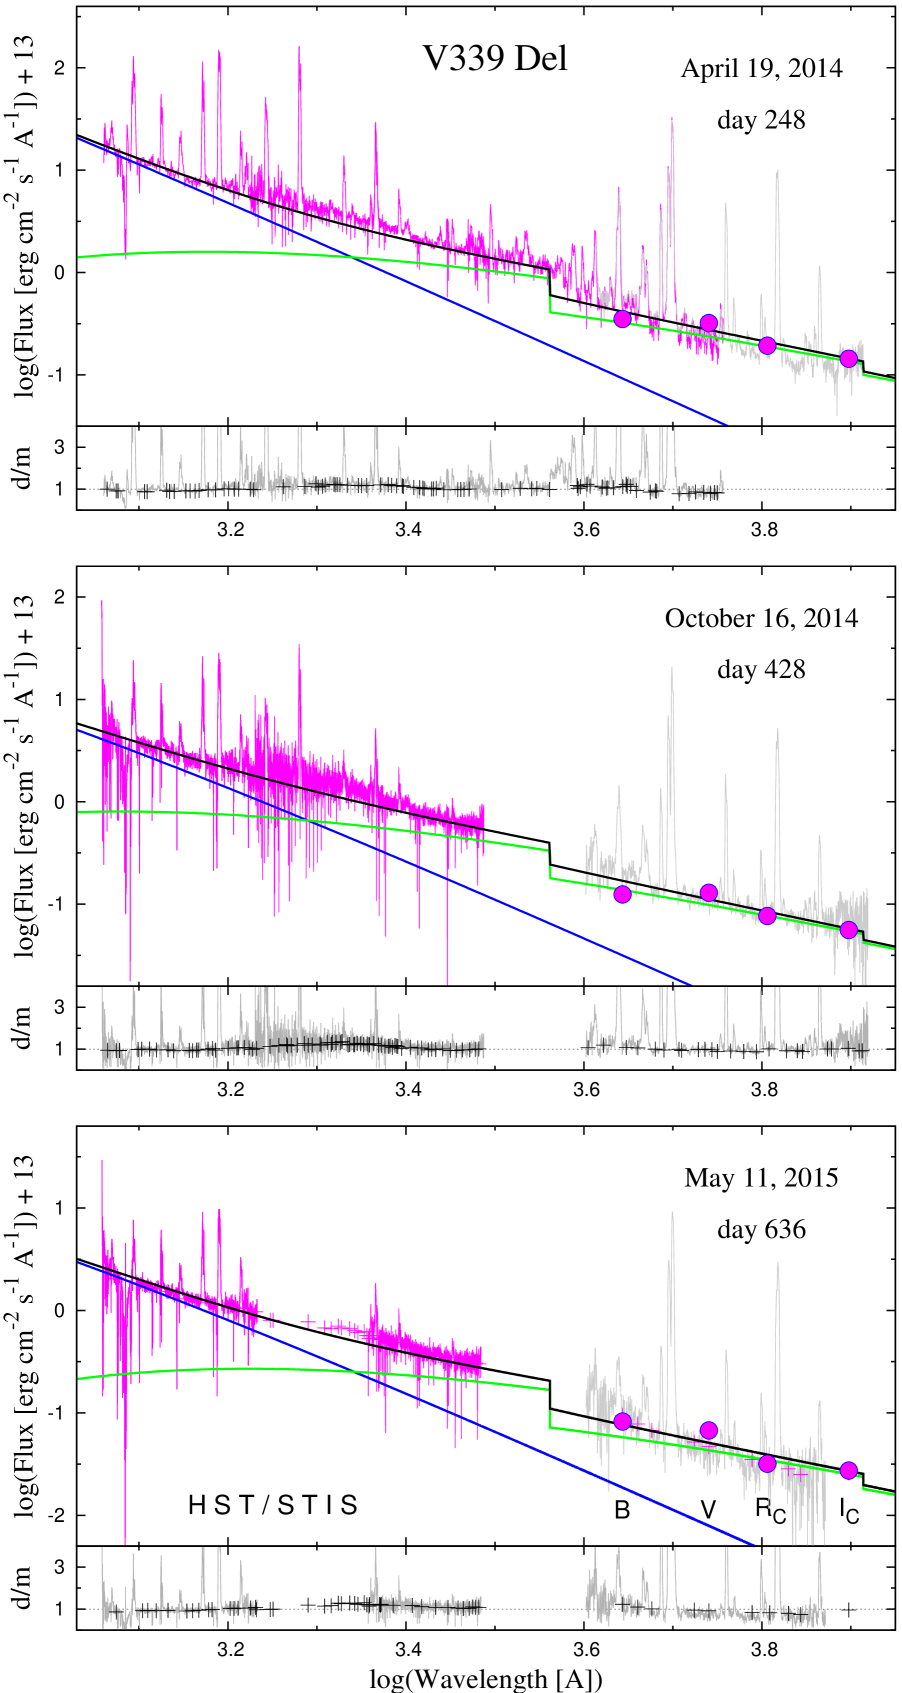
During the late SSS phase on day 248, the Swift-XRT count rate was reduced by a factor of 1000 relative to day 100. The continuum used to model the SED was determined by the UV HST/STIS and optical spectra (1150 to 8200 Å, Table 1). Strong far-UV continuum and its steep slope towards the longer wavelengths suggests a dominant contribution from a hot WD in the far-UV, while a relative flat and strong optical continuum constrains the presence of a hot nebular radiation. Therefore, we fitted the observed SED using Eq. (2) restricted to the stellar and nebular component of radiation only, i.e.,
| (6) |
where variables , , and are described in Sect. 3.1.1. Here, we fitted 81 UV/optical continuum fluxes from 1159 to 5620 Å of the HST/STIS spectrum with the function (6). In this way we determined parameters , and for the fixed . Under the condition that the radiation from the WD pseudophotosphere fits the UV/optical SED and generates the Swift-XRT count rate, it was possible to estimate the value of independently (see Appendix A in detail). For the observed rate of 0.025 photons s-1 (see Fig. 1 of Shore et al., 2016) and the flux, e.g., (1195 Å) = 1.37, we obtained kK. The model SED for day 248 is shown in Fig. 5.
3.1.4 Modeling the nebular spectrum on day 428 and 636
During the nebular phase, the spectrum was modeled in the same way as that from day 248, because their SED profile was of the same type (see Fig. 5). They differed only in the continuum level, which decreased with a factor of 3 and 7 on day 428 and 636 with respect to day 248. In both cases we estimated the lower limit of to K, as given by the presence of the N V 1238.8 Å, 1242.8 Å resonance doublet ( eV, see Sect. 3.2), and its upper limit to K, at which the WD radiation is just outside of the Swift-XRT energy range.
3.2. Temperature of the WD pseudophotosphere
The WD temperature in novae depends on their age. Its determination is not often unique. Here, we introduce cases for day 35, 100 and 248, when the models SED allow to determine a reliable value of .
3.2.1 on day 35
At the nova age of 35 days, the unusually flat UV continuum and the slope of the optical to near-IR continuum are given by superposition of the stellar radiation from a relatively warm WD pseudophotosphere and a large amount of a hot nebular radiation (Fig. 3, Table 3). Such the special profile of the UV–IR SED provides unambiguous solution. However, the observed WD radiation is not capable to give rise to the large amount of the nebular emission. The observed, 31 000 K warm, stellar pseudophotosphere (Table 3) generates the flux of hydrogen ionizing photons s-1, which can produce a maximum of cm-3 (see Sect. 3.3 in detail) for the total hydrogen recombination coefficient (e.g., Nussbaumer & Vogel, 1987). However, this value is a factor of 23 below the measured quantity of cm-3 (Table 3). This implies that there is a powerful ionizing source in the center radiating at the ionization temperature , which is not seen directly by the outer observer at day 35.
The lower limit of is given by the presence of an ion in the nebula with the highest ionization energy , because it requires photons with . According to Mürset & Nussbaumer (1994), , where is in eV. The presence of N IV 1486 Å ( eV) emission line suggests K. On the other hand, absence of the N V 1238.8 Å, 1242.8 Å ( eV) resonance doublet in emission (see Shore et al., 2016) suggests K. Thus the temperature of the ionizing source on day 35 is in the range of 77 000 K – 98 000 K.
3.2.2 on day 100
At the nova age of 100 days, we determined directly by modeling the X-ray to IR continuum under the assumption that both X-ray and far-UV fluxes are emitted by the WD pseudophotosphere (see Sect. 3.1.3). Our value of kK is close to the estimate of 350 kK made by Ness et al. (2013) on the basis of solely the X-ray fitting and assuming cm-2. We note that determination of the effective temperature of the hot WD photosphere would require exact fitting of its rich absorption-line spectrum using a non-LTE model atmosphere analysis (e.g. Lanz et al., 2005). This challenging task is out of the scope of this paper.
3.2.3 on day 248 and beyond
During the late SSS phase (day 248), was determined by modeling the UV/optical SED with the aid of the measured Swift-XRT count rate (Sect. 3.1.3, Appendix A). In this way, we obtained kK. A relative small error is constrained by having defined the WD spectrum from both the short- and the long-wavelength side, similarly to day 100.
During the nebular phase (day 428 and 636), only the range of possible can be estimated on the basis of the presence of emission lines with the highest ionization potential and the condition of no emission within the Swift-XRT energy range (Sect. 3.1.4).
| WD pseudophotosphere | Nebula | Dust | ||||||||
| Age | ——————————————- ————————— —————————————— | /d.o.f. | ||||||||
| (d) | () | (kK) | () | () | (kK) | () | (K) | () | () | |
| 35 | 110 | 31 | 5.9 | 38.05 | 26 | 190 | 1450 | 890 | 3120 | 1.69/121 |
| 45 | 30 | 84.8 | 1250 | 2760 | 16600 | – | ||||
| 59 | 30 | 14.5 | 1050 | 5200 | 29000 | – | ||||
| 68 | 40 | 9.7 | 1000 | 5030 | 22700 | – | ||||
| 72 | 50 | 8.48 | 900 | 5800 | 20100 | – | ||||
| 1800 | 460 | 2030 | ||||||||
| 77 | 50 | 8.0 | 850 | 6200 | 17800 | – | ||||
| 1800 | 530 | 2630 | ||||||||
| 100 | 1.02 | 369 | 0.20 | 39.43 | 50 | 8.48 | 850 | 5630 | 14840 | 0.89/126 |
| 1700 | 464 | 1600 | ||||||||
| 113 | 50 | 6.1 | 850 | 5300 | 13100 | – | ||||
| 1550 | 560 | 1600 | ||||||||
| 248 | 0.8 | 227 | 0.16 | 38.36 | 48 | 1.96 | 1.50/77 | |||
| 428 | 0.8 | 100b | 0.15 | 36.87 | 60 | 0.91 | 1.27/94 | |||
| 160b | 0.10 | 37.38 | 60 | 0.95 | 1.62/94 | |||||
| 636 | 0.8 | 100b | 0.11 | 36.64 | 43 | 0.34 | 1.85/51 | |||
| 160b | 0.08 | 37.12 | 46 | 0.39 | 2.27/51 | |||||
| 766 | 0.9 | |||||||||
| 867 | 0.8 | |||||||||
| Notes: from the measured EM (see Sects. 3.2 and 3.3), fixed value (see Sects. 3.2) | ||||||||||
3.3. Luminosity of the burning WD
The bolometric luminosity, , of the hot burning WD at day 35 can be estimated only indirectly, under the assumption that the total flux of hydrogen ionizing photons, , is converted into the nebular radiation. Then having the quantity of EM from observations we can estimate the corresponding for the given temperature of the ionizing source.
Assuming further that the nebula is characterized with a constant electron temperature, , we can approximate the equilibrium condition between and the rate of recombinations in the nebula as
| (7) |
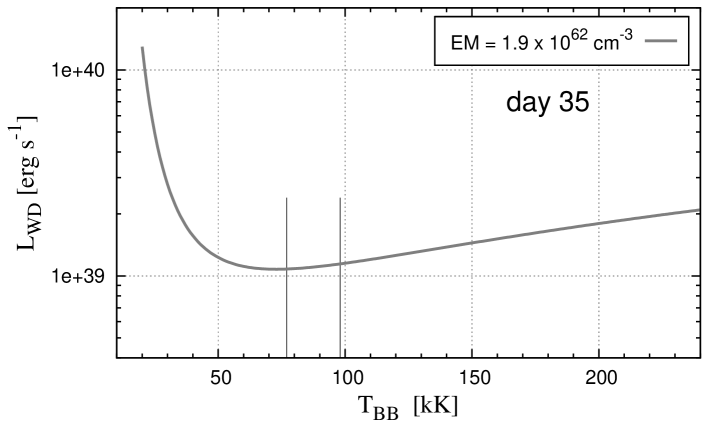
where is the recombination coefficient to all but the ground state of hydrogen (i.e., Case ). Quantity of is given by the temperature and luminosity of the ionizing source, while the value of EM is determined by the model SED. According to Skopal et al. (2017) the luminosity of the ionizing source, which produces the observed EM, can be expressed as
| (8) |
where the function determines the flux of ionizing photons emitted by 1 cm2 area of the ionizing source (cm-2 s-1). Figure 6 shows Eq. (8) for the observed EM = cm-3. The temperature range of the ionizing source, 77 000 K – 98 000 K (Sect. 3.2), corresponds to .
Optically thick conditions, where the nebular continuum growths from complete absorption of stellar photons with Å, are of critical importance for the validity of the above approach. A signature of the optically thick conditions is the presence of elements at very different ionization states in the spectrum (see Kaler & Jacoby, 1989, and references therein). On day 35, emission lines of N II–IV, C I–IV, Si IV, He I–II, H I, O I, [O I] and Fe II as indicated in the UV–optical spectrum of V339 Del (see Figs. 3, 8 and A.1. of Shore et al., 2016) suggest that the nebula is rather ionization-bounded, that is, the stellar radiation below 912 Å (13.6 eV) is absorbed within the nebula. Also, no detection of ionizing photons on day 35 within the Swift-XRT energy range (see Fig. 1 of Shore et al., 2016) supports this case.
During the SSS phase, direct observation of a significant fraction of the hydrogen ionizing photons in the form of super-soft X-ray emission (Fig. 4) means that the nebula of V339 Del became to be particle-bounded. As a result its EM significantly dropped with respect to the value from day 35 (Table 3). The method above (Eq. (8)) is not applicable for the spectrum from day 100. Instead, we can directly integrate the stellar component of radiation given by the X-ray/near-IR model SED, which yields . This value justifies those obtained indirectly using the nebular component of radiation.
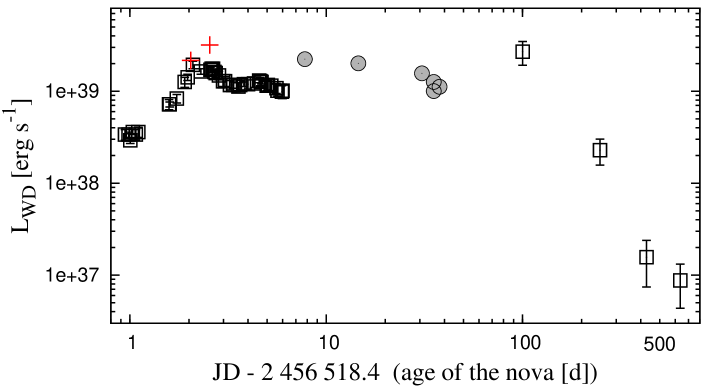
Luminosities during the late SSS and nebular phase relay on estimates of the corresponding (see, Sect. 3.2). Figure 12 shows evolution of the WD luminosity as a function of the nova age. It demonstrates a long-lasting super-Eddington luminosity of the burning WD in V339 Del at least for the first 100 days of its life.
3.4. Veiling of the WD by neutral hydrogen
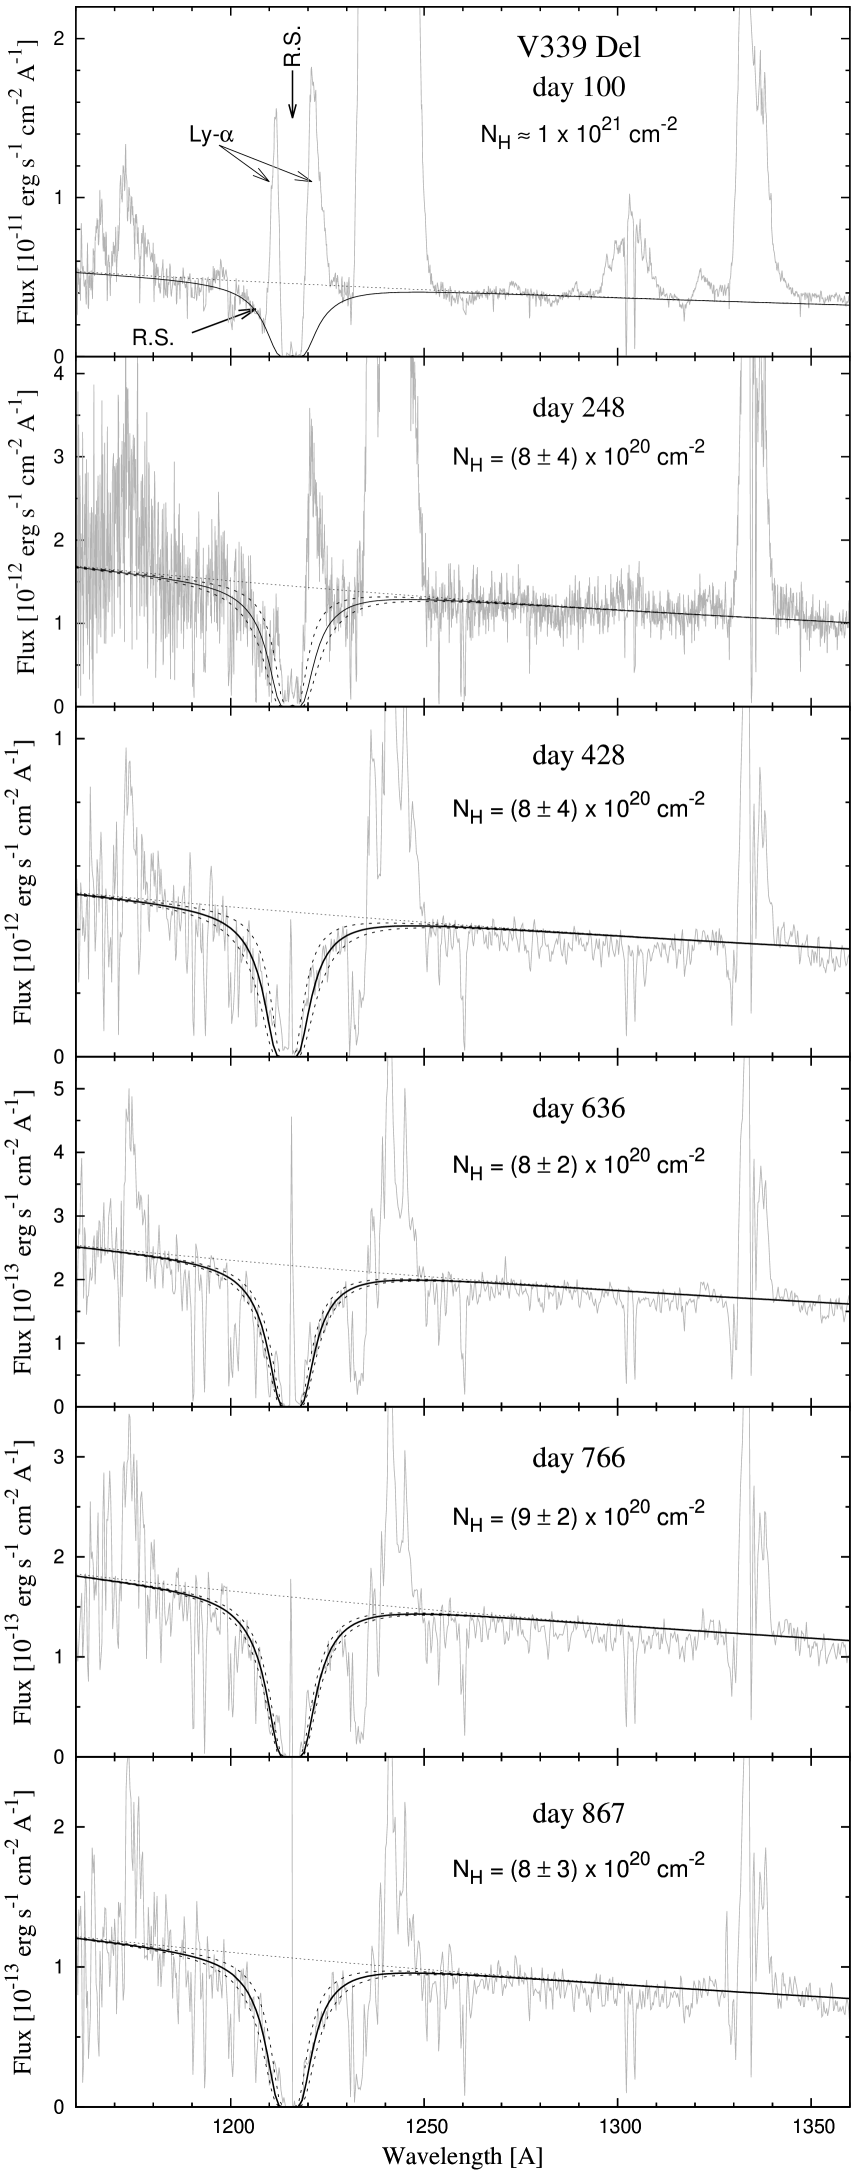
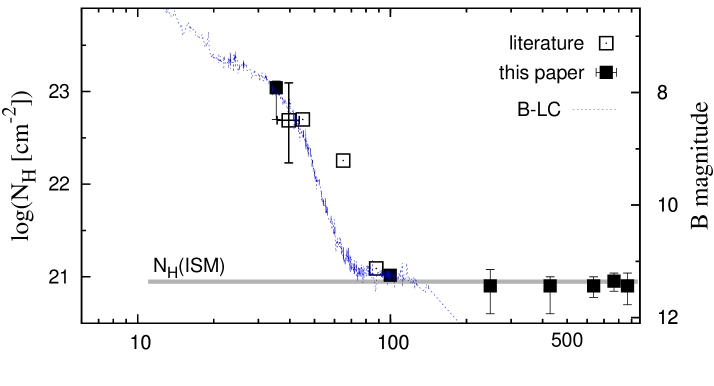
Apart from b–f absorptions of X-ray photons by hydrogen atoms, the hydrogen column density between the WD pseudophotosphere and the observer, , can be also determined from attenuation of the far-UV continuum around the Ly- line, which is caused by Rayleigh scattering on H atoms (Sect. 3.1.1). On day 35, the continuum depression around Ly- was stretched up to 1400 Å (Fig. 2), which corresponds to cm-2, in agreement with the following estimates from X-ray observations (Fig. 8). Such the high value of is in major part given by its CSM component. It is of interest to note that signatures of Rayleigh scattering, corresponding to similar values of , developed also in the spectra of the symbiotic nova PU Vul and classical nova V723 Cas during their transition to harder spectrum (see Fig. 1 of Skopal, 2014).
On day 100, having observed the super-soft X-ray component of the nova spectrum, we determined directly by modeling the SED (Sect. 3.1.3) to cm-2. This value corresponds to the interstellar component, because it is relevant to the extinction to the nova, mag (e.g., Diplas & Savage, 1994). Comparison of the far-UV spectrum with the Rayleigh scattered model continuum also supports this value of , although the influence of the Ly- emission is significant (see the top panel of Fig. 7).
During the following observations (day 248, 428, 636, 766 and 867) attenuation of the far-UV continuum by Rayleigh scattering was clearly recognizable, corresponding just to the ISM component of cm-2 with uncertainties up to 50% (Table 3, Fig. 8), depending on the S/N ratio555To suppress the noise, we smoothed the spectra using average values of fluxes within 0.25 Å.. Therefore, in contrast to Eq. (2), we attenuated the total model continuum, , with the function exp, because the only present ISM component of attenuates both the stellar and the nebular radiation from the nova. As a result, the rest flux around the reference wavelength is close to zero (see Sect. 4.4).
4. Discussion
4.1. Transition from the iron-curtain to the SSS phase
Here we discuss the steep decline of the optical brightness, EM and between day 35 and 72. With the aid of models SED we endeavor to find its origin.
4.1.1 Stopping the mass-outflow from the WD
Models SED show that the nebular component of radiation dominates the near-UV to optical spectrum for the nova age 35 days (Figs. 3, 4, 5 and 10). It represents a fraction of the WD’s radiation converted by the ejecta into the nebular radiation via f–f and f–b transitions. Its flux is given by the EM of the ionized gas (see Sect. 3.1.1, Eq. (2)). Therefore, knowing the EM from the model SED, we can estimate the mass of the ionized ejecta and the corresponding mass-loss rate from the WD, . According to the simplified approach of Skopal et al. (2014), can be expressed as,
| (9) |
where is the mean molecular weight and the mass of the hydrogen atom, while denotes the expansion velocity of the ejecta, is the filling factor, where is the opening angle of the expanding ionized region, whose EM is integrated from to the outer radius of the nebula, .
For a mean expansion velocity of 750 km s-1 derived from the HWHM of the hydrogen emission lines (Tarasova & Skopal, 2016; Evans et al., 2017) and parameters of the model SED, and EM (Table 3), we obtain for day 35, while on day 72, when the drop in the brightness and in the EM came to a stand-still (Fig. 8), decreased by a factor of 25, to . We assumed and , which corresponds to a maximum of .
Thus, the rapid decline of the EM during the brightness fall (days 35–72) was caused by a significant stopping-down the mass-outflow from the WD.
4.1.2 On the nature of the steep brightness decline
This period in the nova evolution is characterized by a significant decrease of its optical brightness by mag and mag between day 35 and day 72 (see Fig. 1). Simultaneously, decreased from to its ISM value of cm-2 and EM decreased from to cm-3 (Fig. 8).
According to models SED (Figs. 3, 4 and 10), the fall of the optical brightness prior to the SSS phase was caused by the decrease of both the nebular and the stellar continuum. A distinctive increase in and to day 100 shifted the maximum of the stellar component to shorter wavelengths and made both the continua much steeper than on day 35, which yields . This is because the nebular component, (Sect. 3.1.1), dominates the optical, and thus we can estimate the value of the drop as,
| (10) |
where indices 35 and 72 denote quantities corresponding to these days of the nova age. For values of EM, in Table 3 and the continuum-emission coefficient introduced by, e.g., Brown & Mathews (1970), Eq. (10) yields and mag, in agreement with the observed values.
Simultaneous fading of both the and EM between day 35 and 72 was caused by a drop in the (Sect. 4.1.1), which considerably lowers particle concentration of the nebula, and thus its absorbing ability and emissivity. As a result, the ejecta became optically thinner for harder photons, which led to shrinking of the WD pseudophotosphere, the increase of its temperature and, consequently, an increase of the electron temperature of the irradiated nebula (Table 3). Therefore, the very steep optical brightness decline with the power of -5 to -7 in fluxes (see Fig. 9) was in part caused by shifting of both components of radiation from the optical to shorter wavelengths. The nova settled at the SSS phase.
4.1.3 Is there a dust extinction along the line of sight?
Based on models SED we suggested that the simultaneous drop in the stellar brightness, EM and , during the transition from day 35 to the SSS phase, is caused by stopping-down the mass-loss from the WD (Sects. 4.1.1 and 4.1.2). On the other hand, Evans et al. (2017) ascribed the decline in the visual LC to dust extinction. However, following facts do not support this view.
-
1.
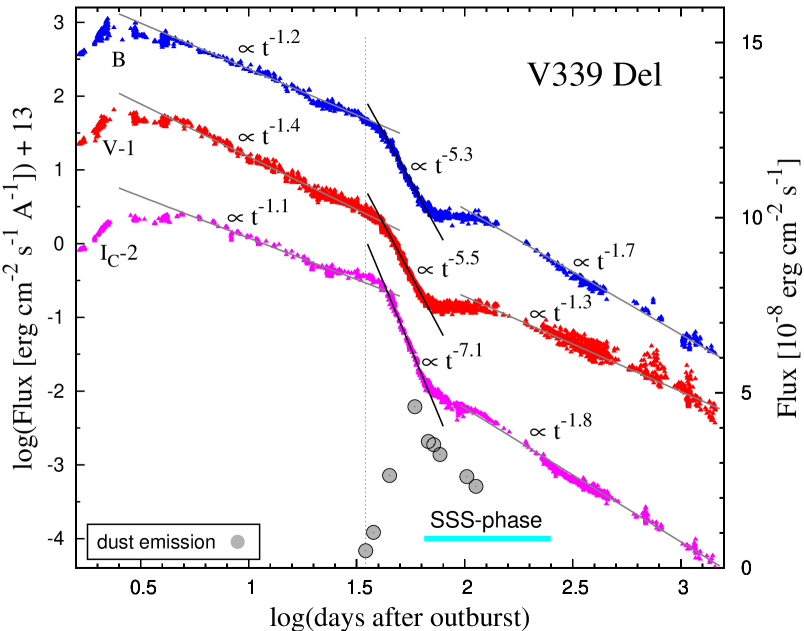
The observed fall of the flux in the band ( Å) is steeper and larger than in the band ( Å). Figure 9 demonstrates this case. The slope of flux , while , which corresponds to during the flux fall (see also Eq. (10)). Such the behavior contradicts attenuation of the light by the dust (e.g., Cardelli et al., 1989). For a comparison, the wavelength dependence of dust extinction was clearly demonstrated for the nova V5668 Sgr (see Fig. 3 of Gehrz et al., 2018).
- 2.
-
3.
The IR-excess produced by the dust emission was clearly measured already on day 34.8, i.e., around 6–7 days prior to the steep flux decline (Fig. 9).
Shore et al. (2018) suggested that a short-lasting dip in the Swift-UV LC around day 77 (see their Fig. 11) signals formation of dust, although there is no counterpart seen in the optical LC (see e.g., precise LCs of Munari et al., 2015). However, our optical/near-IR models SED indicate creation of the dust more than one month prior to the dip in the continuum. A rapid growth of the near-IR emission happened already between day 35 and 45, with a maximum around day 59 (Figs. 9 and 10). It is of interest to note that the dip coincides with emergence of the rapid variation in the Swift-XRT count rate (see Fig. 1 of Shore et al., 2016), which suggests their common origin. According to models SED, the -ray to continuum (2000 Å) is dominated by the radiation from the WD photosphere, and thus these events probably reflect its variability. However, the optical is contaminated by the nebular continuum, which overlays the presumable variation of the stellar component. This suggests that the agent (dense clumps?) responsible for the changes in the -ray/ continuum is located above the ionizing source, but below the extended nebula (EM cm-3), whose light cannot vary on the timescale of days.
To answer the question of this section, it is also important to consider the effect of hard radiation on the survival of dust in the nova environment. This effect was discussed in detail by Fruchter et al. (2011), who considered grain heating and grain charging as two principal mechanisms responsible for dust destruction. Using their approach, Evans et al. (2017) found that charging of grains by -radiation is more than sufficient to shatter the grains around V339 Del already before day 100. Also Gehrz et al. (2018) showed that the -ray fluence is sufficient to destroy the dust in the nova V5668 Sgr if the grains are exposed to X-rays for 1 month. On the other hand, to explain the asymmetry in the line profiles with a suppressed red wing, Shore et al. (2018) state that there is no need to invoke dust destruction at late times in either V5668 Sgr or V339 Del, even under irradiation by the -ray and EUV from the central star666However, a depression of the red wings due to blocking a fraction of the radiation from the receding ejecta by the disk (see Sect. 4.1. of Skopal et al., 2006) was not considered..
According to the arguments above (points 1. to 3. of this section) and our interpretation (Sect. 4.1.2), we conclude that there is no detectable dust extinction along the line of sight during the steep drop in the star’s brightness. Hence, the presence of a strong near-IR emission throughout this period (Fig. 10) and far beyond it (Evans et al., 2017) requires a non-spherical arrangement of the dust region within the nova ejecta.
4.2. On the structure of the nova ejecta
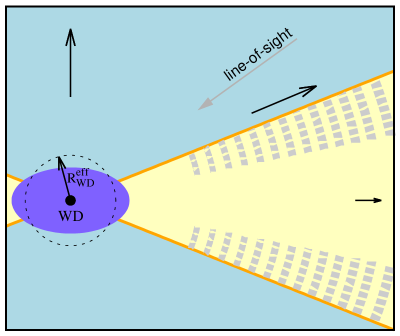
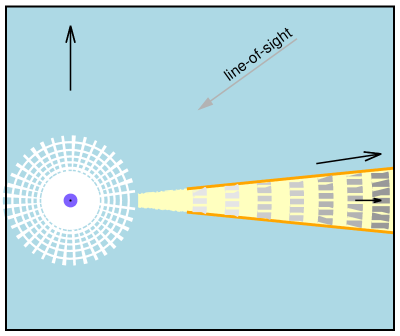
Already two days after the explosion, observations indicated a prolate structure of the nova. Later evolution suggested a biconical, disk-polar ionization structure of the ejecta (see Sect. 1). Here, Fig. 11 shows a sketch for the nova ejecta as can be inferred from models SED on day 35 and 100, just before and after the sudden drop in the star’s brightness. It is similar to that derived from radio imaging of V959 Mon (see Fig. 3 of Chomiuk et al., 2014), specifying some details of its inner part.
4.2.1 The oblate shape of the WD pseudophotosphere
On day 35, the flat UV continuum is a result of superposition of a relatively warm stellar and a strong nebular component of radiation (Fig. 3). The former is not capable of giving rise to the observed nebular emission and thus the latter signals the presence of a strong ionizing source in the system with , which is not seen directly by the observer (see Sect. 3.2.1). Such the type of the spectrum is called the two-temperature-type UV spectrum. It is often observed during Z And-type outbursts of symbiotic binaries, where it is followed by emergence of an attenuation of the far-UV continuum by Rayleigh scattering on a few times hydrogen atoms (see Sect. 5.3.4., Fig. 27 and Table 4 of Skopal, 2005). The corresponding SED is explained by a disk-like structure of the WD pseudophotosphere, whose hotter regions with smaller radii are located at/around its poles and vice versa, cooler regions with larger radii are located towards the WD equator.
Accordingly, the day 35 model SED of V339 Del suggests such the oblate shape of the WD pseudophotosphere (see Fig. 11, top) with relevant non-spherical temperature distribution: the observed 31 kK warm pseudophotosphere and 77 – 98 kK hot central ionizing source (Sect. 3.2.1). A higher density stellar wind in the direction of the observer creates the optically thick/thin interface (i.e., the WD pseudophotosphere) at a larger distance from the wind origin than at its pole. The wind gives rise to a large amount of CSM above it as indicated by the high value of , which precludes detection of the super-soft X-rays on day 35.
4.2.2 Dusty disk during the SSS phase
The day 100 model SED indicates the simultaneous presence of a strong dust emission and luminous high temperature super-soft X-ray source in the nova. This fact and no detection of the dust extinction along the line of sight (Sect. 4.1.3) constrain a non-spherical distribution of the dust within the ejecta. According to the biconical ionization structure of the ejecta with an equatorially concentrated outflow (see Fig. 9 of Skopal et al., 2014), we will assume that the dust is located within the cooler and denser equatorial zone, where it is shielded from the hard radiation of the WD (see Fig. 11). Shaping of the dust into a flat disk/ring around the heating source is also supported by the long-lasting presence of the dust, to day 680 (Evans et al., 2017), because its radial thickness for the incident radiation is extremely large ( cm; Table 3).
From day 72, the models SED indicate two components of the dust emission (Fig. 10), whose size and radiation are very different. Their effective radii, and luminosities, , are in Table 3. Approximating their geometry with a flat disk seen under the inclination angle , their radius and the luminosity (see Appendix B). Location of the dust in the ejecta is sketched in Fig. 11.
4.2.3 Formation of the dust in the equatorial disk
Recently, Derdzinski et al. (2017) proposed that dust formation occurs in the cool, dense shell behind the powerful radiative shocks within nova outflows. Assuming that the TNR is first accompanied by a slow ejection of mass focused in the equatorial plane and then followed by a second ejection with a higher velocity and more spherical geometry, the subsequent collision between both the ejecta produces strong shocks in the equatorial plane. As the shocked gas cools by a factor of 103 and increases its density with a similar factor, it represents an ideal environment for dust forming.
Plausibility of this interpretation for V339 Del is supported by the following observations.
-
1.
The primary outflow with the expansion velocity of 1600 – 700 km s-1 was followed by the secondary outflow in the form of a wind accelerating to 2700 km s-1 just after the fireball phase (day 6, see Figs. 7 and 8 of Skopal et al., 2014).
- 2.
- 3.
-
4.
According to Hachisu & Kato (2018), the slow decline of the optical flux , observed for some novae during the early stage of their evolution, can be caused by the shock interaction that decelerates the ejecta resulting in a slower decrease of its density, and thus the flux with the time . After the shock breakout, the slope changes to . Such slopes of the nova decay are similar to those observed for V339 Del (see Fig. 9), which is consistent with the presence of a shock deceleration mechanism.
The hotter, smaller and less luminous dust component may represent just the innermost part of the dusty equatorial ring (light-gray elements in Fig. 11, bottom). Progressively harder radiation of the WD heats up the dust and destroys it gradually toward to its outer rim. The temperature of the hotter dust, 1700 K, which is just above the upper limit for the condensation of graphitic carbon (1690 K) – the main component of the dust in V339 Del (see Evans et al., 2017), is consistent with its destruction. As a result, the dust emission will gradually weaken.
Finally, we note that the cooler, equatorially concentrated outflow could be formed during outburst by compression of the mass-outflow (wind) toward the equatorial plane due to rotation of the WD as was suggested for Z And-type outbursts of symbiotic binaries by Cariková & Skopal (2012)777Although, binary components orbiting within the nova envelope can also focus the mass toward the orbital plane (Livio et al., 1990; Lloyd et al., 1997).. This mechanism (originally introduced by Bjorkman & Cassinelli, 1993) naturally gives rise to the biconical ionization structure of the ejecta, whose opening is related to the mass-loss rate from the WD as . Thus the decrease of (see Sect. 4.1.1) will cause opening of the ionized zone and narrowing the dense dusty disk at the equator, whose innermost part will move away from the central WD (see Fig. 1 of Cariková & Skopal, 2012).
4.3. Long-lasting super-Eddington luminosity
4.3.1 The case of V339 Delphini
Figure 12 shows evolution of along the nova age, from the first observations around day 1 to the last model SED on day 636. During the early evolution, from day 1 to day 2, the real increase of from to was indicated by the increase of fluxes from the WD pseudophotosphere, whose maximum SED was located in the optical (see Fig. 1 of Skopal et al., 2014). After following decrease to during day 3, the persisted at a high level of until day 100, when the WD radiation was determined by the X-ray/near-IR model SED (Fig. 4). Such the high luminosity was probably prolonged to day 150, when Swift-XRT still detected strong super-soft X-ray emission at the same level as on day 100. A significant decrease of as well as was first determined on day 248 (Appendix A) as indicated by weakening of the X-ray source and the decrease of the UV fluxes. Following measurements on day 428 and 636 confirmed gradual fading of to (Sect. 3.3).
Using the indirect method in deriving , the principal assumption is that the nebula is optically thick for the Lyman continuum photons of the ionizing source. Before the SSS phase, observations support this assumption (see Sect. 3.3). Therefore, we estimated also for EM determined by Skopal et al. (2014) for day 7.8 to 37.8 (see their Table 3). We adopted K, at which the ionizing source produces maximum of photons capable of ionizing hydrogen for a given luminosity.
At the end of the fireball stage (day 6), values of from the WD pseudophotosphere were lower by the fraction generating the nebular radiation that started to be visible at this time (see Figs. 1 and 2 of Skopal et al., 2014). Because the following values of from the EM could be overestimated due to collisional ionization, but also underestimated due to measuring only the optically thin part of the nebula, it is not possible to determine errors for indirectly estimated values of .
Nevertheless, given by the stellar component of radiation in the day 100 model SED confirms previous values from EM, and thus the long-lasting super-Eddington luminosity for, at least, the first 100 days of the nova life (Fig. 12).
4.3.2 When the super-Eddington luminosity can be indicated?
In most cases the super-Eddington luminosity is indicated at the optical maximum, when the absolute magnitude of numerous (fast) novae, (e.g. Livio, 1992; Della Valle & Livio, 1995; Shafter et al., 2009; Shaviv & Dotan, 2012). This is because during this very early stage of evolution, most novae reprocess significant fraction of their radiation into the optical, which allows a direct estimate of their luminosity. Usually, a simple blackbody fit to the multicolor photometry provides a rough estimate of the nova luminosity (e.g., Gehrz et al., 2015, for V339 Del).
Later, when the maximum SED is shifting to shorter wavelengths and the optical is dominated by the nebular emission, it is not possible to determine directly the nova luminosity by fitting only the observed UV–optical continuum (e.g., the day 35 model SED here). This possibility arises again during the SSS phase, when the super-soft X-ray and far-UV fluxes define the WD spectrum from both the short- and long-wavelength side (here, the day 100 model SED). This can reveal a startling result that the super-Eddington state of some novae lasts for a long time after their eruption (Sect. 4.3.1). To prove this case, at least for the optically bright novae, measurements of X-ray and far-UV fluxes during the SSS phase are required.
4.3.3 Current view on super-Eddington luminosity
Our findings of the super-Eddington luminosity for V339 Del is not consistent with theoretical modeling that the super-Eddington phase can persist only for a short time at the beginning of the nova eruption (e.g., Prialnik & Kovetz, 1995; Yaron et al., 2005; Starrfield et al., 2008). On the other hand, the long-term super-Eddington luminosity was observationally documented for more novae, for example, nova FH Ser (Friedjung, 1987), LMC 1988 1 (Schwarz et al., 1998), LMC 1991 (Schwarz et al., 2001), RS Oph (Skopal, 2015b, c) and nova SMCN 2016-10a (Aydi et al., 2018), which thus support our finding for V339 Del. Also, the summary of Shafter et al. (2009) that there are 12, 26 and 5 novae in our Galaxy, M31 and LMC, respectively, which have reached absolute visual magnitude , suggests luminosities highly above the Eddington limit.
The super-Eddington state of novae was investigated by Shaviv (1998), who suggested a decrease of the effective opacity of the inhomogeneous atmosphere of novae, which increases the Eddington luminosity well above its standard value, calculated for the Thomson-scattering opacity (see also Shaviv & Dotan, 2010, 2012).
Based on remarkable correlation between the -ray and optical LCs of the luminous () nova ASASSN-16ma, Li et al. (2017) suggested that the majority of the optical light comes from reprocessed emission from shocks rather than the WD. The -ray–optical brightness correlation was indicated at/after the optical maximum (see their Fig. 1), when the dense slow ejecta ahead of the shocks reprocesses their radiation into the optical, giving rise to the observed optical luminosity of . In this way, the authors replace the standard model, in which most of ultraviolet and/or optical emission in novae is the result of outwards diffusion of the radiation from the WD (e.g., Yaron et al., 2005), and state that the shock-driven emission provides an explanation for super-Eddington luminosity observed for many novae. However, at late stages, particularly during the SSS phase, the super-Eddington luminosity is indicated by direct measuring the photospheric radiation transferred through the atmosphere of the WD, which thus leaves the long-standing mystery of why many novae exceed the Eddington limit for a long time still open.
4.3.4 On the long-lasting super-Eddington luminosity
A possibility how to keep a nova at the super-Eddington state for a long time is to fuel the burning WD also after the eruption. Here, by analogy with the Z And-type outbursts, a disk-like reservoir of mass can be created at the equatorial plane during the outburst (see the last paragraph of Sect. 4.2.3). Due to the presence of a strong central source of radiation (the burning WD), the inner parts of the disk can be accreted again onto the WD via the radiation-induced warping, which prolongs the period with a high luminosity, until depletion of the inner disk. This event can be accompanied by formation of bipolarly collimated high-velocity outflow (see Skopal et al., 2018, and references therein). The long-term super-Eddington luminosity of the recurrent nova RS Oph (Skopal, 2015b, c) and the bipolar jet-like collimated outflow observed in its spectrum during day 10 to 30 after the 2006 outburst maximum (see Skopal et al., 2008) suggest that this mechanism could work also during outbursts of classical novae. However, multiwavelength observations along evolution of other novae and their theoretical modeling are needed to justify applicability of this accretion mechanism for classical novae.
4.4. Measuring from Rayleigh scattering
In some recent papers on novae the authors used the Voigt function to model the interstellar Ly- absorption (e.g. Mason et al., 2018). Instead, we modeled the attenuation around the Ly- line by Rayleigh scattering on atomic hydrogen. We justify our approach as follows.
Rayleigh scattering by neutral atoms of hydrogen represents the process, where an incident photon raises an electron from the ground state to the intermediate state, followed by the direct return of the electron to the original state, re-emitting a photon of the same energy (e.g., Nussbaumer et al., 1989). The strength of Rayleigh scattering is determined by the value of and its profile is given solely by its cross-section (Sect. 3.1.1). As the cross-section has a ‘singularity’ near the wavelength of a Lyman line (e.g., Fig 2 of Nussbaumer et al., 1989), the rest flux around the reference wavelength is close to zero. For example, cm-2 creates an absorption core with the zero rest flux888Contribution of the scattered photons to the line-of-sight, which can be of a few percents (Schmid, 1995), is not detectable on our spectra., the FWHM of Å and wings expanding approximately to Å around the Ly- line (see Fig. 7). Therefore, in spite of small kinematic motions of atoms in the ISM, Rayleigh scattering can create the very broad hollow with expanding wings around the Ly- line, depending only on the quantity of .
5. Summary
In this paper we continued the work of Skopal et al. (2014) by multiwavelength modeling the SED of V339 Del from the iron-curtain phase on day 35 to the nebular phase on day 636 (Sect. 3, Figs. 3, 4, 5 and 10). Pivotal models were made for day 35 and 100, when the large and most important part of the nova spectrum is covered by simultaneous observations (Table 1). In this way we determined physical parameters of the stellar, nebular and dust component of radiation (Table 3) and obtained new information on the nova evolution. The main results can be summarized as follows.
- 1.
- 2.
-
3.
The day 35 model SED indicates an oblate shape of the WD pseudophotosphere, which hotter part with a smaller radius is located around the poles, while the cooler regions with larger radii are stretched towards the WD equator (Sect. 4.2.1). The indicated dust can be formed within a slow equatorially concentrated outflow as a result of its interaction with the fast nova wind (Sect. 4.2.3, Fig. 11). The dust emission reached its maximum around day 59 (Figs. 9 and 10).
On day 100, the co-existence of both the strong dust emission and the luminous high temperature WD photosphere confirms the disk-like shaping of the dust even during the SSS phase (Sect. 4.2.2). The indicated hotter dust is located at the inner part of the dusty ring, where the hard WD radiation destroys the dust gradually toward to its outer rim. In this way the disk can preserve the dust within the ejecta for a long time (Sect. 4.2.3, Fig. 11).
Appendix A Temperature of the WD pseudophotosphere on day 248
To determine the WD temperature on day 248 we assume that both the far-UV fluxes and the super-soft X-ray photons are produced by the long- and short-wavelength part of the WD radiation. The former is given by the model SED (see Fig. 13) and the latter by the super-soft X-ray source as suggested by the low hardness ratio F(0.45–1 keV)/F(0.3–0.45 keV)0.1 on day 248 (see Fig. 1 of Shore et al., 2016) and no X-ray flux detection below 22 Å during the maximum of the SSS phase (Nelson et al., 2013; Ness et al., 2013). Under this assumption we can write the ratio
| (A1) |
where and are photon rates (s-1) emitted by the WD photosphere within the Swift-XRT range (0.3–10 keV) attenuated with , while c and c are photon rates directly measured by Swift-XRT on day 100 and 248, respectively. According to Eq. (11) of Skopal (2001), the flux of quanta can be expressed as
| (A2) |
where the function
| (A3) |
represents the flux of photons emitted by 1 cm2 area of the WD photosphere within the Swift-XRT range, absorbed by hydrogen column density . Using Eqs. (A2) and (A1), the luminosity of the WD on day 248 can be written as
| (A4) |
which for and the scaling factor = (e.g., Eqs. (5) and (6) of Skopal, 2005) provides equation,
| (A5) |
where (cm-2 s-1). For the parameter given by Eq. (A2), derived from observations and the flux of the WD, , the solution of Eq. (A5) provides the WD temperature and Eq. (A4) its luminosity on day 248.
For the measured photon rates c = 355 and c = 0.0250.005 s-1 (see Fig. 1 of Shore et al., 2016), i.e., , s-1 (for , and in Table 3), i.e., cm-2 s-1 and the WD flux at, e.g., Å, , Eq. (A5) and Eq. (A4) yield kK and , respectively. Figure 13 demonstrates principle of this approach in a graphical form.
Appendix B Dust emission from a flat disk
According to Sect. 4.2.2 the geometry of emitting dust can be approximated by a flat disk encompassing the central heating source. If the disk is optically thick and radiates locally like a blackbody, the observed flux distribution of the disk, , at a distance is given by contributions from blackbody annuli, 2, integrated through the entire disk, i.e.
| (B1) |
where is the angle between the line of sight and the normal to the disk plane, its radius and the radial temperature structure of the disk. According to the model SED, can be assumed to be constant throughout the dusty disk. Thus, assuming and the inner radius , the observed bolometric flux of the disk can be approximated by
| (B2) |
which gives the disk radius,
| (B3) |
and the disk luminosity,
| (B4) |
References
- Ackermann et al. (2014) Ackermann, M., Ajello, M., Albert, A., et al. 2014, Science, 345, 554
- Ahnen et al. (2015) Ahnen, M. L., Ansoldi, S., Antonelli, L. A., et al. 2015, A&A, 582, A67
- Anderson et al. (2013) Anderson, G., Fender, R., Chomiuk, L., & Staley, T. 2013, ATel No. 5428
- Aydi et al. (2018) Aydi, E., Page, K. L., Kuin, N. P. M., et al. 2018, MNRAS, 474, 2679
- Bessell (1979) Bessell, M.S., 1979. PASP 91, 589
- Beardmore et al. (2013) Beardmore, A. P., Osborne, J. P., & Page K. L. 2013, ATel No. 5573
- Bjorkman & Cassinelli (1993) Bjorkman, J. E., Cassinelli, J.P. 1993, ApJ, 409, 429
- Bode & Evans (2008) Bode, M. F., & Evans, A., 2008, Classical Novae, second edition, (Cambridge: Cambridge University Press)
- Brown & Mathews (1970) Brown, R. L., & Mathews, W. G. 1970, ApJ, 160, 939
- Burlak et al. (2015) Burlak, M. A., Esipov, V. F., Komissarova, G. V., et al. 2015, Baltic Astron., 24, 109
- Cardelli et al. (1989) Cardelli, J. A., Clayton, G. C., & Mathis, J. S. 1989, ApJ, 345, 245
- Cariková & Skopal (2012) Cariková, Z., & Skopal, A. 2012, A&A, 548, A21
- Cheung et al. (2016) Cheung, C. C., Jean, P., Shore, S. N. et al. 2016, ApJ, 826, 142
- Chochol et al. (2014) Chochol, D., Shugarov, S., Pribulla, T., & Volkov, I. 2014, Contrib. Astron. Obs. Skalnaté Pleso, 43, 330
- Chochol et al. (2017) Chochol, D., Shugarov, S., Katysheva, N., & Volkov, I. 2017, Proceedings of Science,
- Chomiuk et al. (2013) Chomiuk, L., Linford, J., Finzell, T., et al. 2013, ATel No. 5382
- Chomiuk et al. (2014) Chomiuk, L., Linford, J. D., Yang, J., et al. 2014, Nature, 514, 339
- Cruddace et al. (1974) Cruddace, R., Paresce, F., Bowyer, S., Lampton, M.: 1974, ApJ, 187, 497
- Deacon et al. (2014) Deacon N. R., Hoard, D. W., Magnier, E. A., et al. 2014, A&A 563, A129
- Della Valle & Livio (1995) Della Valle, M, & Livio, M. 1995, ApJ, 452, 704
- Denisenko et al. (2013) Denisenko, D., et al., 2013, IAUC, 9258, 2
- Derdzinski et al. (2017) Derdzinski, A. M., Metzge, B. D., & Lazzati, D. 2017, MNRAS, 469, 1314
- Diplas & Savage (1994) Diplas, A., & Savage, B. D. 1994, ApJ, 427, 274
- Evans et al. (2017) Evans, A., Banerjee, D. P. K., Gehrz, R. D., et al. 2017, MNRAS, 466, 4221
- Friedjung (1987) Friedjung, M. 1987, A&A, 179, 164
- Fruchter et al. (2011) Fruchter, A., Krolik, J. H., & Rhoads, J. E. 2001, ApJ, 563, 597
- Gallagher & Starrfield (1978) . Gallagher, J. S., & Starrfield, S. 1978, ARA&A, 16, 171).
- Gatuzz et al. (2018) Gatuzz, E., Ness, J.-U., Gorczyca, T. W., Hasoglu, M. F., Kallman, T. R. & García, J. A. 2018, MNRAS, 479, 2457
- Gehrz et al. (2015) Gehrz, R. D., Evans, A., Helton, L. A. et al., 2015, ApJ, 812, 132
- Gehrz et al. (2018) Gehrz, R. D., Evans, A., Woodward C. E., et al., 2018, ApJ, 858, 78
- Hachisu & Kato (2018) Hachisu, I. & Kato, M. 2018, ApJL, 237, 4
- Henden & Kaitchuck (1982) Henden, A. A., & Kaitchuck, R. H. 1982, Astronomical Photometry, (New York: Van Nostrand Reinhold Company), 50
- Kaler & Jacoby (1989) Kaler, J. B., & Jacoby, G. H. 1989, ApJ, 345, 871
- Kato & Hachisu (1994) Kato, M., & Hachisu, I. 1994, ApJ, 437, 802
- Kawakita et al. (2019) Kawakita, H., Shinnaka, Y., Arai, A., Arasaki, T. & Ikeda, Y. 2019, ApJ, 872, 120
- Lanz et al. (2005) Lanz, T., Telis, G. A., Audard, M., Paerels, F., Rasmussen, A. P., & Hubeny, I. 2005, ApJ, 619, 517
- Li et al. (2017) Li, K.-L., Metzger, B. D., Chomiuk, L., et al. 2017, Nature Astronomy, 1, 697
- Livio (1992) Livio, M. 1992, ApJ, 393, 516
- Livio et al. (1990) Livio, M., Shankar, A., Burkert, A., & Truran, J. W. 1990, ApJ, 356, 250
- Lloyd et al. (1997) Lloyd, H. M., O’Brien, T. J., & Bode, M. F. 1997, MNRAS, 284, 137
- Mason et al. (2018) Mason, E., Shore, S. N., De Gennaro Aquino, I., et al. 2018, ApJ, 853, 27
- Munari & Henden (2013) Munari, U, & Henden, A. 2013, IBVS, 6087
- Munari et al. (2013a) Munari, U., Valisa, P., Milani, A., & Cetrulo, G. 2013a, ATel. No. 5297
- Munari et al. (2013b) Munari, U., Henden, A., Dallaporta, S., & Cherini, G. 2013b, IBVS No. 6080
- Munari et al. (2015) Munari, U., Maitan, A., Moretti, S., & Tomaselli, S. 2015, New Astron., 40, 28
- Mürset & Nussbaumer (1994) Mürset, U., & Nussbaumer, H. 1994, A&A, 282, 586
- Nakano (2013) Nakano, S. 2013, CBET, 3628, 1
- Nelson et al. (2013) Nelson, T., Mukai, K., Chomiuk, L., & Sokoloski, J. 2013, ATel No. 5593
- Ness et al. (2013) Ness, J. U., Schwarz, G. J., Page, K. L., et al. 2013, ATel No. 5626
- Nussbaumer & Vogel (1987) Nussbaumer, H., & Vogel, M. 1987, A&A, 182, 51
- Nussbaumer et al. (1989) Nussbaumer, H., Schmid, H. M., Vogel, M. 1989, A&A, 211, L27
- Osborne et al. (2013) Osborne, J. P., Page, K., Beardmore, A., et al. 2013, ATel No. 5505
- Özdönmez et al. (2016) Özdönmez, A., Güver, T., Cabrera-Lavers, A., & Ak, T. 2016, MNRAS, 461, 1177
- Özdönmez et al. (2018) Özdönmez, A., Ege, E., Güver, T., & Ak, T. 2018, MNRAS, 476, 4162
- Page & Beardmore (2013) Page, K. L., & Beardmore A. P. 2013 ATel No. 5429
- Page et al. (2013) Page, K. L., Osborne, J. P., Kuin, at al., 2013, ATel No. 5470
- Prialnik & Kovetz (1995) Prialnik, D., & Kovetz, A. 1995, ApJ, 445, 789
- Schaefer (2018) Schaefer, B. E. 2018, MNRAS, 481, 3033
- Schaefer et al. (2014) Schaefer, G. H., ten Brummelaar, T., Gies, R. D., et al. 2014, Nature, 515, 234
- Schlegel et al. (1998) Schlegel, D. J., Finkbeiner, D. P., & Davis, M. 1998, ApJ, 500, 525
- Schmid (1995) Schmid, H. M. 1995, MNRAS, 275, 227
- Schwarz et al. (1998) Schwarz, G. J., Hauschildt, P., Starrfield, S., et al. 1998, MNRAS, 300, 931
- Schwarz et al. (2001) Schwarz, G. J., Shore, S. N., Starrfield, S., et al. 2001, MNRAS, 320, 103
- Shafter et al. (2009) Shafter, A. W., Rau, A., Quimby, R. M. et al. 2009, ApJ, 690, 1148
- Shaviv (1998) Shaviv, N. J. 1998, ApJ, 494, L193
- Shaviv & Dotan (2010) Shaviv, N. J., & Dotan, C. 2010, Mem. S.A.It., 81, 350
- Shaviv & Dotan (2012) Shaviv, N. J., & Dotan, C. 2012, Mem. S.A.It., 83, 792
- Shore et al. (2013a) Shore, S. N., Schwarz, G. J., Alton, K., et al. 2013a, ATel. No. 5409
- Shore et al. (2013b) Shore, S. N., Schwarz, G. J., Starrfield, S., et al. 2013b, ATel. No. 5624
- Shore et al. (2016) Shore, S. N., Mason, E., Schwarz, G. J., et al., 2016, A&A, 590, A123
- Shore et al. (2018) Shore, S. N., Kuin, N. P., Mason, E., & De Gennaro Aquino, I. 2018, A&A, 619, A104
- Skopal (2001) Skopal, A. 2001, A&A, 366, 157
- Skopal (2005) Skopal, A. 2005, A&A, 440, 995
- Skopal (2007) Skopal, A. 2007, New Astron., 12, 597
- Skopal (2014) Skopal, A. 2014, in: Stella Novae: Past and Future Decades. ASP Conference Series, Vol. 490, P. A. Woudt and V. A. R. M. Ribeiro eds. San Francisco, p. 211
- Skopal (2015a) Skopal, A. 2015a, New Astron., 36, 116
- Skopal (2015b) Skopal, A. 2015b, New Astron., 36, 128
- Skopal (2015c) Skopal, A. 2015c, New Astron., 34, 123
- Skopal et al. (2006) Skopal, A., Vittone, A. A., Errico, L. et al. 2006, A&A, 453, 279
- Skopal et al. (2008) Skopal, A., Pribulla, T., Buil, Ch., Vittone, A. A., Errico, L. 2008, in: RS Ophiuchi (2006) and the Recurent Nova Phenomenon. ASP Conference Series, Vol. 401, A. Evans, M. F. Bode, T. J. O’Brien and M. J. Darnley eds. San Francisco, p. 227
- Skopal et al. (2014) Skopal, A., Drechsel, D., Tarasova, T., et al. 2014, A&A, 569, A112
- Skopal et al. (2017) Skopal, A., Shugarov, S. Yu., Sekeráš, M., et al. 2017, A&A, 604, A48
- Skopal et al. (2018) Skopal, A., Tarasova, T. N., Wolf, M., Dubovský, P. A., & Kudzej, I. 2018, ApJ, 858:120
- Starrfield et al. (2008) Starrfield, S., Iliadis, Ch., Hix, W. R. 2008, in M. F. Bode, & A. Evans, eds., Classical Novae. CUP, Cambridge, p. 77
- Starrfield et al. (2016) Starrfield, S., Iliadis, Ch., & Hix, W. R. 2016, PASP, 128, 051001
- Taranova et al. (2014) Taranova, O. G., Tatarnikov, A. M., Shenavrin, V. I., & Tatarnikova, A. A. 2014, Astronomy Letters, 40, 120
- Tarasova & Skopal (2016) Tarasova, T. N. & Skopal, A. 2016, Astronomy Letters, 42, 10
- Wilms, Allen & McCray (2000) Wilms, J., Allen, A., & McCray, R. 2000, ApJ, 542, 914
- Yaron et al. (2005) Yaron, O., Prialnik, D., Shara, M. M., & Kovetz, A. 2005, ApJ, 623, 398