Optics robustness of the ATLAS Tile Calorimeter
Abstract
TileCal, the central hadronic calorimeter of the ATLAS detector is composed of plastic scintillators interleaved by steel plates, and wavelength shifting optical fibres. The optical properties of these components are known to suffer from natural ageing and degrade due to exposure to radiation. The calorimeter was designed for 10 years of LHC operating at the design luminosity of cm-2s-1. Irradiation tests of scintillators and fibres have shown that their light yield decrease by about 10% for the maximum dose expected after 10 years of LHC operation. The robustness of the TileCal optics components is evaluated using the calibration systems of the calorimeter: Cs-137 gamma source, laser light, and integrated photomultiplier signals of particles from proton-proton collisions. It is observed that the loss of light yield increases with exposure to radiation as expected. The decrease in the light yield during the years 2015-2017 corresponding to the LHC Run 2 will be reported. The current LHC operation plan foresees a second high luminosity LHC (HL-LHC) phase extending the experiment lifetime for 10 years more. The results obtained in Run 2 indicate that following the light yield response of TileCal is an essential step for predicting the calorimeter performance in future runs. Preliminary studies attempt to extrapolate these measurements to the HL-LHC running conditions.
1 Introduction
The Tile Calorimeter of the ATLAS experiment is composed of 11 radial layers of steel absorbers interleaved with plastic scintillator tiles as active material (Fig. 1) [1, 2]. The light is collected by wavelength shifting (WLS) fibres from two edges of the tiles and guided to Hamamatsu R7877 photomultiplier tubes (PMTs). The tiles are 3 mm thick and have a trapezoidal shape of various sizes (10 to 19 cm height by 20 to 40 cm wide) and are polystyrene (PS)-based (PSM-115 or BASF165H) doped with 1.5% PTP and 0.05% POPOP. The WLS fibres (Kuraray Y11 MSJ) have 1 mm diameter and are also PS-based, and have a length of 80 cm to 2 m.
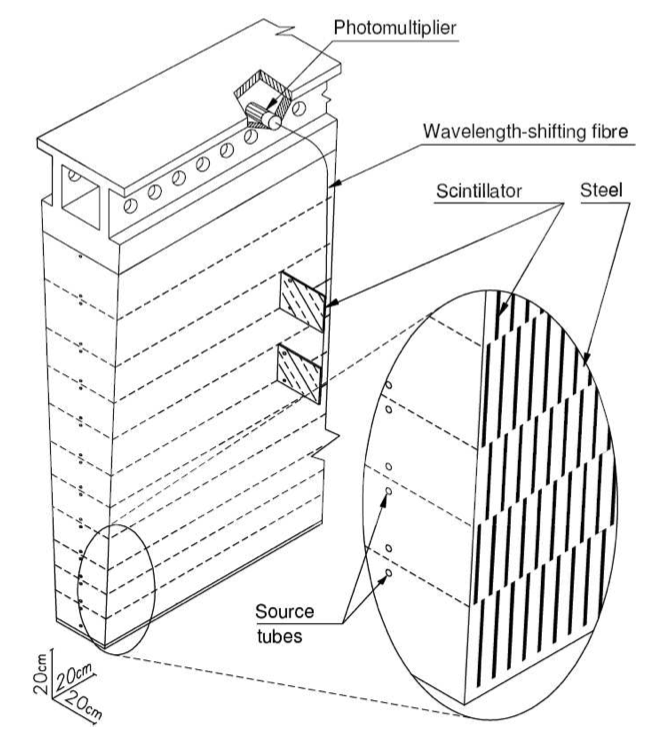
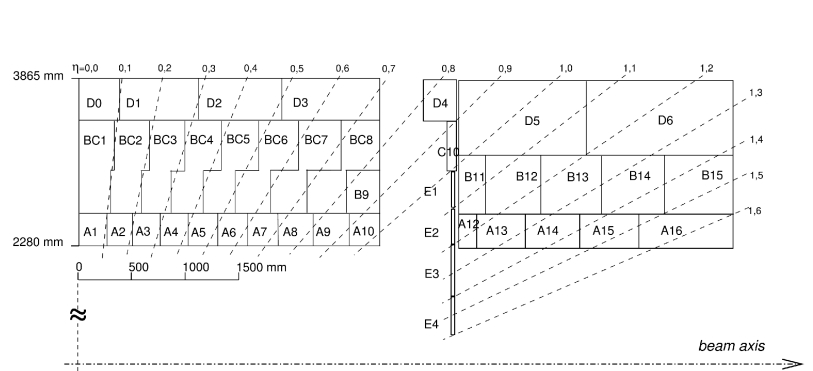
Each PMT reads out a bundle of fibres connected to the tiles composing a cell. TileCal is radially segmented into 3 cell layers: A, BC and D, ordered from the innermost layer to the outermost one (Fig. 1). Along the azimuthal direction, 64 modules split equally the space. The cell size across and is ( in the D layer). Special scintillators called the E-cells, 6 mm thick, are placed in the gap/crack region of the detector. These are made of a different material than the tiles of the barrels: BC-408 (polyvinyl toluene-based) for E1 and E2 and UPS-923A (PS-based) for E3 and E4.
Studying the optics robustness of TileCal is of crucial importance in view of the HL-LHC run since, in particular, scintillators and WLS fibres cannot be replaced, the only exception being the E-cells.
2 Past studies of optics robustness
The robustness of all optical components was studied in detail at the time of the detector design. The degradation in light yield of scintillators and WLS fibres due to natural ageing was determined to be below 1%/year [4, 5] using artificial accelerated ageing techniques.
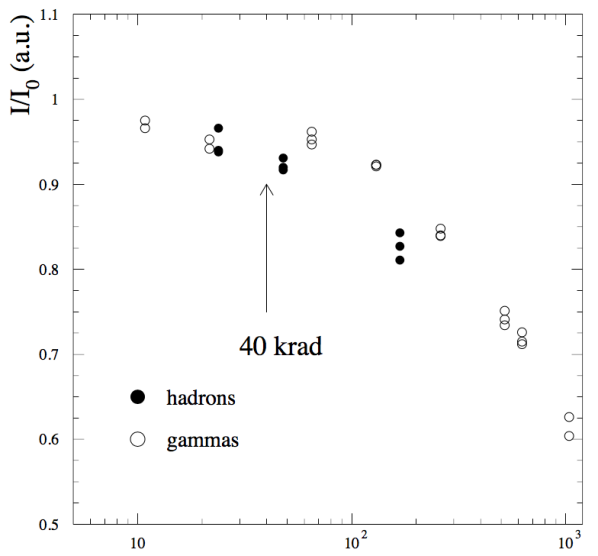
Scintillator tiles were irradiated with a Cobalt-60 gamma source and with secondary hadrons from the interactions of a 70 MeV proton beam with an Al target [4]. The dose rates of the irradiations were 60 mGy/s for gammas and 20 to 30 mGy/s for hadrons. The results (Fig. 2) showed a decrease in the scintillation light yield of the tiles caused by the ionising radiation, and indicated a 10% loss for 400 Gy, the expected dose after 10 years of LHC operation running at nominal conditions for cells placed at the innermost TileCal layer. Irradiations of scintillators coupled to WLS fibres were also done and the measured light yield reduction after 3 kGy was 19% [2]. This value is of the same order of the one resulting from the irradiation of the scintillator alone shown on Fig. 2, indicating that the scintillators are the most critical elements in the radiation hardness of the detector.
Exploring the TileCal calibration data is an opportunity to study the natural ageing and radiation damage to scintillators and WLS fibres in-situ conditions that, for instance, that in terms of dose rate levels are very difficult to reproduce in laboratory.
3 Dose simulation
The total ionisation doses (TID) in the Tile Calorimeter were determined with GEANT4 simulation of proton-proton collisions at a centre-of-mass energy of TeV (Fig. 3). The dose is shown for different radius intervals, the larger TIDs correspond to the innermost radial layers, closer to the LHC interaction point, as expected. The dose is larger for the scintillator material than for steel due to the additional energy deposited by protons from the hydrogen atoms of the polystyrene scattered by neutrons.
The larger doses, up to 20 Gy/fb-1, occur at cm, where the E-cells are placed ( cm), and in the smaller radial interval of the barrels ( cm). The highly exposed region along cm corresponds to the A12, A13 and A14 cells of the extended barrel.
4 TileCal calibration systems
TileCal is equipped with dedicated calibration systems to monitor and calibrate each step of the readout chain [2]. A Cesium-137 source crosses the tiles, scanning the entire detector and allowing to determine the response of the entire readout chain. A laser system is used to perform the calibration and to monitor the PMTs and readout electronics and a charge injection system calibrates the digital readout.
Besides the electronics that reads the fast signals from collisions, TileCal has an additional readout path with a RC integrator circuit. This path is used to read the signals generated by the Cs-137 scans. Signals from collisions are also integrated 20 to 25 times per run lumiblock and used to monitor the detector response. A lumiblock is a time interval for which the run had an approximate constant instantaneous luminosity, typically a minute. Events from minimum bias interactions, that dominate the pp collisions, lead to an average energy deposited in the calorimeter that is proportional to the instantaneous luminosity and so do their average integrated currents. Factorising this dependence out, for instance by normalising to the average integrated currents of a known stable cell, we can use collision data to monitor the detector response.
5 PMT robustness
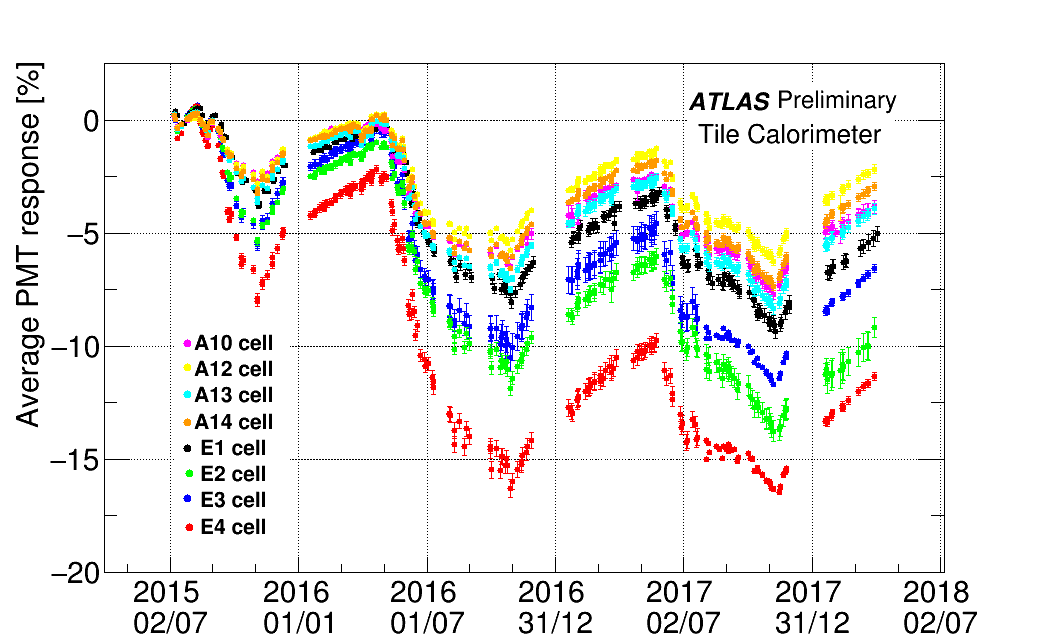
The time evolution of the response of PMTs reading the cells most exposed to radiation, A10 to A14 and E-cells, was studied using data from the laser calibration system for the years 2015 to 2018 (Fig. 4). The response evolution exhibits a couple of patterns. First, a down drift of the PMT response is observed during pp collision periods for all the cell types analysed. Secondly, this response degradation is partially recovered during LHC shutdowns. By fitting the data with a double exponential model featuring these two effects one concludes that the PMT response degrades at an approximately constant rate of 0.08%/C on integrated charge. Taking for instance the A13 cell, for which the expected integrated charge at the end of the HL-LHC is extreme (500 C) one expects at most around 40% cumulated degradation of the PMT response.
6 Radiation hardness of scintillators and WLS fibres
6.1 Monitoring with laser and Minimum bias integrated currents
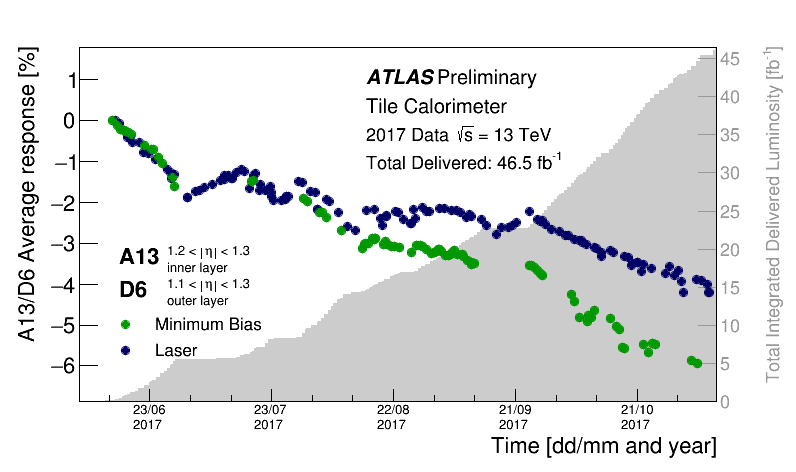
The response of the entire optical chain of TileCal (scintillators, WLS fibres and PMTs) is assessed by monitoring the integrated currents from minimum bias events normalised to the D6 current to factorise out their linear dependence on the instantaneous luminosity. The reference cell D6 is found to be stable within 1% during the time interval of the dataset analysed. As discussed, the PMT response exhibits down-drifts matching the period of collisions and partial recovery during machine shutdowns. The response of scintillators, WLS fibres and PMTs altogether, follows the same trend but shows an increasing degradation with respect to the PMTs, Figure 5. At the end of 2017, the difference between the response to minimum bias events and to laser pulses is -3% for the A13 cell. This is an effective way to monitor the response of scintillators and WLS fibres and to measure their light yield evolution.
6.2 Relative light yield of scintillators and fibres
The relative light yield of the scintillators and WLS fibres is computed from the difference in response to minimum bias events and laser pulses and accumulated along the years assuming no light yield evolution during LHC shutdowns. The is the measured light yield at the beginning of the period under analysis. Both measurements made with the laser system and with the integrator have a systematic uncertainty up to 1.2%. These are propagated into the relative light yield uncertainty assuming no correlation between the two systematic sources, and summed quadratically.
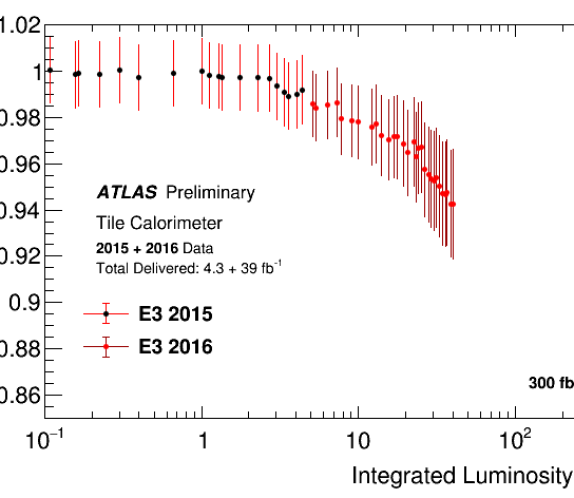
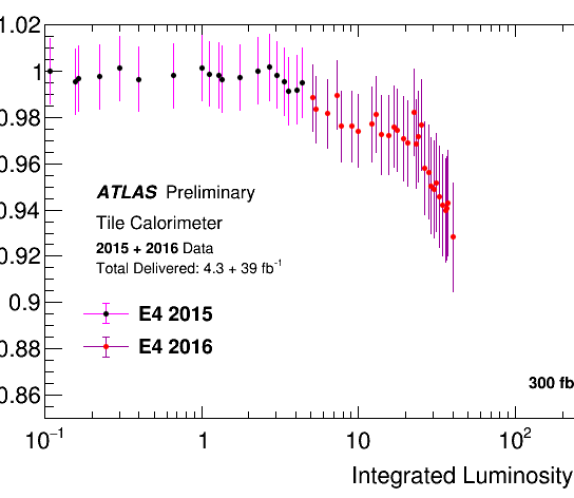
The of the E3 and E4 scintillators is plotted against the integrated luminosity for the years 2015 to 2016 (Fig. 6) and 8% light loss is observed at the end of this period, where the total integrated luminosity was 43.3 fb-1. These scintillators are made of a different material than the tiles composing the barrels and have also twice larger thickness. As stated, these aspects must be taken into account when establishing a direct comparison with the barrel cells. The E3 and E4 are the TileCal cells that face the most extreme irradiation conditions. They will be replaced during the next LHC long shutdown and are expected to be replaced at every long shutdown.
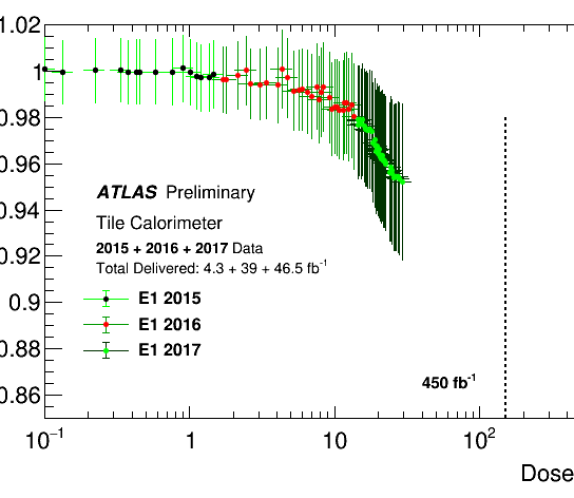
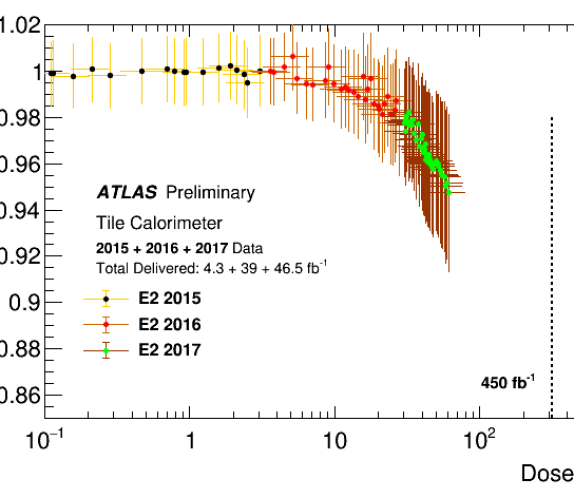
The is shown as a function of the simulated dose in Fig. 7 and 8. The dose simulation varies strongly along the detector and, given the large volume of the cells, the dose changes substantially within a cell. For the nominal dose the average value is taken and the RMS of the different dose values within the cell volume are represented as horizontal bars. No systematic uncertainty is assigned to the dose estimate. The loss of light yield increases with exposure to radiation, and the data points exhibit a well defined trend.
Accumulating information from the years 2015 to 2017, one sees that the E1 and E2 scintillators and fibres loose 5% of their light yield at the end of the period. These components of the detector are not expected to be replaced on the next LHC long shutdown and these data is useful to predict what will be the light output at the end of the Run 3, when the LHC is expected to have delivered 450 fb-1. Based on this, a decision on the replacement of their PMTs can be taken, aiming at minimising the effect of the light yield loss. However, this extrapolation is limited by the large size of the error bars and this analysis will clearly benefit from the inclusion of the 2018 data, currently being taken.
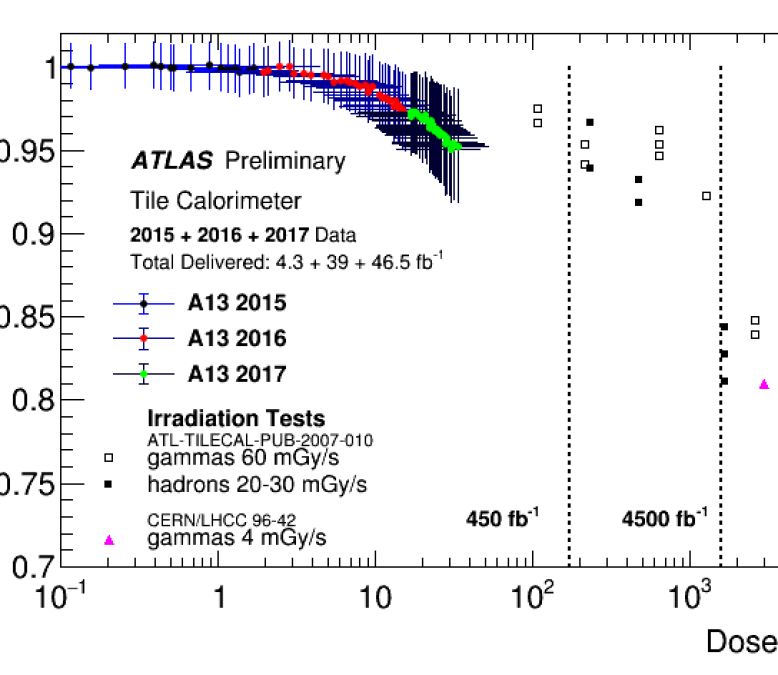
Results for the A13 are compared with the results from irradiations made at laboratory of same material scintillators (square markers), and scintillators coupled to WLS fibres (triangle). The conditions of the laboratory irradiations are very far from the ones experienced by the scintillators mounted in the detector. Typical dose rates for cells in the A layer of TileCal are 1 to 10 mGy/h while they are (1 to 10 mGy/s) for the irradiations in the lab. Despite this, the light loss trend is similar. The in-situ data does not yet attain the dose region populated by the lab data, however some conclusions can be drawn already. Interpolating the laboratory data with the 1700 Gy estimated by up-to-date dose simulations for the A13 cell at the HL-LHC, one gets a lower limit of about 20% on the light degradation in this cell. Moreover, TileCal data indicate a faster light loss rate than laboratory tests.
6.3 Dose rate effects
Dose rate effects on the radiation hardness of scintillator materials can be an important feature to consider given that CMS reports evidence for larger light output degradation with lower dose rate values [8, 9]. It is however worth to note that the configuration of the tile-fibre coupling in CMS is very different from TileCal.
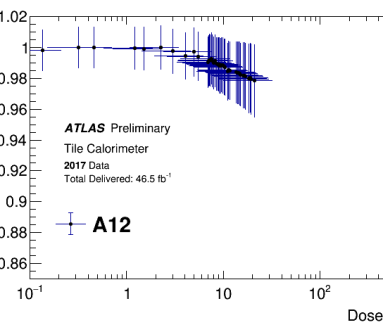
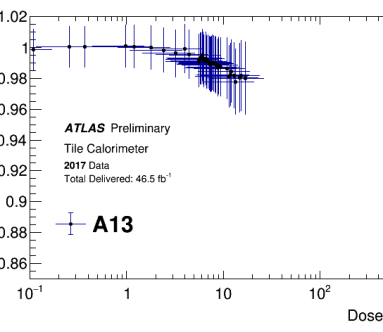
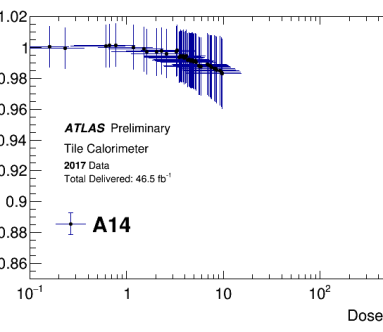
Figure 9 shows a comparison of the relative light yield as a function of the dose for A12, A13 and A14 using data from 2017 only. This set of cells was chosen for having approximately same size scintillator tiles, read by about same sized WLS fibres (since the cells belong to the same layer, A), but with varying dose rate: the dose rate of A12 is twice the dose rate of A14, with A13 having an average value. The light loss is approximately the same for a common accumulated dose value: at 10 Gy, . Although the sensitivity of the data is poor given the large uncertainties, one can observe that no huge dose rate effects are present, at this dose rate level.
6.4 Expected performance at the end of HL-LHC
The results presented so far focus on cells experiencing the most extreme irradiation conditions in TileCal. These cells were already subjected to a total dose that the least exposed cells, with much lower dose rate, will only attain at the HL-LHC phase. So, assuming that the dose rate does not play a substantial role on the radiation hardness model for the range of dose rates under consideration, the performance of the least irradiated cells can be inferred from the current data. The A13 cell is used as the reference because its material is common to the other cells in the barrel. The following is observed:
-
•
Cells in the D layer are expected to have a dose between 4 and 200 Gy at the end of HL-LHC and a corresponding expected loss in light yield below 10% for the majority of the cells.
-
•
For the B/C layer the expected dose is 20 to 500 Gy and the expected degradation is below 15% for most of the cells.
-
•
For cells in the A layer the expected dose is 300 to 1700 Gy; the reduction of systematics and more data are needed in order to make an extrapolation to this dose region.
7 Conclusions
The ATLAS TileCal calibration data from Run 2, 2015 to 2017, were analysed in view of determining the current performance of the optical components of the detector and estimating their robustness at the end of the HL-LHC phase.
Concerning photomultiplier tubes, a slow loss rate of 0.08%/C on integrated charge is determined from the laser calibration data, and the expected degradation of the PMT response at the end of HL-LHC is at most 40%, for the most stimulated photosensors.
Contrarily to photosensors, scintillator tiles and WLS fibres cannot be replaced and their expected degradation by the HL-LHC phase should be early determined.
The accumulated degradation has a clear trend. This allowed to draw a model independent projection of the light yield loss of TileCal cells with the only assumption that dose rate effects are not substantial in the radiation hardness of organic materials. We conclude that 60% of the TileCal cells (B/C and D layers) are expected to have a relative light yield of more than 85% at the end of the HL-LHC phase. For the most exposed A-layer, the data are not enough to allow an extrapolation for such a far region. We need carefull understanding of the systematics to find ways to reduce their impact on the measurement, and more data in order to better define the fit model.
8 Acknowledgements
The author acknowledges the support of the grant CERN/FIS-PAR/0008/2017 from FCT, Portugal. The author thanks A. Henriques and A. Maio for the important contributions to this work.
Copyright 2018 CERN for the benefit of the ATLAS Collaboration. Reproduction of this article or parts of it is allowed as specified in the CC-BY-4.0 license.
References
References
- [1] ATLAS Collaboration 2008 J. Inst. 3 S08003
- [2] ATLAS Collaboration 1996 ATLAS Tile Calorimeter: Technical Design Report CERN-LHCC-96-042
- [3] ATLAS Collaboration 2010 Eur. Phys. J. C 70 1193-236
- [4] ATLAS TileCal 2007 The Production and Qualification of Scintillator Tiles for the ATLAS Hadronic Calorimeter ATL-TILECAL-PUB-2007-010
- [5] Silva J, Maio A, Pina J, Santos J, Saraiva J G 2007 Nucl. Inst. Met. A 318-21
- [6] ATLAS Collaboration https://twiki.cern.ch/twiki/bin/view/AtlasPublic/RadiationSimulationPublicResults
- [7] ATLAS Collaboration https://twiki.cern.ch/twiki/bin/view/AtlasPublic/ApprovedPlotsTileCalibration
- [8] CMS HCAL Collaboration 2016 J. Inst. 11 no.10
- [9] CMS Collaboration 2017 The Phase-2 Upgrade of the CMS Barrel Calorimeters, Technical Design Report CERN-LHCC-2017-011