Contrasting the magnetism in La2-xSrxFeCoO6 ( = 0, 1, 2) double perovskites: the role of electronic and cationic disorder
Abstract
The magnetism of the double perovskite compounds La2-xSrxFeCoO6 ( = 0, 1, 2) are contrasted using magnetization, neutron diffraction and electron paramagnetic resonance with the support from density functional theory calculations. La2FeCoO6 is identified as a long-range ordered antiferromagnet displaying a near-room temperature transition at = 270 K, accompanied by a low temperature structural phase transition at = 200 K. The structural phase transformation at occurs from at 300 K to at 200 K. The density functional theory calculations support an insulating non-compensated AFM structure. The long-range ordered magnetism of La2FeCoO6 transforms to short-range glassy magnetism as La is replaced with Sr in the other two compounds. The magnetism of La2FeCoO6 is differentiated from the non-equilibrium glassy features of Sr2FeCoO6 and SrLaFeCoO6 using the cooling-and-heating-in-unequal-fields (CHUF) magnetization protocols. This contransting magnetism in the La2-xSrxFeCoO6 series is evidenced in electron paramegnetic resonance studies. The electronic density-of-states estimated using the density functional theory calculations contrast the insulating feature of La2FeCoO6 from the metallic nature of Sr2FeCoO6. From the present suite of experimental and computational results on La2-xSrxFeCoO6, it emerges that the electronic degrees of freedom, along with antisite disorder, play an important role in controlling the magnetism observed in double perovskites.
I Introduction
Double perovskites SrO6, where are transition metal elements, attracted
attention due to the observation of large magnetoresistance in the case of
= Fe/Mo Kobayashi et al. (1998); Sarma et al. (2000); Sarma (2001).
The cation-ordered Sr2FeMoO6 was reported to show room temperature, low-field
magnetoresistance (MR) with the striking feature of scaling of MR with the square
of spin-polarization of carriers, , where is the saturation
magnetization Kobayashi et al. (1998).
This suggested the potential for spintronics and giant magnetoresistance applications in an ideally
ferromagnetic double perovskite lattice, which motivated experimental
studies connected to the low-field MR in Sr2FeMoO6 Sarma et al. (2000); Navarro et al. (2001).
However, double perovskites prepared at high temperatures in laboratories
suffer from antisite disorder on the site.
This leads to the disruption of the O
magnetic exchange paths and consequent weakening of ferromagnetism
predicted by the Goodenough-Kanamori rules for an ordered cation arrangement of cations
Kanamori (1959); Goodenough (1955).
Antisite disorder has a strong bearing on the magnetic and the transport
behaviour of the double perovskites.
Significant differences in MR at low temperature (4.2 K) was reported in the case of
ordered (degree of Fe/Mo ordering = 91), versus the disordered
(degree of Fe/Mo ordering = 31) Sr2FeMoO6.
Though the Fe/Mo-based SrO6 was studied in detail for its
magnetoresistive properties, less attention was paid to the Fe/Co based SrO6
compounds which offer the possibility of tuning the structural, valence and spin-state
parameters connected to the magnetic behaviour.
This is particularly possible due to the presence of Co, which can adopt
low-spin (LS), high-spin (HS) or intermediate-spin (IS) states depending
on the valence that is stabilized in a particular double perovskite structure.
The orbital degrees of freedom and consequently the spin-orbit
coupling effects attain importance in this case.
It is, hence, understood that the crystallographic antisite disorder has a significant
impact on the magnetism of double perovskites.
Another important structural detail that has a significant bearing is the
distortions of the metal-oxygen octahedra that constitute the perovskite.
The ideal perovskite structure adopts highly symmetric cubic space
group where the cation is surrounded by 12 anions and the
cation by 6 anions.
The three-dimensional view of the perovskite structure is that of a corner-sharing
octahedra.
Distortions, tilting or cation displacements in the octahedra lead to a deviation from the ideal
cubic structure and can lead to low symmetry space groups like or .
A convenient classification of how the tilts in the perovskite structure leads to different
space groups symmetries is provided by Glazer Glazer (1972).
Using this system, a tilt in the octahedra is described by specifying the rotations of the
octahedra about each of the three cartesian axes.
The space group belongs to the tilt system
and the rhomboehedral space group , .
The rotation pattern of the orthorhombic space group is determined by
two tilts which are and .
The octahedral tilts and rotations are extremely important to single and layered perovskite
compounds in bringing about novel type of ferroelectricity Benedek et al. (2012).
The double perovskite compounds are generally found to the adopt
random, rock salt or layered structure types depending on the degree of cation
arrangement Anderson et al. (1993).
Space groups and (random), ,
(rock salt) and (layered) were predicted based on this Anderson et al. (1993).
The role of cation disorder in the crystal structure and magnetism of the
SrO6 compound Sr2FeCoO6 (SFCO) was investigated by some of us Pradheesh
et al. (2012a).
SFCO was seen to adopt the tetragonal space group with the lattice parameters, = 5.4609(2) Å and = 7.7113(7) Å; which is about 2 reduced in the and compared to those of Sr2FeMoO6.
The magnetic ground state is identified as a canonical spin glass with a spin freezing temperature,
75 K, Pradheesh
et al. (2012a) which is quite different from the ferrimagnetic ground state of
Sr2FeMoO6 with a in the range 410 450 K Patterson et al. (1963).
Albeit the differences in the magnetic ground state and the lattice parameters, SFCO displays
large magnetoresistance of 63 at 14 K in 12 T Pradheesh
et al. (2012b).
Strong antisite disorder was observed in SFCO along with the presence of mixed valence
states for Co.
The disorder effect and mixed valence in SFCO gave rise to not only the spin glass
magnetism, but also to large magnetoresistance derived from the spin scattering
of the carriers localized by the magnetic moments in the spin glass state.
Additionally, it also lead to the development of exchange bias Pradheesh
et al. (2012c).
Upon replacement of Sr with La in the case of SrLaFeCoO6(SLFCO), features of a magnetic glass
were observed Pradheesh et al. (2017).
The magnetization of SLFCO showed an anomaly at 75 K.
Despite the non-equilibrium metastable magnetic state, significant magnetoresistance of
about 47 was observed in SLFCO at 5 K in 8 T Pradheesh
et al. (2012b).
With the addition of La, a significant change in the crystal structure was the stabilization of monoclinic
space group .
Although the monoclinic structure is amenable to perfect ordering of Fe and Co in two different Wyckoff
positions and , a high degree of disorder ( 90) was observed in SLFCO.
The present paper extends the work on SFCO and SLFCO to the crystal structure and
magnetism of La2FeCoO6 (LFCO).
Using the experimental tools of magnetization, neutron diffraction and electron
paramagnetic resonance (EPR) we study the structure and magnetism in LFCO
and compare it with that of SFCO and SLFCO.
Density functional theory (DFT) calculations on all the three compounds support our
experimental findings.
It is seen that LFCO develops magnetic long-range order at significantly high temperatures ( 270 K) and subsequently undergoes a structural phase transition at 200 K.
The magnetism in LFCO is opposed to that of SFCO and SLFCO, which are seen to be
magnetically disordered below 75 K.
II Methods
II.1 Experimental techniques
Polycrystalline samples of La2FeCoO6 were prepared following sol-gel method as described in Reference [Pradheesh et al., 2012a], which explains the preparation of SFCO. For the present work, LFCO and SLFCO were prepared using a similar synthesis method. The synthesized compounds were first analyzed using powder X-ray diffraction to check phase purity and crystal structure. Magnetic measurements were carried out on pressed pellets in a Magnetic Property Measurement system SQUID Vibrating Sample Magnetometer (MPMS-SVSM) in the temperature range, 5 350 K and magnetic field 7 T. Zero field cooling (ZFC), field-cooled warming (FCW) and field cooled cooling (FCC) protocols were used to measure dc magnetization. Neutron powder diffraction experiments on LFCO and SLFCO were performed at WISH (Rutherford Appleton Laboratory, UK) Chapon et al. (2011). Roughly 8 g of well-characterized powder sample was used for each neutron experiment. The diffraction data was analyzed using Fullprof Suite of programs Rodriguez-Carvajal (2017) for Rietveld refinements and the software SARA Wills (2000) was used for the analysis of magnetic structure using representation analysis. EPR data were recorded on a Bruker EMX Plus X-band ( 9.43 GHz) spectrometer, equipped with a high sensitivity probe head. A ColdEdgeTM ER 4112HV In-Cavity Cryo-Free VT system connected with an Oxford temperature controller was used for low temperature measurements.
II.2 Computational methods
We first present the results of the parameter-free first-principles density functional theory computations Hohenberg and Kohn (1964); Kohn and Sham (1965) to elucidate the structure and magnetism in the series of three compounds Sr2FeCoO6, SrLaFeCoO6 and La2FeCoO6. Our calculations take into account the experimental low temperature crystal structure details and hence are more reliable than the previous reports. All computations were performed for the relevant low temperature structures, obtained from our neutron experiments. All computations were performed for fixed lattice and positions. We determined electronic and magnetic properties for SFCO, SLFCO and LFCO, for fixed structure, neglecting relaxation effects of any crystallographically allowed degrees of freedom. All computations were performed with the 3D planewave software package VASP Kresse and Hafner (1993); Kresse and Furthmüller (1996a, b) with the projector-augmented wave method Blöchl (1994); Kresse and Joubert (1999) with the PBE-GGA exchange correlation functional Perdew et al. (1996) and included on-site Coulomb interactions (DFT + U) Dudarev et al. (1998). U = 5.0 eV for Fe and Co, = 400 eV and a -point spacing of 0.25 were used for all computations, similar to the previous work on LFCO Fuh et al. (2015) and related compounds Wu et al. (2011); Pruneda et al. (2008); Yang et al. (1999). The -point density ensured that it was sampled homogeneously across different crystal structures, facilitating a comparison of computed properties. For Sr, La, Fe, Co, and O, we considered explicitly 544, 5655, 34, 34, and 22 as shells in our computations, respectively. In order to explore the effect of spin-lattice coupling and the robustness of the electronic structure in the vicinity of the Fermi energy, we included spin-orbit coupling in the most stable configurations and in order to resolve better the small effects of spin-orbit coupling we used a denser centered point grid with a spacing of 0.15.
III Results
III.1 Density functional theory of La2-xSrxFeCoO6
III.1.1 La2FeCoO6
he electronic density of states (eDOS) for all the three compositions of La2-xSrxFeCoO6are presented in Fig 1. We tested the oxidation states of all three compounds with different cation distributions denoted as A, C, and G, adopting the labeling of magnetic structures in perovskites Wollan and Koehler (1955). If the two Fe ions are in the same plane perpendicular to the long axis, we refer to an A-structured arrangement (4 Fe and 2 Co nearest neighbors); if the two Fe ions are on a line parallel to the long axis, they form a C-structured arrangement (2 Fe and 4 Co nearest neighbors); if all nearest-neighbors are of opposite type, they are labeled as G-structured arrangement (0 equal and 6 non-equal neighbors).
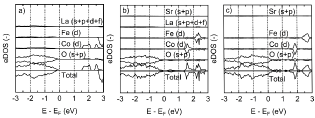
In the case of La2FeCoO6, total energy differences between A, C, and G transition metal arrangements are less than 9.0 meV/5 atoms, consistent with strong (Fe,Co) antisite disorder. This is approximately an order of magnitude smaller in energy than computed for BaxSr1-xCoyFe1-yO3-δ, where a single (Fe,Co) exchange requires 80 meV Kuklja et al. (2012). The ground state is G-structure and insulating. The computed magnetic structure corresponds to non-compensated AFM with site projected magnetic moments of +4.2, +4.2, -3.1, -3.1 , for Fe and Co (Fig. 1 (a)). The magnetic moments are consistent with Fe2+(HS) and Co4+(IS) charge assignments, as reported before Fuh et al. (2015), except that our magnetic ground state is not FM, but non-compensated AFM as described recently Wang et al. (2018). All structure/oxidation states/magnetic moment arrangements converged to the same oxidation state, described above. Thus, no valence disorder is required to explain the magnetic ground state of LFCO. Similarly, A-, and C- structured transition metal arrays form excited states. They are AFM with magnetic moments of +4.2, -4.2, -3.1, +3.1 , and 9 meV/5 atoms and 3 meV/5 atoms higher than the predicted to be non-compensated AFM. This near-degeneracy of states may explain the small hysteresis in the magnetization curve of LFCO (Fig. 2 (b)). A-, C-, G-plaquettes are randomly generated at the high synthesis temperature ( 1000∘ C) and form the structural template for LFCO. If so, the magnetic state is likely a superposition of non-compensated AFM and AFM structure at low temperature. Moreover, CHUF2 observations (presented in Section III.4) suggest unsaturated magnetic moments, in general agreement with our computed results. The small energy differences do suggest that spin-orbit coupling may influence the magnetic structure. Our results show that energy differences between different spin orientations are 1 meV/5 atoms. We find that spins sub-parallel to the [001] direction are energetically most favorable, followed by [010] and [111] magnetization directions. The orbital and spin moments for the most stable [001] magnetic structure are parallel for Fe, as expected from Hund’s rules for less than half-filled electron shells (3). Interestingly, we find an orbital moment for Co, suggesting that Co4+ is not in a high-spin state (3). However, the orbital moments are at least two orders of magnitude smaller than the spin magnetic moments, but support a small canting confined to the -plane, consistent with our neutron scattering data (Section III.3).
III.1.2 SrLaFeCoO6
In the case of SLFCO, the DFT ground state is AFM with a G-type transition and a C-type Sr, La arrangement and site-projected magnetic moments of +3.9, -3.9, -2.8, +2.8 , and semi-metallic electronic structure (Fig. 1 (b)). In an ionic picture (Fe) + (Co) = 7. The magnetic moments are consistent with Fe2+ (HS) and Fe4+ (HS), leaving Co in a +5 or +3 charge state, with even magnetic moments, in contrast to the computed moment. This discrepancy may be attributed to charge ordering, and the coexistence of Co5+ (HS) and Co3+ (IS) states suggesting the presence of mixed valence states Pradheesh et al. (2012a). Moreover, we find that the second most stable phase is FM with the same cation arrangement as the ground state, but 1.5 meV/5 atoms less stable. The site projected magnetic moments are +4.0, +4.0, +2.0, +3.0 , for Fe, and Co, respectively. The magnetic moments of one of the Co atoms is predicted to decrease by 1 , as compared to the ground state, and consistent with a charge assignment of Co3+(IS), and Co5+(IS). The existence of a low lying FM state is in excellent agreement with the interpretation of our magnetometry (Section III.4) and our EPR results (Section III.5).
III.1.3 Sr2FeCoO6
For SFCO, the DFT computations show that the ground state is an
antiferromagnetic metal (Fig 1 (c)), with G-type transition
metal ion and spin arrangement.
The cell magnetic moment (20 atoms) is zero and the site projected magnetic moments are +3.7 , -3.7 , -2.9 , +2.9 for Fe and Co respectively, in overall agreement with our experimental observations.
The second most stable state predicted is ferromagnetic with C-type arrangement, and 4 meV/5 atoms less stable than the antiferromagnetic ground state, and a magnetic moment is 10.6 /20 atoms.
Given the small energy difference it is to be expected that G-type and C-type structural plaquettes can coexist at the high synthesis temperatures.
More importantly, we note that the magnitude of the site-projected magnetic moments
are 3.8 , 4.0 , 2.8 , and 2.9 ,
for the two Fe and Co atoms, respectively.
Regardless of the initialized multiplet in the computations, the magnitude of the final spins was always within 0.3 of the ground state, supporting a common oxidation state.
A consistent set of oxidation states is Fe4+ (HS) and Co4+ (IS),
and similar to LFCO, the DFT results do not require valence state mixing for SFCO.
Therefore, the DFT computations suggest that magnetic multiplets are energetically close and can coexist at low temperatures, leading to a broadened EPR signal, and enabling a complex magnetic state.
With this backdrop of the structure, electronic density-of-states and the magnetic
structures determined, we now take a look at the magnetism of the three
La2-xSrxFeCoO6 compounds reflected in experiments.
III.2 La2FeCoO6: Magnetization
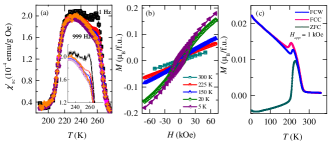
Macroscopic magnetization of La2FeCoO6 measured using ac and dc magnetometry are presented in Fig 2. The ac susceptibility, , in the frequency range 1 Hz to 999 Hz and temperature range 200 K300 K is shown in the panel (a). A magnetic phase transition at 270 K is clearly seen in Fig 2 (a). A weak frequency dependence of susceptibility is observed at . In Fig 2 (a), a significant reduction in the magnetization is observed at 200 K. The features in magnetization correlates with the structural phase transition in LFCO from to which is described in detail in the next subsection. The isothermal magnetization curves at 5 K, 20 K, 150 K, 225 K and 300 K are shown in Fig 2 (b). The magnetization isotherms in (b) show hysteresis at low temperatures, especially at 20 K and 5 K. However, the maximum magnetic moment attained at 5 K with the application of 7 T is 0.2 f.u. We note that our DFT computations described above are consistent with the macroscopic magnetization measurements if the magnetic domains are randomly oriented. The dc magnetization measurements shown in (c) support the magnetic transition at . A large irreversibility between the ZFC and FCW curves of magnetization is observed. Additionally, a strong thermal hysteresis of the FCC and FCW curves is seen around 200 K. It is revealed later in the next section that it is a structural transition that causes the thermal hysteresis and the large irreversibility. The magnetic phase transition in the present case occurs close to 300 K while our measurement capability was limited upto 350 K thereby not permitting a Curie-Weiss analysis in a large paramagnetic range.
III.3 La2FeCoO6: Neutron diffraction
In order to understand the magnetic structure of La2FeCoO6 that would explain the magnetization features observed in Fig 2, we
performed neutron diffraction experiments.
The results are presented in Fig 3.
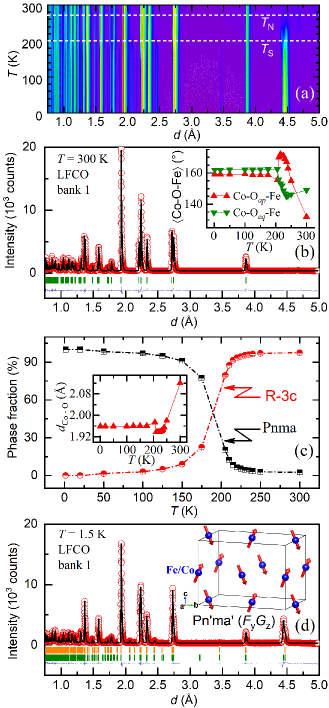
A magnetic anomaly at 270 K can be
discerned from (a) where the development
of an additional Bragg peak at 4.5 Å occurs.
This feature relates to the (011) and (110) Bragg peaks
which is indicative of an AFM magnetic structure of the G type.
The Rietveld refinement of the diffraction pattern at 300 K is
shown in panel (b) where the experimental intensity is plotted in red
circles and the calculated as black solid line.
The crystal structure of LFCO at 300 K is refined in the
rhombohedral space group, with the lattice parameters
= 5.4935(2) (Å) and = 13.2343(2) (Å).
A structural phase transition is observed
in LFCO at 200 K where the
crystal structure transforms from to orthorhombic .
Presented in Fig 3 (c) is a plot of the percentage phase
fraction of the two structural phases as a function of temperature.
In the intermediate temperature region centered
around 200 K, mixed structural phases exist. In the inset of
Fig 3 (b), the bond angle CoOFe
and in the inset of (c), the bond distance
in La2FeCoO6 are shown. Both the bond angles and the bond distances reflect
strong anomalies around where the structural phase transition occurs.
The thermal hysteresis in magnetization and the large bifurcation if the
ZFC/FC curves in LFCO is due to the coexistence of
mixed and phases over a large temperature range,
having different magnetization responses to an external magnetic field.
| 300 K | ||||
|---|---|---|---|---|
| La | 0 | 0 | 0.25 | |
| Fe | 0 | 0 | 0 | |
| Co | 0 | 0 | 0 | |
| O | 0 | 0.4461(2) | 0.25 | |
| 1.5 K | ||||
| La | 0.0170(9) | 0 | 0.25 | |
| Fe | 0 | 0 | 0.5 | |
| Co | 0 | 0 | 0.5 | |
| O1 | 0.4935(6) | 0.25 | 0.0631(7) | |
| O2 | 0.2697(6) | 0.0385(3) | 0.7304(2) | |
| 300 K | 1.5 K | |||
| Co-Oap | 1.9541(12) | 1.9577(2) | ||
| Co-Oeq | 1.961(4) | |||
| Fe-Oap | 1.9541(12) | 1.9577(2) | ||
| Fe-Oeq | 1.961(4) | |||
| Fe-Oap-Co | 159.30(3) | |||
| Fe-Oeq-Co | 160.41(12) |
As the temperature is reduced to 1.5 K, the magnetic Bragg peaks (011) and (110) are enhanced in the diffraction pattern, see Fig 3 (d). This corresponds to the Bragg intensity that develops at = 4.5 Å at the , Fig 3 (a). The nuclear structure of LFCO at 1.5 K retains the symmetry. The magnetic structure of LFCO was solved after determining the propagation vector through a profile fit to the low temperature magnetic peaks ((011) and (110)), thus obtaining (0 0 0). The -search utility within the FullProf Suite was used for this purpose. Using this propagation vector, the symmetry-allowed magnetic representations for LFCO were determined using SARA Wills (2000). The crystal structure was assumed to be a pure phase of in this case and the magnetic moments of Fe and Co were assumed to be same since they occupy the same crystallographic position within the unit cell. The best description to the observed diffraction data was obtained with the representation (, BNS label 62.448). A schematic of the arrangement of the magnetic moments in the unit cell in representation is shown in the inset of Fig 3 (d), which shows the AFM structure. During the course of refinement, magnetic moment components were allowed to vary along all crystallographic directions, however, a negligible value was obtained for the -component of the magnetic moment. Absence of a spin re-orientation transition at high temperatures was confirmed and subsequently, the magnetic moments were restricted to be in the and directions only in agreement with the DFT calculations. After refining the magnetic moments at 4 K, we obtained ordered moment of 1.89(7)(Fe,Co) atoms. The structural parameters extracted from the Rietveld refinement of neutron diffraction patterns at 300 K and 1.5 K are presented in Table 1.
III.4 CHUF magnetization of La2-xSrxFeCoO6
From the above sections it is clear that the magnetism of La2FeCoO6 is different from the disordered magnetism found in Sr2FeCoO6 and SrLaFeCoO6Pradheesh et al. (2012a); Pradheesh et al. (2017). In order to contrast the magnetism in the three compounds, we performed detailed protocol-based magnetization measurements. Cooling-and-heating-in-unequal-fields (CHUF) protocol is a useful magnetization protocol which can be used to record magnetization curves as a function of temperature in order to differentiate the non-equilibrium nature of the glass-like magnetic features from that of an equilibrium response Kushwaha et al. (2009); Banerjee et al. (2009); Roy and Chattopadhyay (2009). In what we term as CHUF1 protocol, the sample is cooled across the transition temperature in a certain applied magnetic field . At the lowest temperature, is isothermally changed to a different value of measuring field and the magnetization is measured while warming the sample. The result of this measurement protocol for LFCO, SLFCO and SFCO are presented in (a), (b) and (c) respectively in Fig 4. The magnetic field used to measure the magnetization in the warming cycle is notated as in the figure. Several values of external magnetic fields 0 T, 0.05 T, 0.1 T, 1 T, 3 T and 5 T were used as to cool the samples (see, (a), (b), (c)). In all the three cases, = 2 T was used to measure the magnetization while warming. In a second protocol, CHUF2, the cooling field was kept constant at 2 T during the time the sample was cooled down to low temperature and, subsequently, different fields of were used in the warming cycle to measure the magnetization. The results of this protocol are presented in (d), (e) and (f) of Fig 4 for LFCO, SLFCO and SFCO, respectively. In the case of LFCO which orders long-range at high temperature, no signature of magnetic relaxation or non-equilibrium dynamics is seen in the CHUF1 measurement in (a).
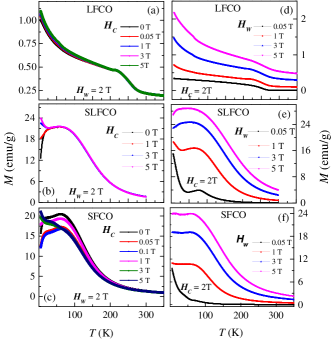
Note that a upto 5 T and a warming field of 2 T does not affect the magnetization features. However, apart from a discontinuity in the magnetization at 270 K, a second anomaly is discernible at 200 K in LFCO, coinciding with the structural transformation between and phases. The CHUF measurement reveals that LFCO behaves in the same way for the and regimes and hence a magnetic glass-like state can be ruled out. In the case of CHUF2 protocol, we see that the magnetization increases with higher value of measuring fields for . The anomalies at 270 K and 200 K are still present however, with the application of 3 T and 5 T for , the magnetization at low temperature is enhanced. In the case of SLFCO, the CHUF1 protocol shows contrasting effects for the two cases, and , as seen in (b). When the cooling field is larger than the measuring field, i.e., when , the magnetization below the anomalous temperature 75 K is significantly increased. This observation is consistent with a kinetically arrested ferromagnetic state of SLFCO. When SLFCO is warmed up, this glass-like arrested ferromagnetic phase reverts to the equilibrium antiferromagnetic phase. In the CHUF2 protocol for SLFCO shown in the figure panel (e), we can see that the magnetization tends to increase in magnitude with higher values of . Note that there is a drastic difference in the magnetization profile below when the CHUF1 and CHUF2 curves of SLFCO are compared. From Fig 4 (e) it is clear that when , the weak anomaly seen below vanishes and a higher magnetization is resulted. The features seen in (b) and (e) confirm that SLFCO has a glass-like mixed phase where a large volume fraction of the ferromagnetic phase devitrifies. In the case of SFCO, the CHUF1 and the CHUF2 data presented in the figures (c) and (f) respectively show signs of magnetic relaxation similar to that of SLFCO albeit weaker in magnitude. The CHUF1 protocol in (c) do indicate that the magnetization for shows an enhanced magnitude below the .
III.5 Electron paramagnetic resonance of La2-xSrxFeCoO6
As another experimental tool to contrast the magnetism in the three compounds, we use electron paramagnetic resonance (EPR). The differing features of the magnetic ground states of SFCO, SLFCO and LFCO are consistent with the EPR observations presented in Fig 5 (a-c), where the EPR signals at 20 K, 40 K, 60 K, and at 300 K are plotted. The EPR spectra showed a dramatic dependence on La and Sr composition in the present series of compounds, consistent with magnetization and neutron diffraction results. Figure 5 (a) plots the temperature evolution of EPR spectrum measured at 20 K, 40 K, 60 K and 300 K for LFCO. For LFCO at 300 K, we observe two distinct EPR signals. The first signal at = 2.05(6) (the central field, = 3266 G) associated with the peak-to-peak line width () of 3266 G, and the second signal appears at = 0.76(9) ( = 8728 G). We believe that the former signal is due to the strongly exchange coupled Fe3+ and Co2+ spins, whereas the latter one was found to originate from the cavity background, and hence is discarded from further discussion. Because of the presence of the two signals, a broad Lorentzian curve does not completely account for the EPR linshape of LFCO at 300 K as can be understood from Fig 5 (a). It can be immediately noticed that as we lower the sample temperature from 300 K, a dramatic shift in the EPR signal toward the low field region occurs. At 60 K, we detected a complete signal associated with value of 16.07 ( = 418 G), characterized by of 552 G. These are the benchmark signatures of an ordered antiferromagnetic phase.
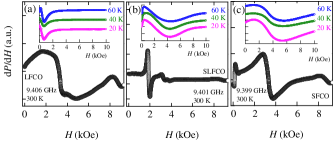
As we started to replace Sr in place of La in LFCO, the EPR signal broadens and shifts to the high field region, which becomes particularly noticeable at low temperatures (b and c panels). Furthermore, the disordered magnetic phase increases in abundance upon increasing the Sr content. For all the samples, as the temperature increases, the EPR signal gets sharper due to motional narrowing effect. Both (b) SLFCO and (c) SFCO appear to contain at least two magnetic phases that can give rise to spin glass-like behavior, which is consistent with our magnetometry results Pradheesh et al. (2012a); Pradheesh et al. (2017). The DFT computations also suggested that magnetic multiplets are energetically close in these compounds and can coexist at low temperatures and also at elevated magnetic fields, thereby leading to a broadened EPR signal, enabling a complex magnetic state.
| (K) | SFCO | LFCO | SLFCO |
|---|---|---|---|
| (G) | (G) | (G) | |
| 60 | 1.90, 4306(2) | 16.07, 552(1) | 2.70, 4110(4) |
| 40 | 2.02, 4053(2) | 20.41, – | 2.65, 3741(2) |
| 20 | 2.03, 4111(2) | 22.02, – | 2.75, 3952(2) |
It can be noted that the EPR response of the La2-xSrxFeCoO6 compounds are qualitatively different from that of Sr2FeMoO6 in which strong evidence of localized Fe3+ cores and itinerant Mo5+ electrons are found Niebieskikwiat et al. (2000); Tovar et al. (2002) consistent with our DFT results that suggest Fe4+. The values and the values estimated from the EPR curves are shown in Table 2. We have attempted to fit (not shown) the experimental EPR signal to a broad Lorentzian function of the form, = , where is the full-width-at-half-maximum which when divided by gives the peak-to-peak linewidth , and is proportional to the area under the curve. Since the fits were not of high quality due to the presence of more than one lineshape terms in the data and also because the lineshapes were seen shifted more towards the negative field values as in the case of LFCO, they are not presented here.
IV Discussion and conclusions
In this section we want to discuss the present results in
the light of the recent insight we obtained from high-resolution
inelastic neutron scattering experiments to study the hyperfine
interactions in SFCO, SLFCO and LFCO
Chatterji et al. (2018).
It was shown that the inelastic signals observed in the two
structurally and magnetically disordered compounds,
SFCO and SLFCO were very broad, suggesting a distribution
of hyperfine fields in these two materials whereas, no inelastic signal
was observed in the case of LFCO. This suggested no or very
weak hyperfine field at the Co nucleus due to the Co
electronic moment. The inelastic spectra of SFCO were
observed to be significantly narrow which could be attributed to
a weaker hyperfine local field at the Co nucleus. An assumption
of heterogeneous local fields at the Co nucleus due to the
antisite disorder is consistent with SFCO which is a
spin glass. The results from inelastic studies are in conformity with
this picture and the model fits to the inelastic spectra suggests a finite
energy splitting of 1 eV (for details of the fits, please
see Ref [Chatterji et al., 2018]).
The case of SLFCO appeared interesting as indications of
electronic spin fluctuations in nano-second time scales were
observed in the low- region, visible in the quasi-elastic channel,
confirming magnetic short-range order and electronic spin
freezing below 80 K.
From the perspective of inelastic neutron scattering,
the most surprising result was the absence of inelastic
signal in the ordered state of La2FeCoO6 down to 1.8 K.
This implies that the hyperfine field at the Co nucleus for
this material is extremely weak to measure and that the Co
moments may not be frozen at very low temperatures.
Thus we surmise that the observed magnetic properties of SFCO, SLFCO
and LFCO are not easily explained solely based on the presence of
antisite disorder. It is clear that the valence state disorder
also plays an important role as we observe quasi-elastic scattering
near the spin freezing temperatures which suggest fluctuations in the
nanosecond time scale. With the addition of
Sr in La2FeCoO6, the spin fluctuations slow down and
lead to glassy dynamics which is observed through magnetometry.
While it is beyond our computations to address antisite disorder
directly, our results do suggest that C- and G-structured transition
metal arrangements are likely to coexist.
An interesting progression of magnetic ground states is observed in La2-xSrxFeCoO6 as a function of the degree of disorder and with the replacement of La with Sr.
La2FeCoO6 has a high temperature magnetic transition
at 270 K and also a structural phase
transition at 200 K where the compound
transforms from to .
LFCO forms the only magnetically long-range ordered
member in the series, whereas SFCO and SLFCO are magnetically disordered and form
respectively, a spin glass and a magnetic glass with a spin freezing
temperature, 75 K.
The structural sensitivity at 200 K in LFCO is reflected in
the other two compounds SLFCO and SFCO as a weak anomaly in
the temperature dependence of lattice parameters and the
magnetization. Our neutron diffraction results provide ample
evidence of magnetic diffuse scattering persisting in SLFCO upto 300 K.
From the CHUF magnetization protocols, electron paramagnetic
resonance and neutron diffraction experiments, we mark SLFCO as
a magnetic glass where nano scale spin fluctuations are evidenced
through our recent inelastic neutron scattering work.
Density functional theory calculations performed by adopting the
crystal structure from the neutron diffraction predicts a AFiM/AFM
ground state which is consistent with the antiferromagnetic
state arrived at for LFCO through neutron scattering analysis.
The magnitude of the magnetic moments remained the same as in
LFCO, however, charge neutrality suggests the presence of mixed
valence states, in contrast to LFCO and SFCO.
These results align well with the overall picture obtained from our experiments
for the three compounds from recent inelastic scattering experiments
where the hyperfine fields of Co was modeled in detail.
Our present work points toward the importance of competing
valence state and spin state disorder in realizing different
magnetic ground states in La2-xSrxFeCoO6 double perovskites.
Even though our simulation cell (20 atoms) is not large
enough to address the spin-glass state directly, it provides several insights,
that distinguish LFCO from SLFCO. Both compositions show strong
antisite disorder that can support different magnetic signatures.
While the DFT findings do not provide conclusive evidence for a
spin-glass state in SFCO and SLFCO, they do suggest that the
mechanism for spin-glass formation in SLFCO may be facilitated
by valence state mixing, while in SFCO, it may be attributed to
coexisting transition metal arrangements and antisite disorder.
V Acknowledgements
HSN acknowledges the UTEP start-up funds and Rising-STARS award in supporting this work. BK would like to acknowledge computing resources provided through the National Science Foundation (XSEDE) under grant No. DMR TG-110093. CMNK acknowledges the financial support by FWF project P27980-N36 and the European Research Council (ERC Consolidator Grant No 725521). SRS, CLS and LMM acknowledge UTEP Start-up funds in supporting this work, and National Science Foundation (NSF), USA, with NSF-PREM grant DMR-1205302. LMM acknowledges the Wiemer Family for awarding Student Endowment for Excellence. The authors thank S. R. J. Hennadige for his help in doing EPR measurements. HGR, PR, KS and VSN acknowledge IITM for funding SVSM.
References
- Kobayashi et al. (1998) K. I. Kobayashi, T. Kimura, H. Sawada, K. Terakura, and Y. Tokura, Nature 395, 677 (1998).
- Sarma et al. (2000) D. D. Sarma, E. V. Sampathkumaran, S. Ray, R. Nagarajan, S. Majumdar, A. Kumar, G. Nalini, and T. N. Guru Row, Solid State Commun. 114, 465 (2000).
- Sarma (2001) D. D. Sarma, Curr. Opinion Solid State and Mater. Sci. 5, 261 (2001).
- Navarro et al. (2001) J. Navarro, L. Balcells, F. Sandiumenge, M. Bibes, A. Roig, B. Martinez, and J. Fontcuberta, J. Phys.: Condens. Matter 13, 8481 (2001).
- Kanamori (1959) J. Kanamori, J. Phys. Chem. Solids 10, 87 (1959).
- Goodenough (1955) J. B. Goodenough, Phys. Rev. 100, 564 (1955).
- Glazer (1972) A. M. Glazer, Acta Crystallogr. B 28, 3384 (1972).
- Benedek et al. (2012) N. A. Benedek, A. T. Mulder, and C. J. Fennie, J. Solid State Chem. 195, 11 (2012).
- Anderson et al. (1993) M. T. Anderson, K. B. Greenwood, G. A. Taylor, and K. R. Poeppelmeier, Prog. Solid State Chem. 22, 197 (1993).
- Pradheesh et al. (2012a) R. Pradheesh, H. S. Nair, C. M. N. Kumar, J. Lamsal, R. Nirmala, P. N. Santhosh, W. B. Yelon, S. K. Malik, V. Sankaranarayanan, and K. Sethupathi, J. Appl. Phys. 111, 053905 (2012a).
- Patterson et al. (1963) F. K. Patterson, C. W. Moeller, and R. Ward, Inorg. Chem. 2, 196 (1963).
- Pradheesh et al. (2012b) R. Pradheesh, H. S. Nair, V. Sankaranarayanan, and K. Sethupathi, Euro. Phy. J. B 85, 1 (2012b).
- Pradheesh et al. (2012c) R. Pradheesh, H. S. Nair, V. Sankaranarayanan, and K. Sethupathi, Appl. Phys. Lett. 101, 142401 (2012c).
- Pradheesh et al. (2017) R. Pradheesh, H. S. Nair, G. R. Haripriya, A. Senyshyn, T. Chatterji, V. Sankaranarayanan, and K. Sethupathi, J. Phys.: Condens. Matter 29, 095801 (2017).
- Chapon et al. (2011) L. C. Chapon, P. Manuel, P. G. Radaelli, C. Benson, L. Perrott, S. Ansell, N. J. Rhodes, D. Raspino, D. Duxbury, E. Spill, et al., Neutron News 22, 22 (2011).
- Rodriguez-Carvajal (2017) J. Rodriguez-Carvajal, Fullprof Suite, http://www.ill.eu/sites/fullprof/ (2017).
- Wills (2000) A. S. Wills, Physica B 276, 680 (2000).
- Hohenberg and Kohn (1964) P. Hohenberg and W. Kohn, Phys. Rev. 136, B864 (1964).
- Kohn and Sham (1965) W. Kohn and L. J. Sham, Phys. Rev. 140, A1133 (1965).
- Kresse and Hafner (1993) G. Kresse and J. Hafner, Phys. Rev. B 48, 13115 (1993).
- Kresse and Furthmüller (1996a) G. Kresse and J. Furthmüller, Comput. Mater. Sci. 6, 15 (1996a).
- Kresse and Furthmüller (1996b) G. Kresse and J. Furthmüller, Phys. Rev. B 54, 11169 (1996b).
- Blöchl (1994) P. E. Blöchl, Phys. Rev. B 50, 17953 (1994).
- Kresse and Joubert (1999) G. Kresse and D. Joubert, Phys. Rev. B 59, 1758 (1999).
- Perdew et al. (1996) J. P. Perdew, K. Burke, and M. Ernzerhof, Phys. Rev. Lett. 77, 3865 (1996).
- Dudarev et al. (1998) S. L. Dudarev, G. A. Botton, S. Y. Savrasov, C. J. Humphreys, and A. P. Sutton, Phys. Rev. B 57, 1505 (1998).
- Fuh et al. (2015) H.-R. Fuh, K.-C. Weng, C.-R. Chang, and Y.-K. Wang, J. Appl. Phys. 117, 17B902 (2015).
- Wu et al. (2011) H. Wu, Y. Qian, W. Tan, C. Xiao, K. Deng, and R. Lu, Appl. Phys. Lett. 99, 123116 (2011).
- Pruneda et al. (2008) J. M. Pruneda, J. Íñiguez, E. Canadell, H. Kageyama, and M. Takano, Phys. Rev. B 78, 115101 (2008).
- Yang et al. (1999) Z. Yang, Z. Huang, L. Ye, and X. Xie, Phys. Rev. B 60, 15674 (1999).
- Wollan and Koehler (1955) E. O. Wollan and W. C. Koehler, Phys. Rev. 100, 545 (1955).
- Kuklja et al. (2012) M. M. Kuklja, Y. A. Mastrikov, B. Jansang, and E. A. Kotomin, J. Phys. Chem. C 116, 18605 (2012).
- Wang et al. (2018) W. Wang, W. Feng, J. Yuan, N. Pang, X. Zhao, M. Li, Z. Bao, K. Zhu, and D. Odkhuu, Physica B 540, 33 (2018).
- Kushwaha et al. (2009) P. Kushwaha, A. Lakhani, R. Rawat, and P. Chaddah, Phys. Rev. B 80, 174413 (2009).
- Banerjee et al. (2009) A. Banerjee, K. Kumar, and P. Chaddah, J. Phys.: Condens. Matter 21, 026002 (2009).
- Roy and Chattopadhyay (2009) S. B. Roy and M. K. Chattopadhyay, Phys. Rev. B 79, 052407 (2009).
- Niebieskikwiat et al. (2000) D. Niebieskikwiat, R. D. Sánchez, A. Caneiro, L. Morales, M. Vásquez-Mansilla, F. Rivadulla, and L. E. Hueso, Phys. Rev. B 62, 3340 (2000).
- Tovar et al. (2002) M. Tovar, M. Causa, A. Butera, J. Navarro, B. Martínez, J. Fontcuberta, and M. Passeggi, Phys. Rev. B 66, 024409 (2002).
- Chatterji et al. (2018) T. Chatterji, B. Frick, M. Zamponi, M. Appel, H. S. Nair, R. Pradheesh, G. R. Hariprya, V. Sankaranarayanan, and K. Sethupathi, Phys. Rev. B 98, 094429 (2018).