The evolution of galaxy intrinsic alignments in the MassiveBlack II universe
Abstract
We investigate the redshift evolution of the intrinsic alignments (IA) of galaxies in the MassiveBlackII (MBII) simulation. We select galaxy samples above fixed subhalo mass cuts () at and trace their progenitors to along their merger trees. Dark matter components of galaxies are more spherical than their progenitors while stellar matter components tend to be less spherical than their progenitors. The distribution of the galaxy-subhalo misalignment angle peaks at with a mild increase with time. The evolution of the ellipticity-direction (ED) correlation amplitude of galaxies (which quantifies the tendency of galaxies to preferentially point towards surrounding matter overdensities) is governed by the evolution in the alignment of underlying dark matter (DM) subhaloes to the matter density of field, as well as the alignment between galaxies and their DM subhaloes. At scales , the alignment between DM subhaloes and matter overdensity gets suppressed with time, whereas the alignment between galaxies and DM subhaloes is enhanced. These competing tendencies lead to a complex redshift evolution of for galaxies at . At scales , alignment between DM subhaloes and matter overdensity does not evolve significantly; the evolution of the galaxy-subhalo misalignment therefore leads to an increase in for galaxies by a factor of from to at scales . The balance between competing physical effects is scale dependant, leading to different conclusions at much smaller scales ().
keywords:
methods: numerical – hydrodynamics – gravitational lensing: weak – galaxies: star formation1 Introduction
The shapes and orientations of galaxies have an intrinsic correlation with respect to those of nearby galaxies and the overall matter distribution; this effect is known as galaxy intrinsic alignments (IA; see Troxel & Ishak, 2015; Joachimi et al., 2015; Kiessling et al., 2015; Kirk et al., 2015, and references therein for review). The importance of IA is two fold: 1) IA emerges as a natural outcome of the current paradigm of galaxy formation in the CDM cosmological model, as emphasized also in state-of-the-art cosmological hydrodynamic simulations that include direct modeling of galaxy formation (e.g., Tenneti et al., 2014; Velliscig et al., 2015; Chisari et al., 2015; Hilbert et al., 2017). IA is therefore a promising probe for galaxy formation physics. 2) If not properly modeled and removed, IA is a significant source of systematic bias in inferring cosmological parameters in weak lensing studies (Krause et al., 2016). Many of the upcoming surveys like the Large Synoptic Survey Telescope (LSST; Ivezić et al., 2008; Abell et al., 2009), Euclid (Laureijs et al., 2011), and the Wide-Field Infrared Survey Telescope (WFIRST; Spergel et al. 2015) aim to determine the dark energy equation of state to very high precision using weak lensing, and IA is one of the major sources of astrophysical systematic uncertainty for such studies (Mandelbaum, 2018). The existence of IA in galaxies with correlations out to 100 Mpc scales has been firmly established in observational data (e.g., Mandelbaum et al., 2006; Hirata et al., 2007; Joachimi et al., 2011; Singh et al., 2015). An understanding of intrinsic alignments and their scaling with galaxy mass and redshift is therefore crucial to mitigating this effect in weak lensing studies, and is also a good diagnostic for galaxy formation physics.
Intrinsic alignments have been studied using analytical methods such as the linear (Catelan et al., 2001), the nonlinear alignment model (Bridle & King, 2007), and the full tidal alignment model (Blazek et al., 2015). While these methods are easy to implement while also requiring few computational resources, they inevitably rely on assumptions about the alignment of galaxies and the underlying tidal field. This limitation can be overcome by state-of-the-art cosmological hydrodynamic simulations (e.g., Dubois et al., 2014; Schaye et al., 2015; Khandai et al., 2015; Vogelsberger et al., 2014), which can directly probe the impact of galaxy formation physics on the shapes and alignments of galaxies and the relation to their dark matter counterparts (halos/subhalos) and the tidal fields themselves. Therefore, in recent years galaxy shapes and alignments have been extensively studied using hydrodynamic simulations (e.g., Chisari et al., 2015; Tenneti et al., 2016; Chisari et al., 2017; Hilbert et al., 2017)
An important step towards understanding galaxy intrinsic alignments is to study their redshift evolution. This has been initiated by a series of works (Tenneti et al., 2015a) using the MassiveBlackII (MBII) hydrodynamic simulation (Khandai et al., 2015), including a detailed study of the redshift evolution of galaxy shapes, alignment with respect to host halo/subhalo, and associated shape-density correlation functions. A noteworthy feature of these works was that the sampling of galaxies was based on fixed subhalo mass cut () at each redshift (from ); this is somewhat representative of cuts in observed galaxy samples in properties such as stellar mass or magnitude, which are known to correlate with the host subhalo mass. However, with such an approach, the resulting redshift evolution may be dominated by the effects of sample selection. In order to study the intrinsic redshift evolution (i.e. separated from the effects of sample selection), we must select samples of galaxies at a given redshift and trace their progenitors to higher redshifts.
In this work, we study the redshift evolution of IA properties of MBII galaxies by making subhalo mass cuts at a single fixed redshift () and then tracing the properties of their progenitors along a merger tree. In Section 2, we outline the basic methodology and definitions. In Section 3, we study the redshift evolution of galaxy properties (axis ratios, galaxy-subhalo misalignment angle and density-shape correlation functions) on the merger tree. We summarize our key results in Section 4.
2 Methods
2.1 MassiveBlack-II simulation
We briefly describe MassiveBlack-II (MB-II), which is a state-of-the-art cosmological hydrodynamic simulation of structure formation (Khandai et al., 2015). MB-II is evolved from to in a cubic periodic box of comoving volume and a gravitational smoothing length of . The box contains particles (dark matter+gas). The mass of a single dark matter particle and a single gas particle is and respectively. The cosmological parameters used in the simulation are based on WMAP7 (Komatsu et al., 2011) with amplitude of matter fluctuations , spectral index , mass density parameter , cosmological constant density parameter , baryon density parameter , and Hubble parameter . Halos are identified using a friends-of-friends (FOF) halo finder (Davis et al., 1985) with a linking length of 0.2 times the mean particle separation.
2.2 Galaxy identification
Here we describe how galaxies are identified in MBII. Galaxies are defined to be the stellar component of subhalos, which are locally overdense, self-bound particle groups within a larger parent group (FOF halo) The subhalo catalogs are generated using the substructure finder SUBFIND on the halo catalogs. In SUBFIND, for each particle in the parent group, a local density is estimated using the positions of a prescribed number of nearest neighbours. After identifying the local peaks in density field, it rebuilds the parent group by adding particles in the order of decreasing density. In doing so, a saddle point is eventually reached which connects two disjoint overdense regions. The smaller structure is then identified as a candidate substructure. For further implementation details, see the original paper (Springel et al., 2001).
2.3 Constructing the galaxy merger tree
In this section, we describe the key steps involved in the construction of the galaxy merger tree. To begin with, halo/subhalo merger trees were identified by running the ROCKSTAR (Behroozi et al., 2012a) halo/subhalo finder along with CONSISTENT-TREES (Behroozi et al., 2012b), both of which are described in the following two subsections.
2.3.1 ROCKSTAR
ROCKSTAR (or ‘Robust Overdensity Calculation using K-Space Topologically Adaptive Refinement’) is an algorithm based on adaptive hierarchical refinement of FOF groups. Primary FOF groups are first identified using a FOF finder. Within each FOF group, a hierarchy of FOF subgroups (in phase space) is identified using an adaptive refinement of the linking length. The FOF subgroups at the lowest (deepest) level of the hierarchy are then converted into seed haloes. Starting with the lowest level of the hierarchy, the FOF subgroup particles are assigned to the seed haloes based on phase space distances; this process is repeated for the higher levels of the hierarachy until all particles of the parent FOF group have been assigned to the halo. After assigning all the particles, the host-subhalo relationship is calculated by assigning a seed halo to be a subhalo of the closest seed halo (within the same FOF group) with larger number of assigned particles. This process is performed until all the seed haloes are either host haloes or subhaloes. For further implementation details, see the original paper (Behroozi et al., 2012a).
2.3.2 CONSISTENT-TREES
We build a merger tree for our ROCKSTAR haloes/subhaloes using CONSISTENT-TREES algorithm (Behroozi et al., 2012b). CONSISTENT-TREES is an extension to traditional particle based (constructed by tracing trajectories of halo/subhalo particles across different time steps) tree building algorithms which can potentially compromise the continuity of halo/subhalo properties across simulation time-steps, due to the issues listed in Section 2.2 of Behroozi et al. (2012b).
CONSISTENT-TREES resolves the foregoing problem by tracing (in addition to particles) a subset of halo/subhalo properties which include halo mass, maximum circular velocity, halo position, and bulk velocity. A major component of the algorithm is to ensure continuity in these halo properties by construction. This is achieved by running a particle-based tree finder and establishing preliminary links between progenitor haloes (at time step ) and descendant haloes (at time step ). The subsequent steps consist of the following actions:
-
1.
Gravitationally tracing the positions of descendant haloes from to to obtain their most likely progenitors at ; removing progenitors whose properties do not resemble the most likely progenitors of the corresponding descendants.
-
2.
For each descendant halo at that lacks a progenitor at after step (i), a phantom progenitor is assigned with halo properties identical to its most likely progenitor at ; however, those descendant haloes that do not have progenitors for a sufficiently large sequence of time steps are removed.
-
3.
Finally, if a halo at has no descendant at after step (ii), it is merged with a halo (at ) in its vicinity that has the strongest tidal field; additionally, the halo is removed as a statistical fluctuation if it is too far away from other haloes to experience any significant tidal field.
-
4.
Steps (i) to (iii) are iterated over the range of time steps (where each iteration corresponds a pair of time slices and ) from final time to initial time . This establishes a lineage of haloes over the time range to .
Readers who are interested in more details are encouraged to refer to Section 5 of Behroozi et al. (2012b).
2.3.3 Constructing galaxy merger tree: Matching ROCKSTAR and SUBFIND
The subhalo merger trees obtained using ROCKSTAR-CONSISTENT TREES are dark matter only. In order to construct the galaxy merger tree for our SUBFIND galaxies, we must match the subhaloes on the ROCKSTAR merger tree to our SUBFIND galaxies. We perform the following steps for the matching:
-
1.
For a given ROCKSTAR subhalo (mass ) denoted by SUBHALO-RS, we select all SUBFIND subhalos (with mass ) which satisfy and within a maximum distance of , where is the virial radius of the ROCKSTAR subhalo. We then choose the SUBFIND subhalo that is closest to the ROCKSTAR subhalo, denoted by SUBHALO-RS-SUB.
-
2.
For the SUBFIND subhalo SUBHALO-RS-SUB, we select all ROCKSTAR subhalos (with mass ) which satisfy and within a maximum distance of , where is the virial radius of the SUBFIND subhalo. We then choose the ROCKSTAR subhalo that is closest to the SUBFIND subhalo, denoted by SUBHALO-RS-SUB-RS
-
3.
If (and only if) we retrieve the original ROCKSTAR subhalo at the end of step (ii), i.e., SUBHALO-RS-SUB-RS is identical to SUBHALO-RS, we say that SUBHALO-RS (from the ROCKSTAR merger tree) and SUBHALO-RS-SUB (from the SUBFIND catalog) have been matched.
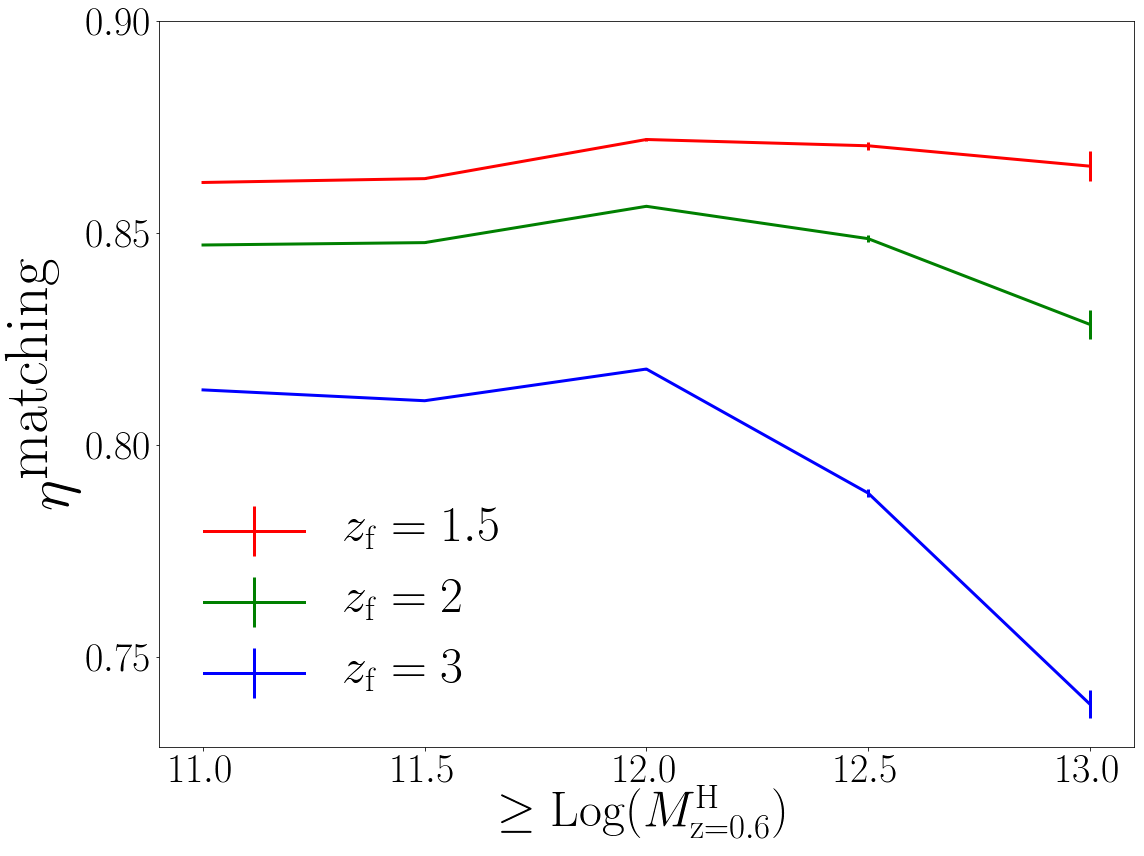
In order to generate a corresponding SUBFIND galaxy merger tree from a ROCKSTAR merger tree, every ROCKSTAR subhalo on the tree must be matched with a SUBFIND galaxy for the redshift range of our interest (). If the matching fails at any redshift within (), the entire tree is discarded. We quantify the matching success rate by defining a matching efficiency as the ratio of the number of matched SUBFIND trees over the number of original ROCKSTAR trees (present before matching). Figure 1 shows as a function of at various values of (). For (red line), the efficiency is for all masses. At higher , we lose more trees (as expected) and the efficiency decreases to for . This translates to a total of 27942 SUBFIND galaxy merger trees with progenitors up to redshift 3. This sample is sufficient for a statistical analysis, and to avoid further decrease in efficiency, we choose not to trace progenitors beyond redshift 3, hereafter defining the redshift range of our study to be . We chose since it is the time period when galaxy formation and merger processes are most active.
2.4 Shapes of galaxies and dark matter halos
We now describe how galaxy shapes are quantified. We model the shapes of the dark matter and stellar matter components of subhalos as ellipsoids in three dimensions by using the eigenvalues and eigenvectors of the reduced inertia tensor (Bailin & Steinmetz, 2005; Tenneti et al., 2014) given by
| (1) |
where is the mass of the particle and and represent the and component of the position of the particle (). is the distance of the particle from the subhalo center and is given by .
We denote the principal axis directions or eigenvectors (unit vectors) of to be with corresponding eigenvalues . The lengths of the principal axes are given by . The ellipticities can then be measured by the axis ratios,
| (2) |
where is the length of the primary (largest) axis. A perfectly spherical subhalo corresponds to and a triaxial halo corresponds to .
For a more robust measure of the shape, we adopt an iterative approach wherein we first determine the principal axes and axis ratios using all the particles in the subhalo, thereby determining the ellipsoidal volume. For each successive iteration, we then recalculate the inertia tensor and axis ratios ignoring particles outside the ellipsoidal volume. We repeat this until each iteration leads to change in , and .
2.4.1 Shape convergence test
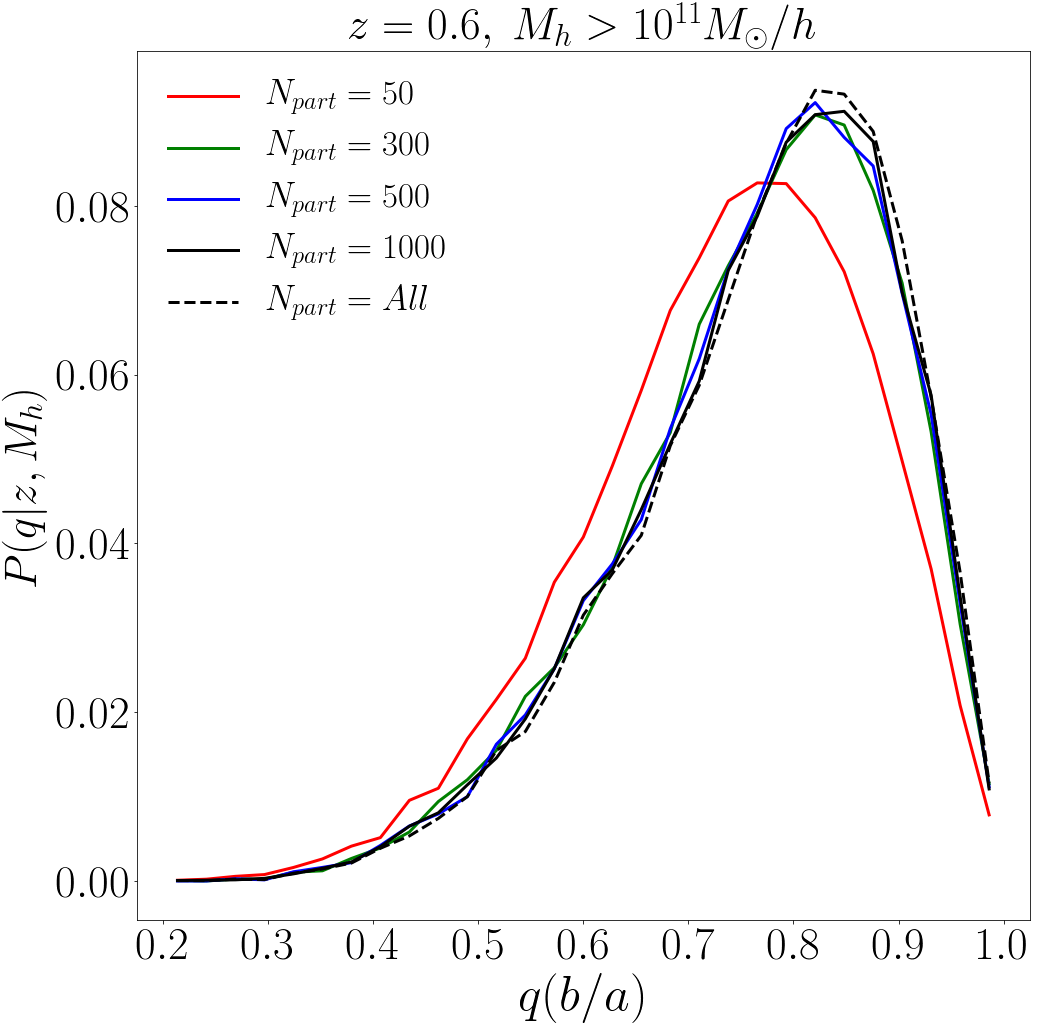
We require a sufficiently large number of particles to reliably measure galaxy (subhalo) shapes. Here, we determine the minimum number of particles. Figure 2 shows the distribution of (denoted by ) for and galaxies. We show for different numbers () of subsampled dark matter particles within each subhalo. We find that the distributions converge for whereas for , is significantly underestimated. Therefore, we assume in this work to ensure shape convergence; similarly, this choice is also sufficient for the convergence of . This sets a minimum subhalo mass of our galaxies to , which limits the subhalo mass and redshift range over which we can construct merger trees. We find that for galaxies with at , their progenitors have up to . Therefore our final choice for the subhalo mass range and redshift range in this work are and .
2.5 Misalignment angle
To quantify the misalignment between the galaxy (stellar matter component) and its host dark matter subhalo, we calculate the principal axes corresponding to the dark matter and star particles, i.e., and respectively. The misalignment angle is then defined as the angle between the eigenvectors corresponding to the primary (longest) axes.
| (3) |
2.6 Correlation function
The ellipticity-direction (ED) correlation function (Lee et al., 2008) cross-correlates the orientation of the major axis of a subhalo with respect to the large-scale density field. For a subhalo centered at position with major axis direction , the ED cross-correlation function is given by
| (4) |
where and is the position vector originating from the subhalo position () to a tracer (galaxy positions or dark matter particle positions) of the large scale matter distribution around the halo. In this work, we have used the dark matter particle positions as tracers of the matter density field.
3 Results
3.1 Stellar mass-subhalo mass relation
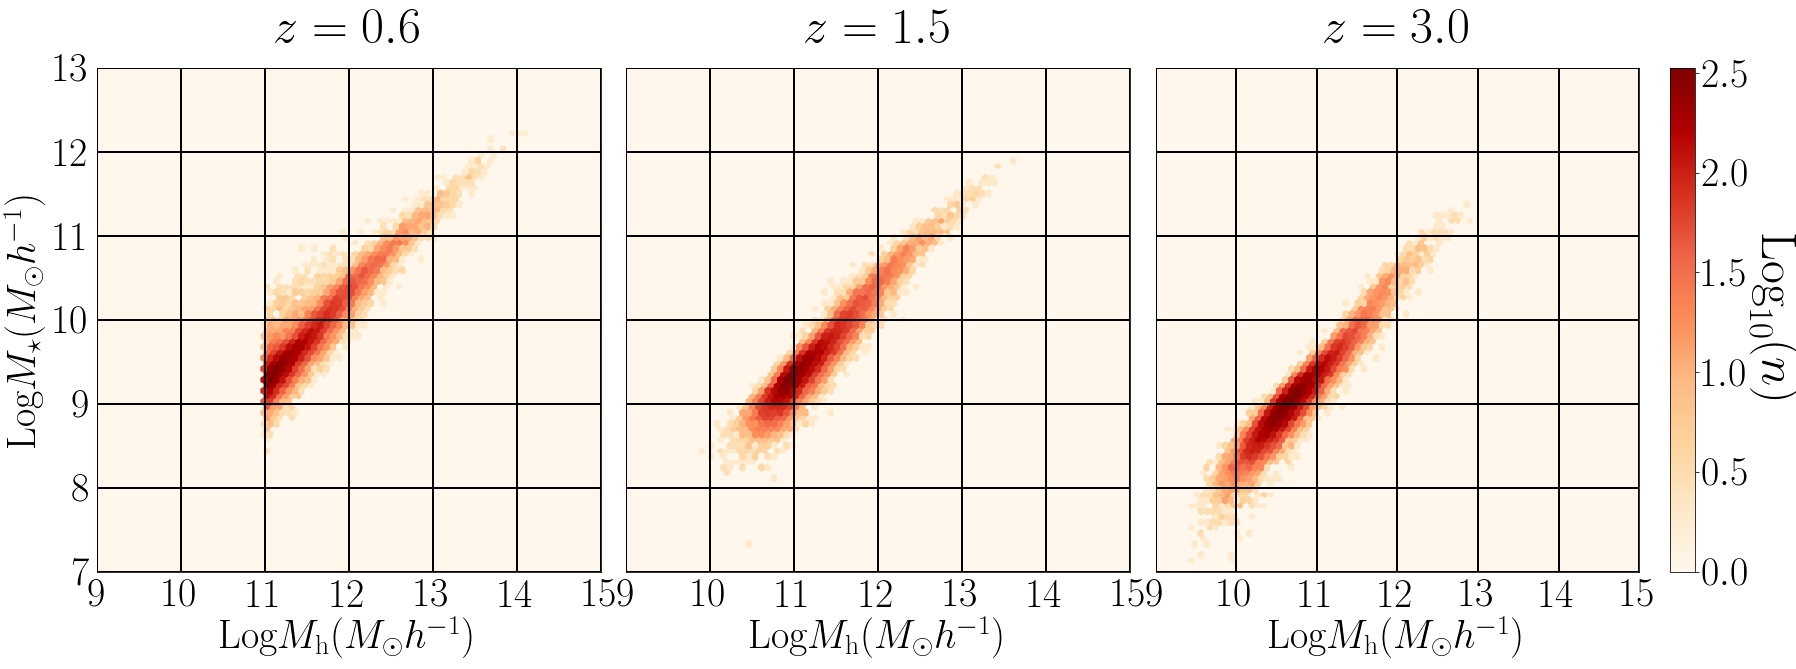
Figure 3 shows the subhalo total (dark matter+gas+stars+black hole) mass () versus stellar mass () relation of SAMPLE-TREE galaxies at , , and with at . As expected, and are strongly correlated and both decrease with increasing redshift. We also note that as redshift increases, the - relation does not significantly change either in slope or intercept, broadly consistent with predictions from semi-analytical models (Mitchell et al., 2016) as well as observations (Leauthaud et al., 2012). This implies that galaxies grow in stellar mass and dark matter mass at roughly the same rate as they evolve along the merger tree.
As the subhalo mass strongly correlates with stellar mass, and therefore also correlates with other observable properties such as luminosity, star formation rate, we shall hereafter use subhalo mass cuts to construct the various galaxy samples defined in the next section for the rest of this work.
3.2 List of galaxy samples: Definitions and notations
Before we discuss the rest of the results, we describe the types of galaxy samples that we consider in this work.
-
•
SAMPLE-TREE: The primary sample of interest consists of galaxies on the merger tree. We select galaxies with different subhhalo mass cuts () at and trace their progenitors to using the methods described in Sections 2.3. Hereafter, we shall refer to this sample as SAMPLE-TREE. For example, the sample name “SAMPLE-TREE: : " refers to galaxies at that are progenitors of the galaxies as selected at . Using this sample, we study the redshift evolution of IA properties of galaxies, without having to consider the impact of evolution due to sample selection.
-
•
SAMPLE-MCUT: The secondary sample of interest is obtained using the selection criterion of Tenneti et al. (2015a). Here we select galaxy samples with a fixed subhalo mass cut applied at all redshifts. Hereafter, we shall refer to this sample as SAMPLE-MCUT. For example, the sample name “SAMPLE-MCUT: : " refers to all galaxies at with . With this sample, the observed redshift evolution of IA properties is a combination of intrinsic redshift evolution effects, and the evolution due to sample selection.
-
•
SAMPLE-RANDOM: To interpret the impact of requiring galaxies to be a part of a merger tree, it will be necessary to look at differences in IA properties between a progenitor (merger tree) galaxy and a randomly chosen galaxy of similar mass. To do this, we construct a galaxy sample by randomly drawing galaxies from the full sample at some redshift (all galaxies in the simulation snapshot), such that the total (dark matter+gas+stars+black hole) mass function is modulated to be identical to that of SAMPLE-TREE (progenitor) galaxies at the same redshift. We shall refer to this as sample SAMPLE-RANDOM. For example, the sample name “SAMPLE-RANDOM: : " refers to a random sample of galaxies at whose mass function is identical (by construction) to “SAMPLE-TREE: : ".
3.3 Evolution of galaxy shapes and misalignment angles
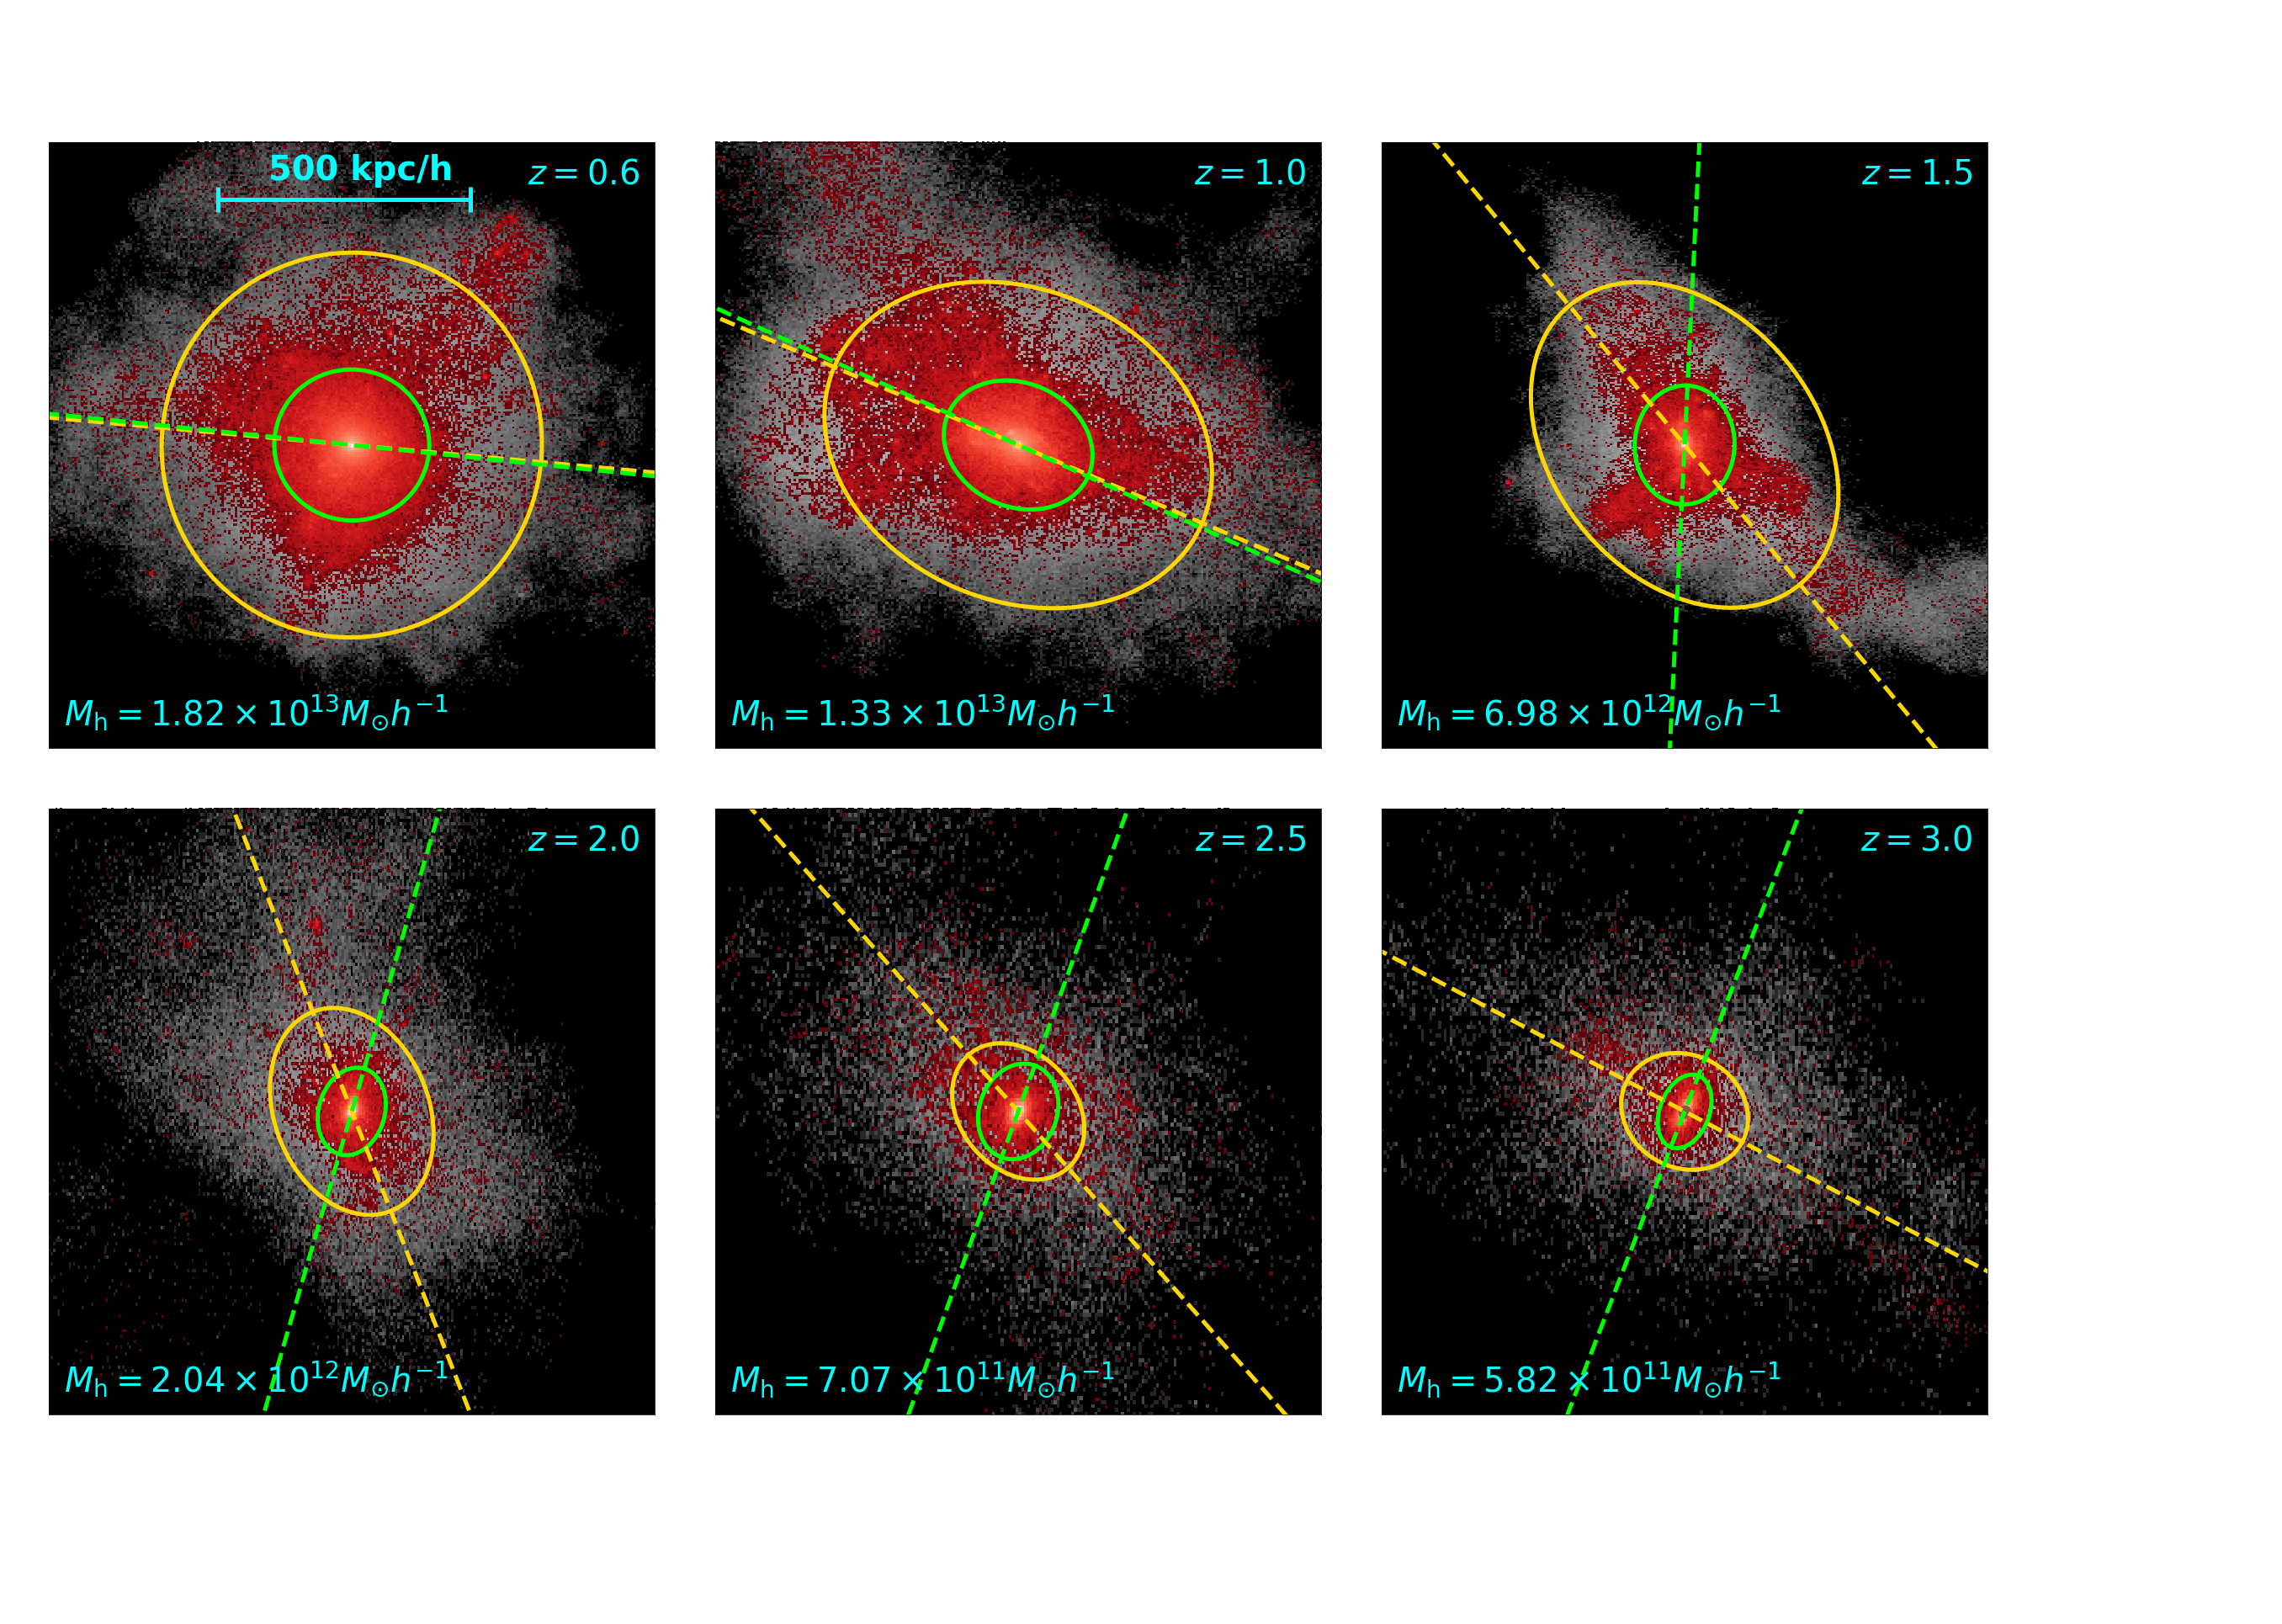
In this subsection, we will investigate how the shapes of galaxies (and dark matter subhaloes), described by axis ratios and , and the misalignments between stellar and dark matter components, evolve with redshift along the merger tree. Figure 4 shows an illustration of the evolution of a single simulated galaxy along the merger tree from to . We can see that the shape of the dark matter component (yellow ellipse) becomes more spherical with decreasing redshift. Furthermore, at , the stellar matter is significantly misaligned with respect to the dark matter, but the alignment becomes stronger as redshift decreases. In the following subsections, we shall show that the foregoing trends persist for the overall distribution of shapes and misalignment angles for the entire set of SAMPLE-TREE galaxies.
3.3.1 Shape
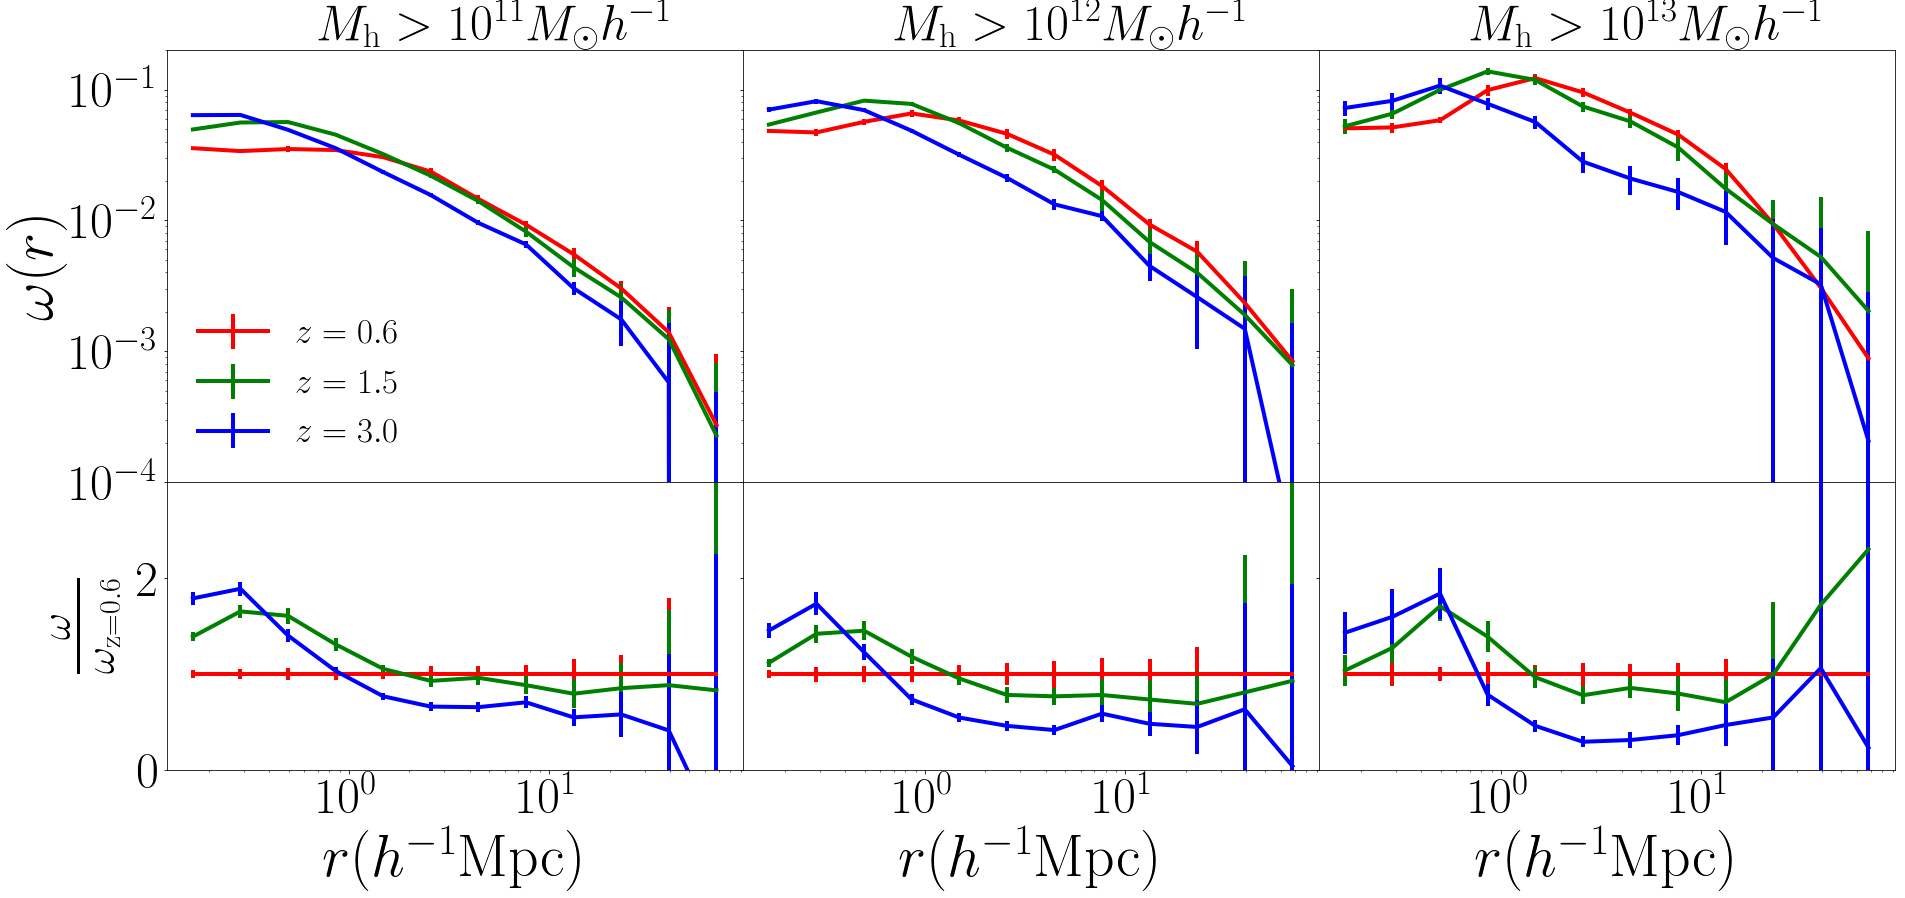
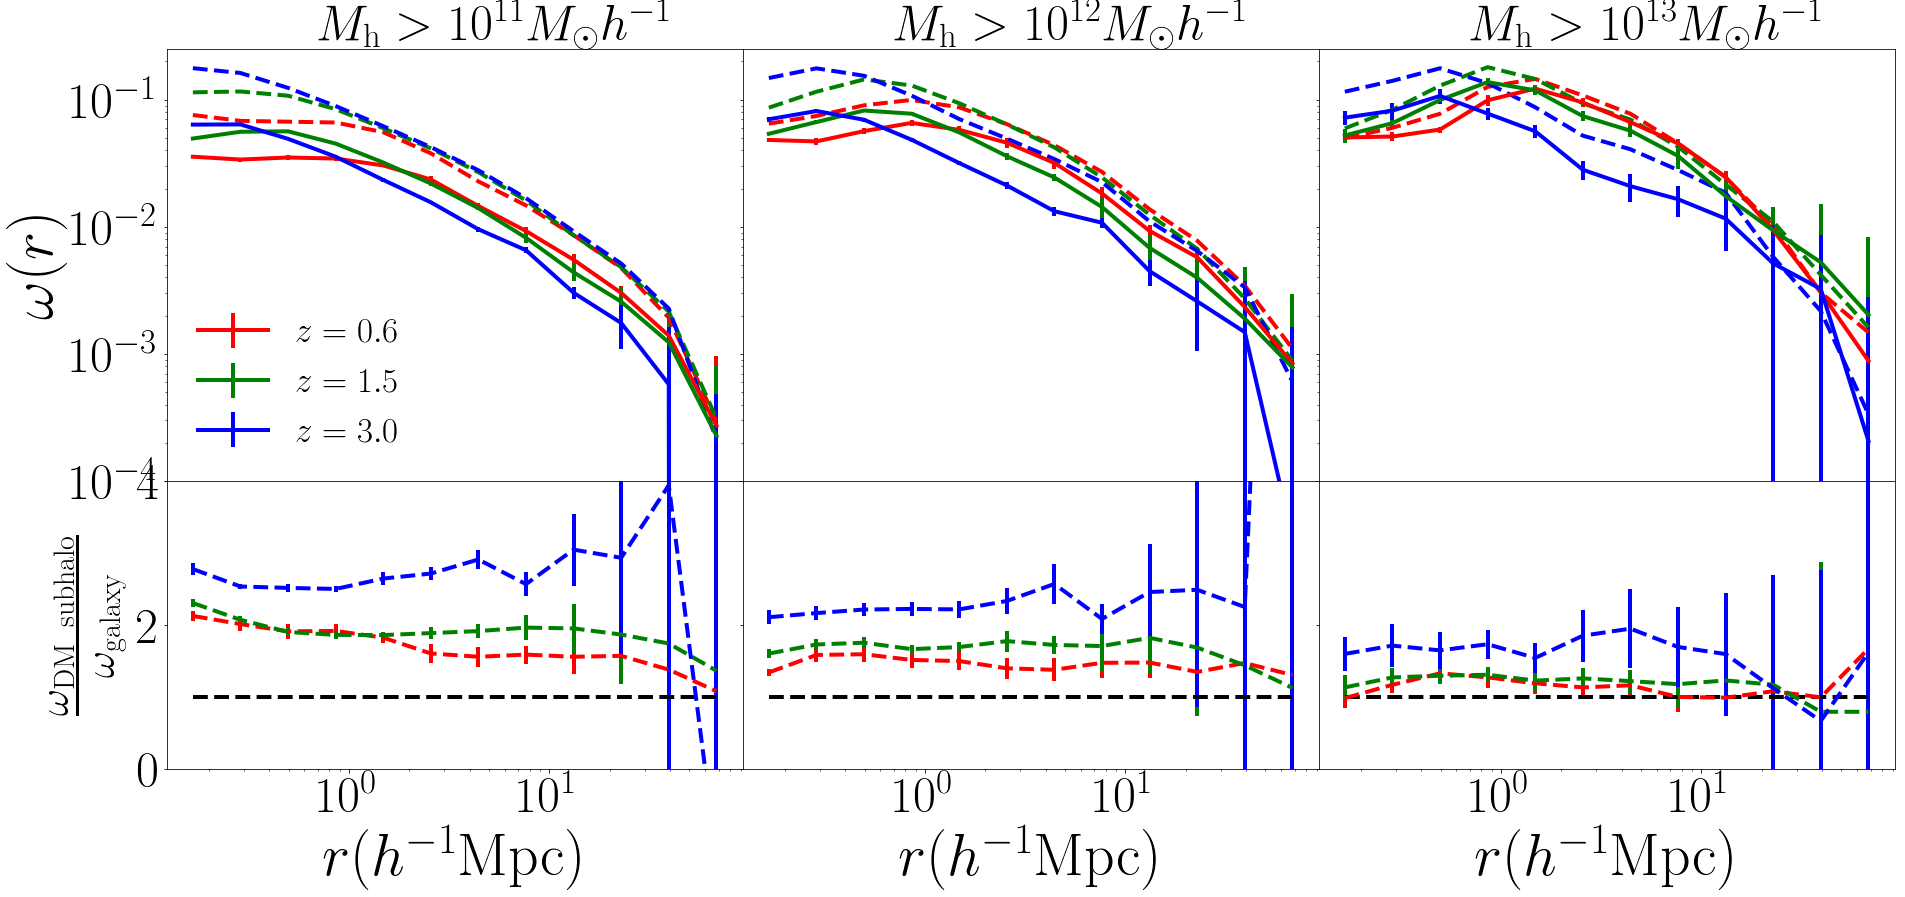
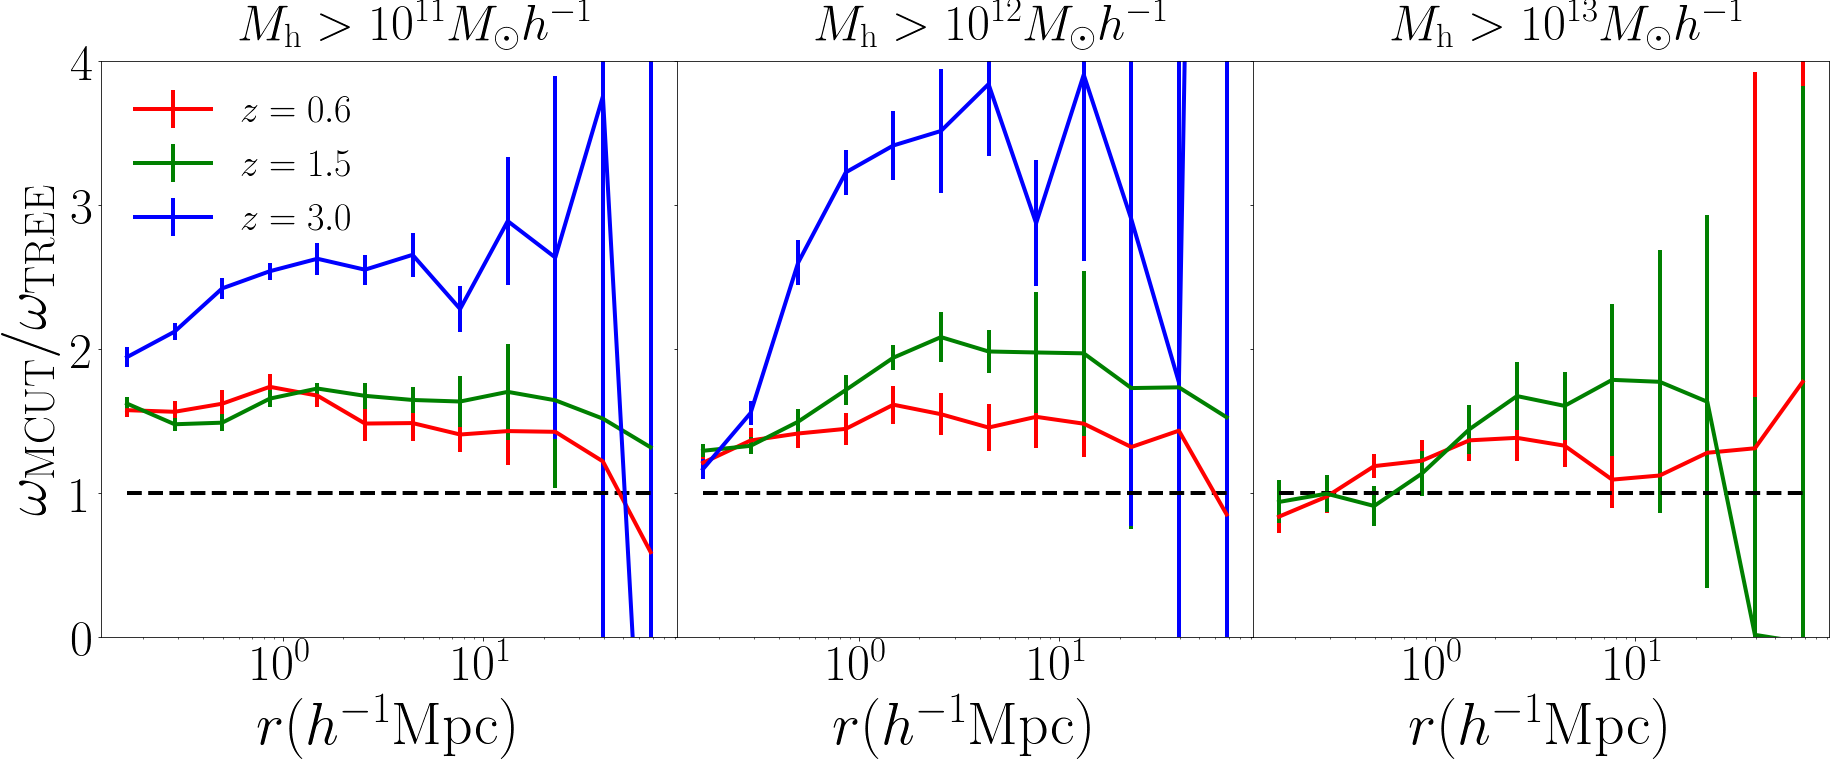
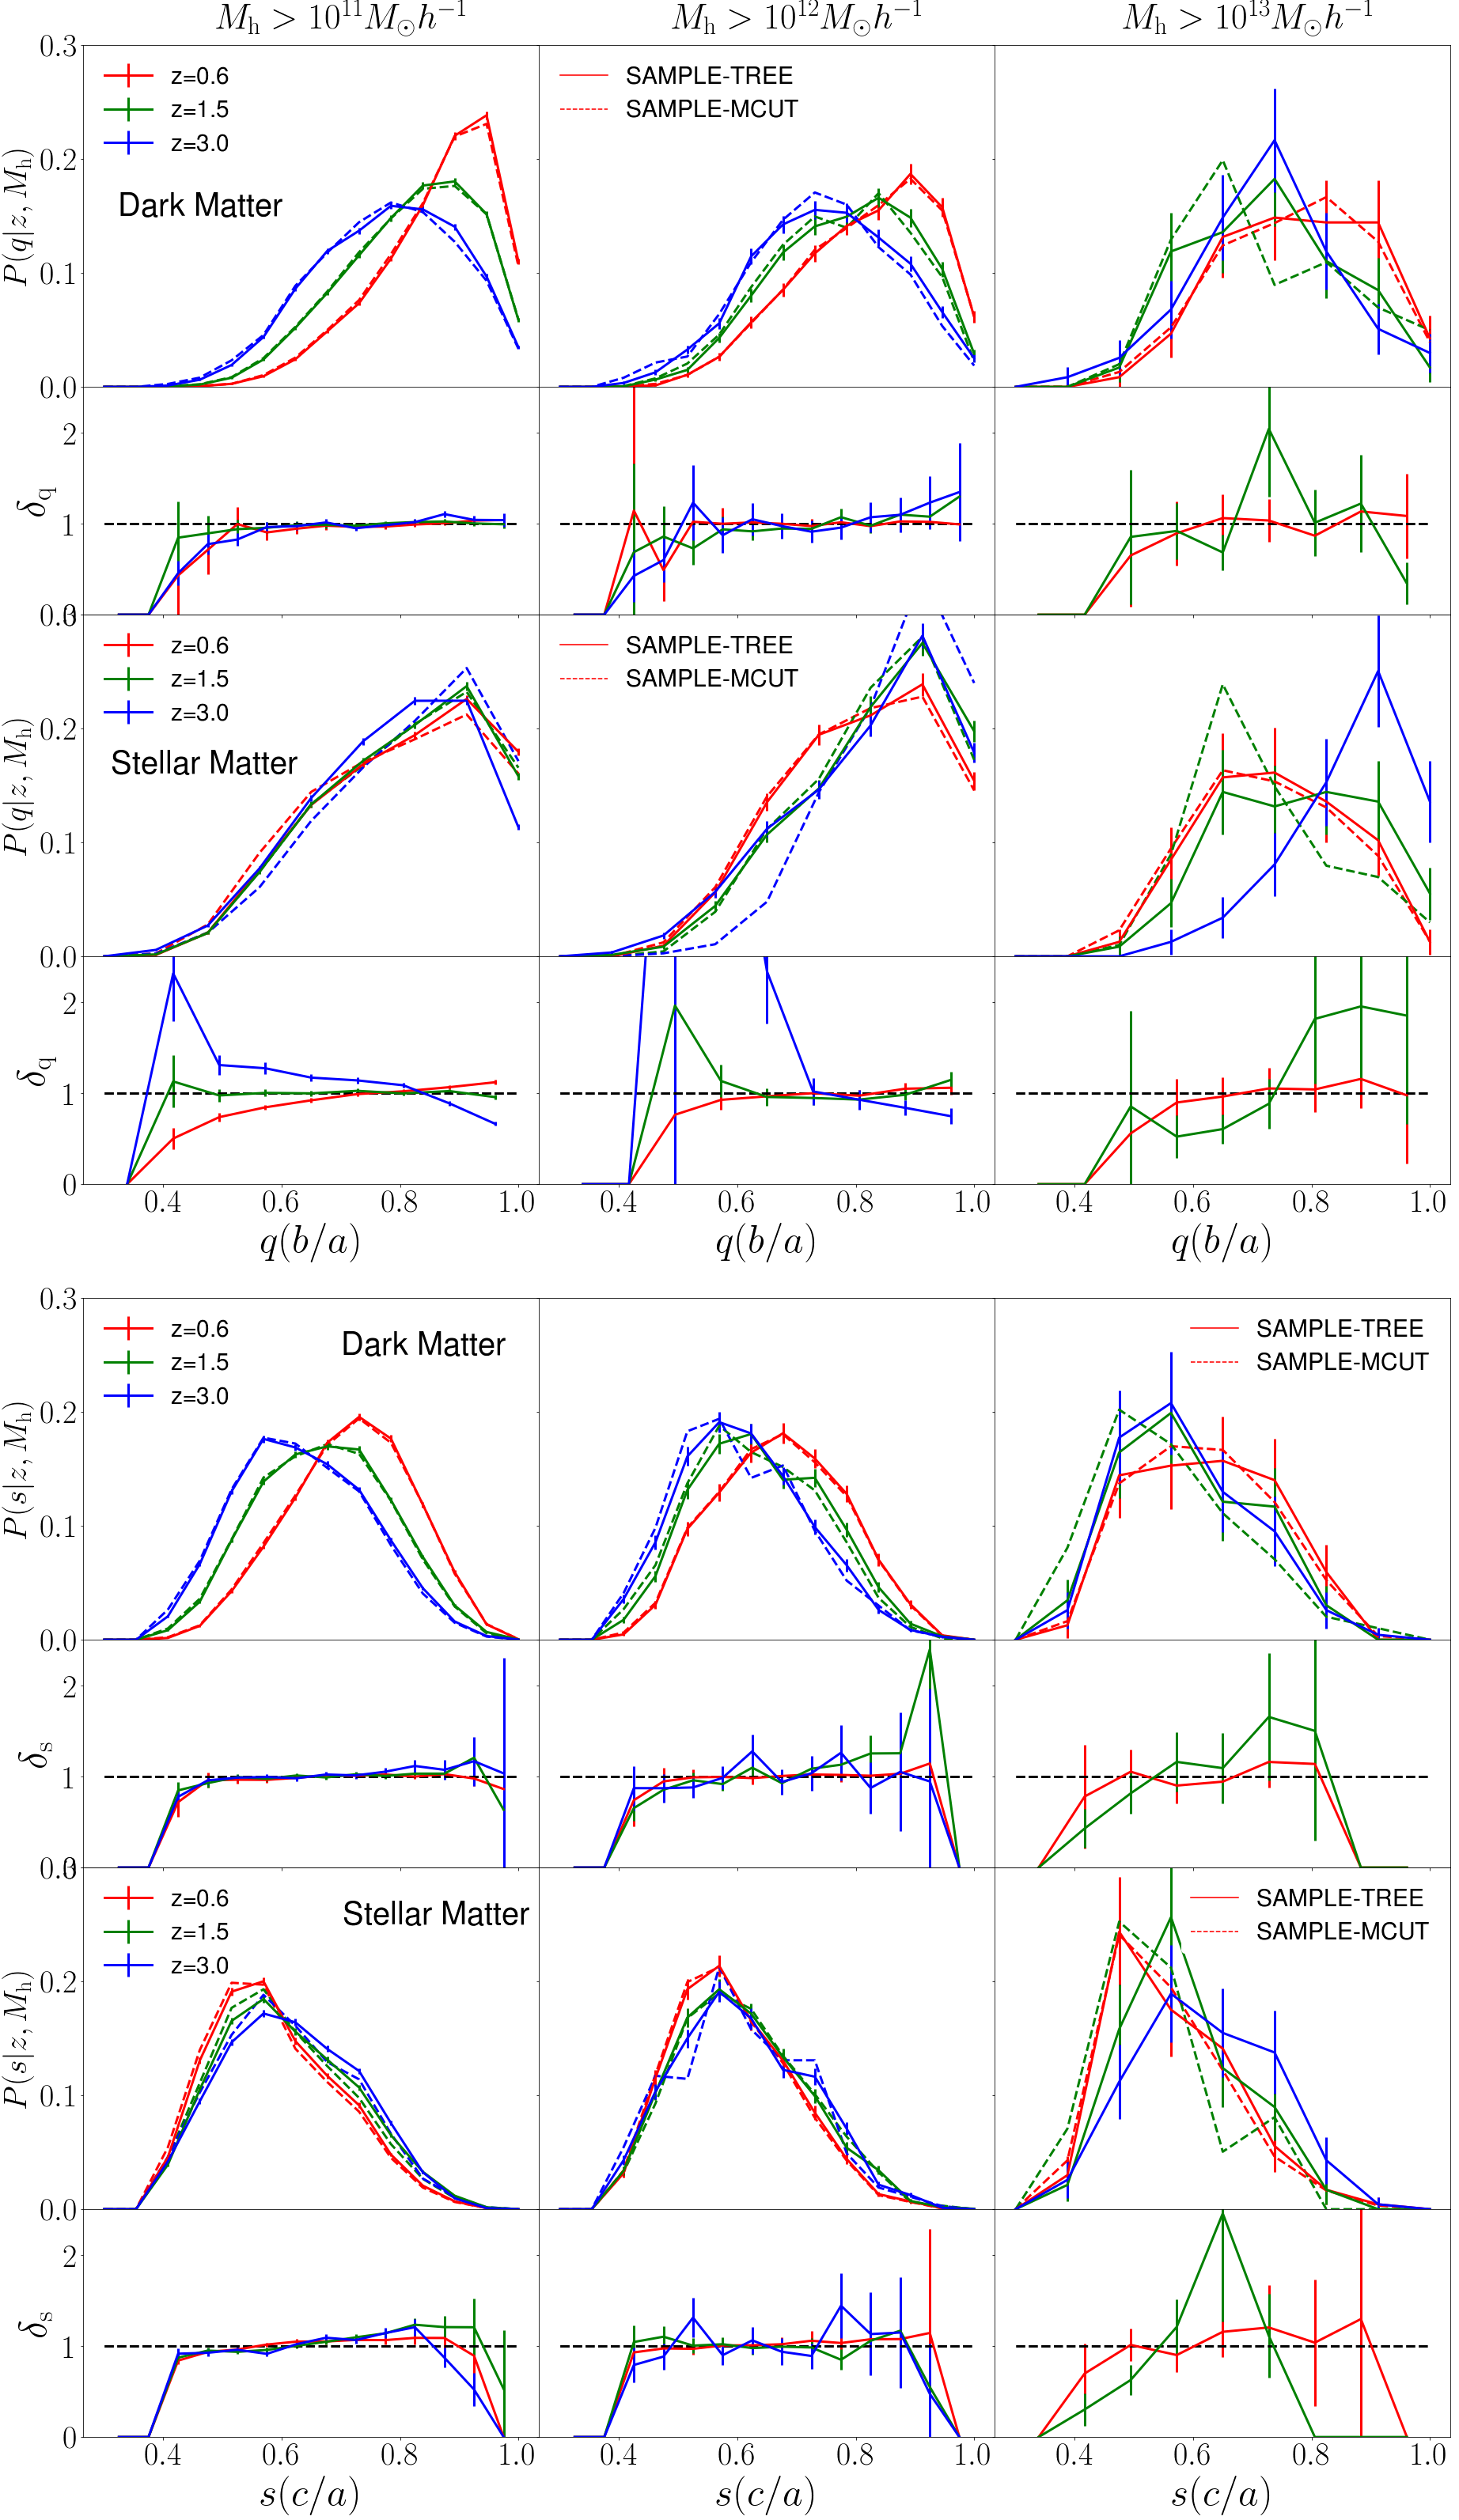
Figure 5 shows the distributions and of axis ratios and respectively. In Section 2.4.1, we established that 300 particles are required to reliably measure the shape; this dictates our choice of minimum subhalo mass threshold of at . The solid and dashed lines correspond to SAMPLE-TREE and SAMPLE-MCUT respectively. The bottom panels show the ratio between the axis ratio distributions of SAMPLE-TREE and SAMPLE-MCUT galaxies.
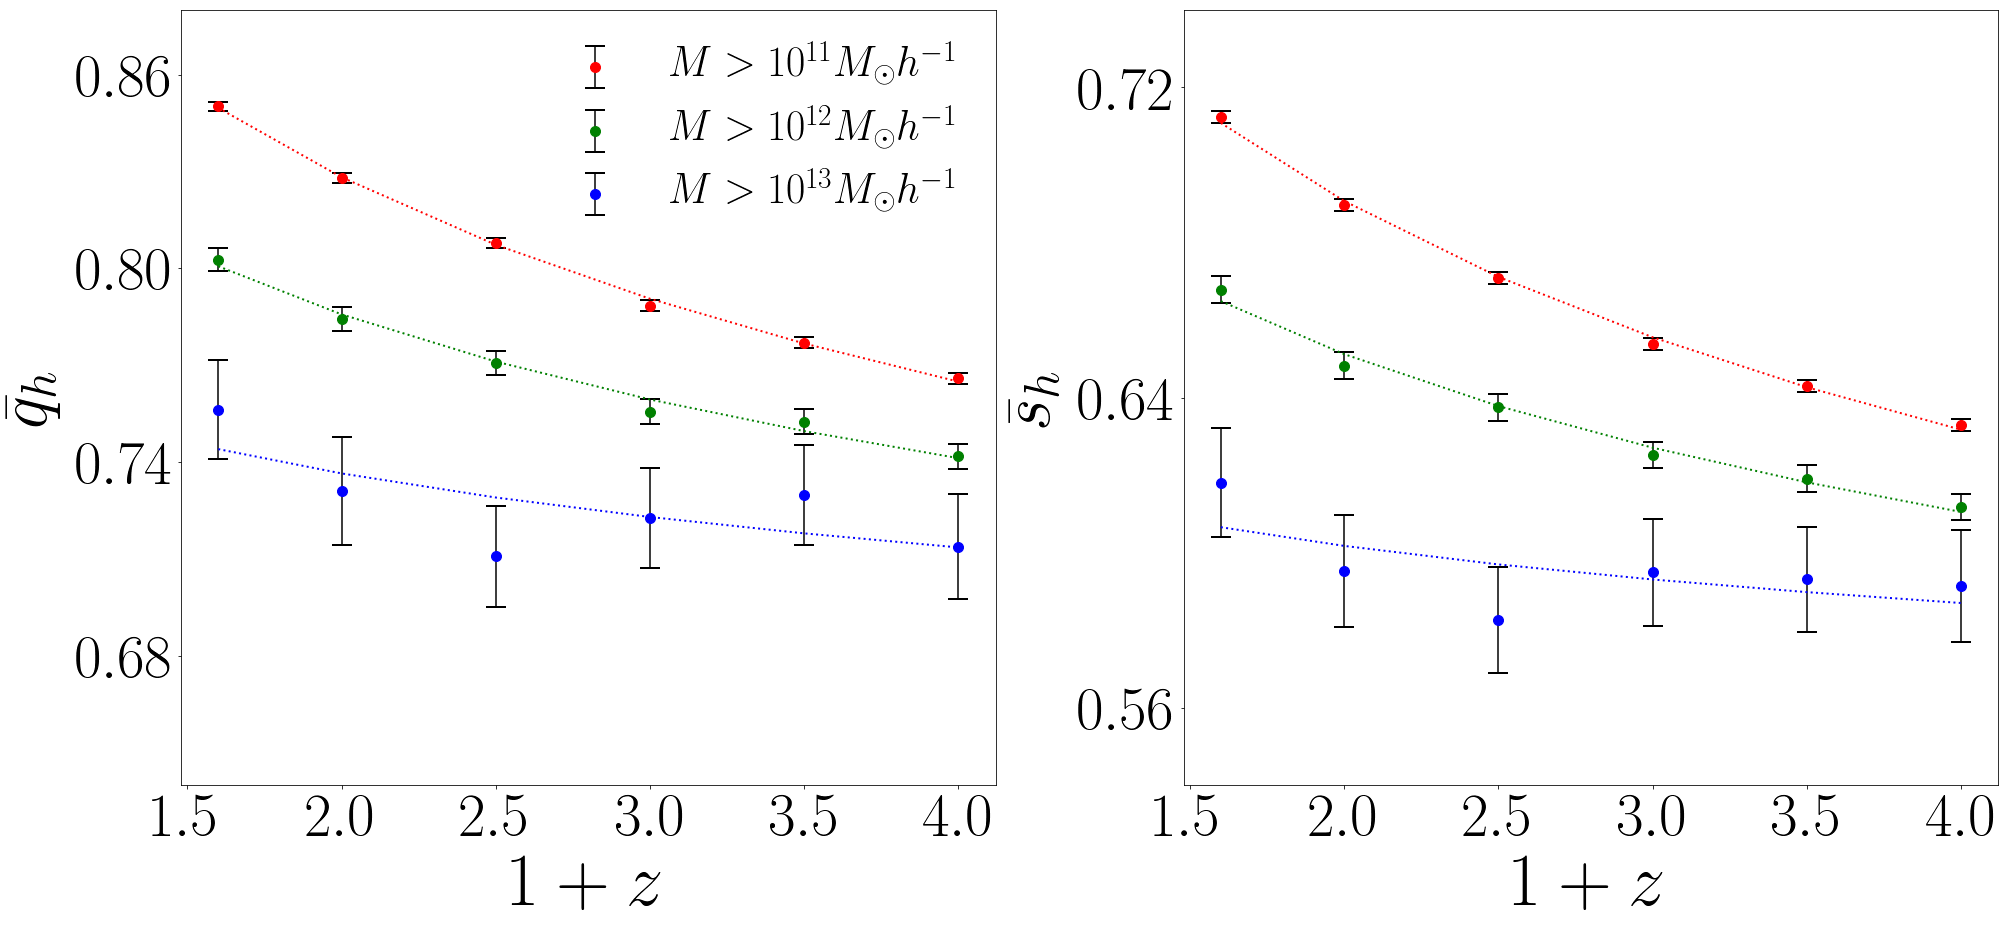
Subhalo mass dependence on the merger tree: We first focus on shapes of dark matter subhaloes. For SAMPLE-TREE galaxies (solid lines), we see that as subhalo mass increases, and (for dark matter) is increasingly skewed towards lower values of and . This is more clearly seen in the mean values of and in Figures B1. This implies that as subhalo mass increases, galaxies on the merger tree become less spherical at fixed redshift. This is also true for SAMPLE-MCUT galaxies (dashed lines) and has been well established in previous studies (Hopkins et al., 2005; Allgood et al., 2006; Tenneti et al., 2015a); therefore it is not surprising that it persists for galaxies on the merger tree.
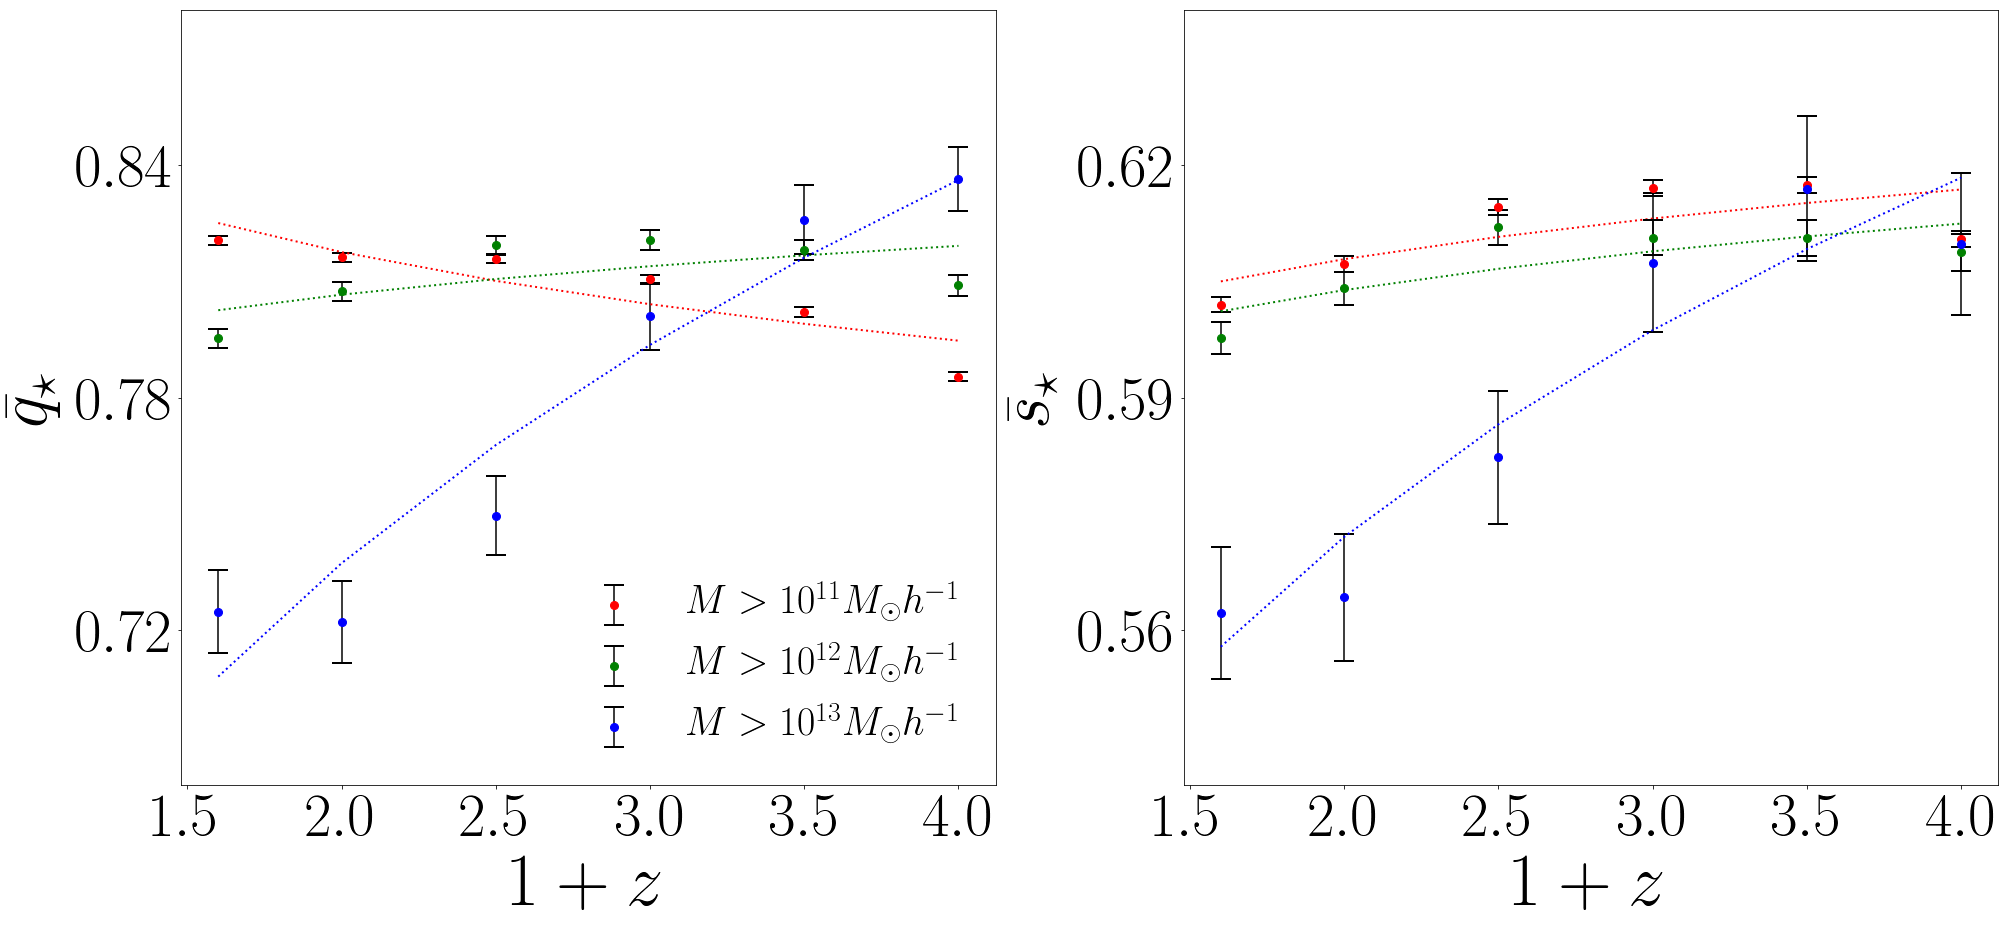
For the shapes of the stellar matter component, the dependence on subhalo mass at is the same as that of the dark matter component for both and , also seen in Tenneti et al. (2015a). In other words, at more massive galaxies have less spherical shapes for the stellar matter component (the mass dependence is seen much more clearly in Figure B2). However, this result does not persist all the way up to . In fact we see that the mass dependence of is reversed (i.e. skews towards higher values with increasing subhalo mass) at while has no significant mass dependence at . Therefore, we find that at , the sphericity of the stellar matter component of galaxies increases with increasing subhalo mass.
To summarize the above trends, we find that:
-
•
The shapes of the dark matter components of galaxies become less spherical with increasing subhalo mass.
-
•
For the stellar matter components, the shapes become less spherical with increasing subhalo mass at . The trend starts to reverse at and by , the shapes become more spherical with increasing subhalo mass.
Redshift evolution on the merger tree: We first focus on the shapes of dark matter subhaloes. For SAMPLE-TREE galaxies (solid lines), we see that for all three panels, as redshift decreases, the peaks of and (for dark matter) shift towards higher values of and . This implies that as redshift decreases, galaxies on the merger tree evolve to become more spherical. This is also true for SAMPLE-MCUT galaxies (dashed lines), as was previously reported in Tenneti et al. (2015a). It also noteworthy that our results are consistent with Hopkins et al. (2005) which investigated the evolution of shapes of cluster sized haloes () in N-body simulations over roughly the same range of redshifts.
The shape evolution of the stellar matter component has significant differences compared to that of dark matter (as already hinted in the discussion on the subhalo mass dependence). For instance, tends towards being less spherical as redshift decreases. This trend is opposite to that of dark matter. However, note also that the overall evolution of is significantly weaker for stellar matter than for dark matter. For , the evolution is more complicated and depends on the subhalo mass threshold. For , there is no significant evolution. On the other hand, for and , the evolution is significant: is less spherical at compared to .
To summarize the above trends, we find that:
-
•
The shapes of the dark matter components of galaxies tend to become more spherical with time.
-
•
The shapes of the stellar matter components of galaxies tend to become less spherical with time, especially for higher mass thresholds.
Comparing SAMPLE-TREE and SAMPLE-MCUT: We now compare the axis ratio distributions between SAMPLE-TREE and SAMPLE-MCUT (see ratio plots in Figure 5).
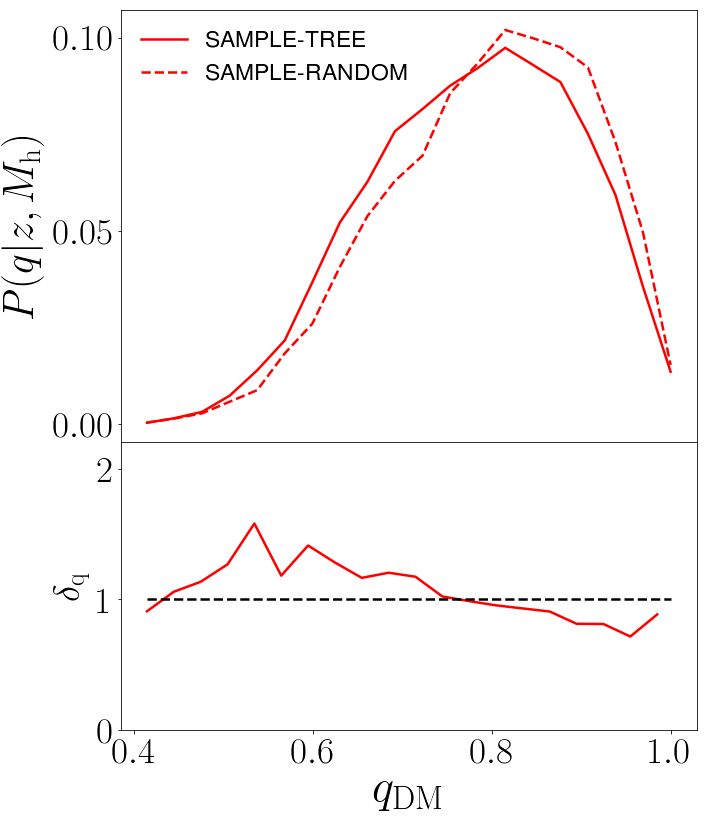
For the dark matter shapes, we find that the axis ratio distributions of SAMPLE-TREE and SAMPLE-MCUT are broadly consistent i.e. there is no statistically significant difference in their shapes given the errorbars. The fact that this is persistent all the way up to is noteworthy because at , SAMPLE-MCUT galaxies are significantly more massive than SAMPLE-TREE galaxies. This suggests that at fixed redshift, the subhalo mass is not the sole parameter that determines the shapes of dark matter component of galaxies. In particular, galaxies that are progenitors of lower redshift galaxies above some mass threshold may be less spherical compared to a randomly chosen set of galaxies of similar subhalo mass. In order to show this explicitly, in Figure 6 we compare the axis ratio distributions (at ) of the dark matter components of SAMPLE-TREE galaxies to that of a random sample (SAMPLE-RANDOM) whose mass functions are modulated to be identical to that of SAMPLE-TREE. We see that the axis ratios for SAMPLE-TREE galaxies are smaller than that of SAMPLE-RANDOM galaxies. This is also true in general for . This solidifies the impression that early galaxies that are progenitors of present-day massive galaxies ( at ) are more elliptical (on an average) than a randomly selected galaxy at similar subhalo mass and redshift.
For the stellar matter shapes, the ratio plots show that at , for samples with mass thresholds of and are less spherical for SAMPLE-TREE galaxies compared to SAMPLE-MCUT galaxies. This is because SAMPLE-MCUT galaxies are more massive compared to SAMPLE-TREE galaxies at (we have already shown that stellar matter shapes are more spherical at higher subhalo masses at ). however has no significant difference between SAMPLE-TREE and SAMPLE-MCUT at despite the difference in subhalo masses. This is simply because there is insignificant mass dependence in for stellar matter at .
The comparison of shapes between SAMPLE-TREE and SAMPLE-MCUT galaxies at can now be summarized as follows:
-
•
For the dark matter components, no difference is found between the shapes of SAMPLE-TREE and SAMPLE-MCUT galaxies at despite the difference in masses. This is because at galaxies that are progenitors of : galaxies are significantly less spherical (on an average) than a randomly selected galaxy of similar subhalo mass and redshift.
-
•
For the stellar matter component, SAMPLE-TREE galaxies are less spherical compared to SAMPLE-MCUT galaxies at . This is because SAMPLE-MCUT galaxies are more massive (which we show to be more spherical for stellar matter component) than SAMPLE-TREE galaxies at .
3.3.2 Misalignment angle
In this section, we investigate how the misalignment angle of galaxies on the tree evolves with redshift.
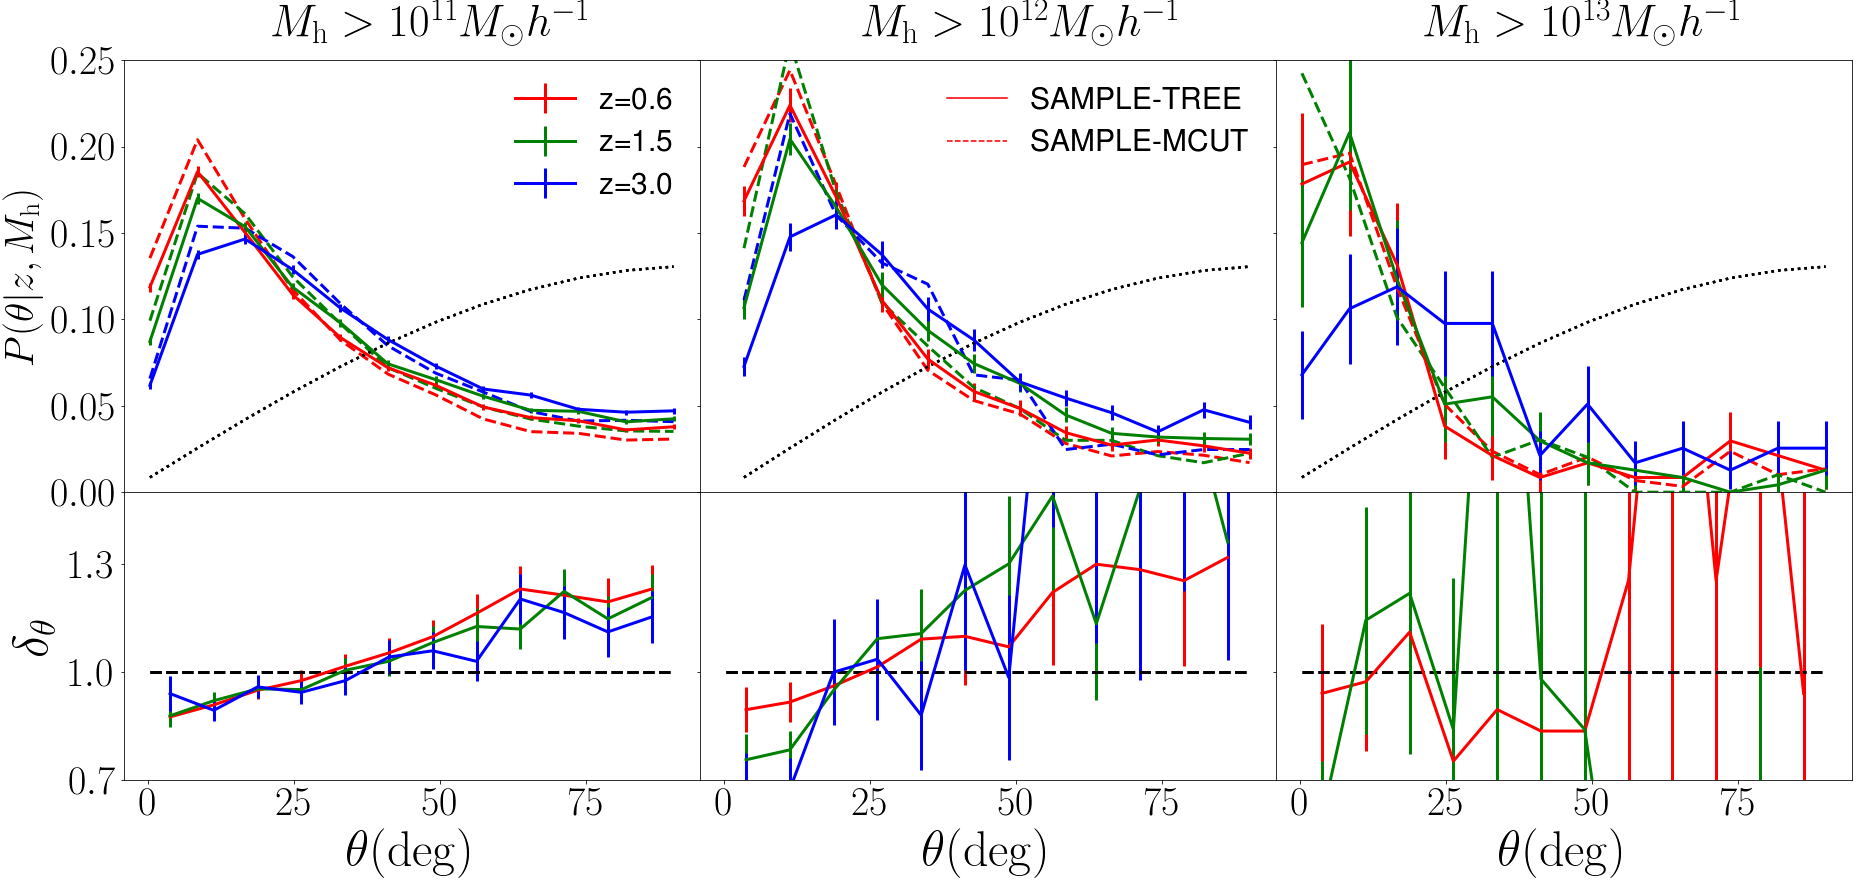
The solid lines in Figure 7 (top panels) show the distribution of misalignment angles () at different redshifts and subhalo mass cuts for SAMPLE-TREE galaxies. The distributions are skewed with a maximum at accompanied by a long tail at , and a sharp fall-off at . At fixed redshift, as the subhalo mass increases, skews towards smaller values of (seen more clearly in Figure B3). This implies that more massive galaxies are more aligned with their subhaloes. skews towards smaller as redshift decreases, implying that galaxies evolve over time to become increasingly aligned with their subhaloes, although the evolution is mild.
The evolution of the misalignment angle can be put in the context of existing IA models. The fact that the evolution is mild suggests that it may possibly be mediated by the evolution of the instantaneous tidal field. This is hinted by the fact that the contribution of the instantaneous tidal field is small (compared to observations), as predicted by the analytical model presented in Camelio & Lombardi (2015). In such a scenario, the redshift evolution, contributed by the instantaneous tidal field, can be thought of as a perturbation to the pre-existing alignment (). Given its strength, the pre-existing alignment is likely set by the primordial (at the formation epoch of these galaxies) tidal field, as assumed in linear alignment models (Catelan et al., 2001; Hirata & Seljak, 2004).
We also compare for SAMPLE-TREE galaxies to the predictions for SAMPLE-MCUT galaxies (solid vs. dashed lines in Figure 7 top panels); Figure 7 (bottom panels) shows the ratio . For , we find that for and for at all redshifts. This implies that SAMPLE-TREE galaxies are less aligned with their subhaloes compared to SAMPLE-MCUT galaxies. At and , one would expect this to be the case as SAMPLE-MCUT galaxies are more massive, and therefore more aligned, than SAMPLE-TREE galaxies. However, we also see the same effect at , where both SAMPLE-MCUT and SAMPLE-TREE galaxies have the same subhalo mass thresholds. This implies that galaxies which formed between (i.e. those that do not have progenitors up to ) are more aligned with their subhaloes than those that formed at .
We have so far discussed the evolution of distributions of galaxy shapes and misalignment angles. In Appendix A, we present the evolution of the average values of the axis ratios and misalignment angles, and provide simple fitting functions to quantify them.
3.4 Ellipticity-direction (ED) Correlation function
In this section, we will investigate how the ellipticity-direction correlation function of galaxies on the merger tree evolves with redshift We now present the results for the ED correlation function . The top panels in Figure 9 show for SAMPLE-TREE galaxies and its redshift evolution along the merger tree. The bottom panels show the ratio . They reveal the evolution of the ED correlation for a wide range of scales to be probed by LSST weak lensing (The LSST Dark Energy Science Collaboration et al., 2018). These include scales where the NLA model and its extensions such as Blazek et al. (2016) already work well. Additionally, our simulations also reveal ED correlations at smaller scales which are not well probed by these analytical models. Accordingly, we choose as an interesting scale around which we shall now describe the evolution of the ED correlation.
At we see that the correlation function is a power law as a function of . The slope of the power law does not vary significantly with redshift or subhalo mass. The power law amplitude increases with subhalo mass at fixed redshift, as also reported in Tenneti et al. (2015a). The ED correlation amplitude increases with decreasing redshift along the merger tree (up to factors of from to ).
At sufficiently small scales (), deviates from a power law and is suppressed (compared to power-law extrapolation from large scales). The extent of the suppression increases with decreasing redshift. As we approach even smaller scales , the redshift evolution is reversed compared to large scales, i.e., decreases with decreasing redshift along the merger tree (up to factors of from to ).
We compare predictions of SAMPLE-TREE to that of SAMPLE-MCUT; Figure 10 shows the ratio between the two as a function of . We find that as redshift increases, for SAMPLE-TREE becomes increasingly suppressed at scales as compared to that of SAMPLE-MCUT; at the suppression is by factors . At , the differences are relatively small (by factors ). These differences are largely because SAMPLE-TREE galaxies are less massive compared to SAMPLE-MCUT galaxies at higher redshifts.
In the following subsections, we shall dig deeper into the foregoing results by first putting them in the context of the galaxy-subhalo misalignments, and then finally revealing the factors that drive the evolution of ED correlations at different scales.
3.4.1 Implications of galaxy-subhalo misalignment on the ED correlation
We now study the implications of galaxy-subhalo misalignment and its evolution on the ED correlation function. To do this, we compare the ED correlations of galaxies (also shown in Figure 9) to their underlying dark matter subhaloes. The top panel of Figure 9 shows the ED correlation functions of SAMPLE-TREE galaxies, where the solid and dashed lines correspond to galaxies and dark matter subhaloes, respectively. As a consequence of the misalignment between stellar matter and dark matter, the solid lines showing the galaxy ED correlation functions are significantly suppressed compared to the subhalo ED correlation functions (by factors ) at all scales. This implies that the alignment of galaxies with respect to the surrounding density field is suppressed as compared to their dark matter subhaloes. This has been established in previous works (Tenneti et al., 2015b), and is also supported observationally in the alignments of luminous red galaxies (Okumura et al., 2009). We now discuss how this suppression evolves with redshift on the merger tree. In the bottom panel of Figure 9, we see that the ratio decreases with decreasing redshift; this is because galaxy-subhalo misalignment decreases with decreasing redshift. Furthermore, the evolution is stronger for haloes as compared to . This is because at , galaxies are more aligned with their subhaloes as compared to galaxies (compare leftmost and rightmost panels of Figure 7).
3.4.2 What drives the evolution of ED correlation at different scales?
Here, we discuss the factors driving the evolution of the galaxy ED correlation at different scales, as inferred from Figure 9. At scales , note that the ED correlations for dark matter subhaloes (dashed lines) undergo a significantly weaker redshift evolution compared to that of galaxies (solid lines). In fact, there is no significant evolution for and subhaloes. Therefore, the fact that we find a significant evolution for the galaxy ED correlation implies that its evolution at scales is primarily driven by the evolution of the galaxy-subhalo misalignment, as opposed to being driven by the ED correlation for dark matter haloes.
At scales , a suppression (compared to a power law) is seen in the ED correlations for both galaxies and their dark matter subhaloes. Furthermore, the suppression in the galaxy ED correlation simply traces that of the dark matter subhalo, but at a lower normalization. Overall, this tells us that the evolution of the ED correlation profile for galaxies at scales is governed by the evolution of both 1) the ED correlation for dark matter haloes, and 2) the misalignment between galaxies and subhaloes. The former leads to a decrease in the ED correlation for galaxies with time, whereas the latter drives an increase in the ED correlation for galaxies. Due to the complex interplay between these two competing effects, no straightforward trend is seen in the evolution of ED correlation at scales (to be targeted by LSST).
At very small scales (), the suppressed ED correlation of DM subhaloes is so large that it dominates compared to the evolution of galaxy subhalo misalignment angle. This competition causes the reversal in the redshift evolution of for galaxies at these scales, compared to that in scales .
4 Conclusions
This work is part of a continued series of papers dedicated to studying the intrinsic alignments (IA) of galaxies using the MassiveBlackII cosmological hydrodynamic simulation. In this work, we study redshift evolution () by selecting galaxy samples (SAMPLE-TREE) based on subhalo mass cuts () at and tracing their progenitors to along a merger tree. We study the redshift evolution of galaxy shapes, misalignment with respect to host subhalo, and the ED correlation functions along the merger tree. Our key findings are as follows:
-
•
The sphericity of the dark matter component of galaxies increases with time, whereas that of the stellar matter component decreases with time.
-
•
The distribution of galaxy-subhalo misalignment angle peaks at 10 deg. With decreasing redshift, the distribution becomes narrower and more skewed towards smaller misalignment angles.
-
•
The evolution of the ellipticity-direction (ED) correlation of galaxies is driven by the evolution of their alignment with respect to their host DM subhaloes, as well as the alignment between DM subhaloes and the surrounding matter overdensity.
-
–
At scales , the alignment between DM subhaloes and the matter overdensity gets suppressed with time. On the other hand, the alignment between galaxies and DM subhaloes is enhanced. Due to these competing tendencies, the redshift evolution of for galaxies at is not straightforward.
-
–
At scales , there is no significant evolution in the alignment between DM subhaloes and the matter overdensity. As a result, the evolution of the galaxy-subhalo misalignment leads to an increase in for galaxies by a factor of 4 from to .
-
–
At scales, evolution in for galaxies is completely reversed compared to that at scales , i.e., it decreases by factors from to . This is because at these scales, the alignment between DM subhaloes and the matter overdensity is strongly suppressed with time, and this effect dominates over evolution of galaxy-subhalo misalignment.
-
–
We also compare our results with the sample selection applied in the previous work of this series (Tenneti et al., 2015a). In particular, we also considered galaxy samples (SAMPLE-MCUT) with fixed subhalo mass cuts (), applied at all redshifts between 0.6 and 3.
Interestingly, upon comparing the sphericities of dark matter components of SAMPLE-TREE and SAMPLE-MCUT galaxies, we find that they do not significantly differ (); this is true even at the highest redshift () where SAMPLE-TREE galaxies are significantly less massive than SAMPLE-MCUT. This is explained by our finding that at , progenitors of : galaxies have significantly less spherical (on an average) dark matter shapes than a randomly selected galaxy of similar subhalo mass and redshift.
For the stellar matter component, we find that SAMPLE-TREE progenitors at are less spherical compared to SAMPLE-MCUT galaxies. This is because SAMPLE-MCUT galaxies are more massive (which we show to be more spherical for stellar matter component) than SAMPLE-TREE galaxies at .
We find that SAMPLE-TREE galaxies are less aligned with their subhaloes compared to SAMPLE-MCUT galaxies. At and , this can be attributed to the differences between their subhalo masses. But the fact that we also see this at further implies that galaxies which formed earlier than (i.e. those that do not have progenitors up to ) are more aligned than those that formed at .
The effect of differences in subhalo masses (at ) of SAMPLE-TREE and SAMPLE-MCUT galaxies, is also seen in their ED correlation function . Compared to SAMPLE-MCUT, for SAMPLE-TREE galaxies is suppressed at increasing redshift (by factors up to at ); this is due to decreasing subhalo masses of progenitors in SAMPLE-TREE at increasing redshift.
This work demonstrates that hydrodynamic simulations such as MBII are indispensible tools to study redshift evolution of galaxy properties such as IA, primarily because of the ability to directly trace progenitors of present-day galaxies by constructing merger trees. This enables us to disentangle true IA evolution from apparent evolution due to sample selection effects, which are inevitable in observations. Future work will involve the use of the results from this study, as well as previous works (Tenneti et al., 2014, 2015a; Tenneti et al., 2016), to construct halo models for IA of galaxies. These models can then be used to construct mock catalogs by populating N-body simulation volumes, and thereby analyse possible systematic biases caused by IA in weak lensing analyses.
Acknowledgements
We thank Yu Feng for providing the data of MB-II simulation snapshots and raw data. This research is supported by the US National Science Foundation under Grant No. 1716131. TDM acknowledge funding from NSF ACI-1614853, NSF AST-1517593, NSF AST-1616168, NASA ATP 80NSSC18K1015 and NASA ATP 17-0123.
References
- Abell et al. (2009) Abell P. A., et al., 2009, Technical report, Lsst science book, version 2.0
- Allgood et al. (2006) Allgood B., Flores R. A., Primack J. R., Kravtsov A. V., Wechsler R. H., Faltenbacher A., Bullock J. S., 2006, MNRAS, 367, 1781
- Bailin & Steinmetz (2005) Bailin J., Steinmetz M., 2005, ApJ, 627, 647
- Behroozi et al. (2012a) Behroozi P. S., Wechsler R. H., Wu H.-Y., 2012a, The Astrophysical Journal, 762, 109
- Behroozi et al. (2012b) Behroozi P. S., Wechsler R. H., Wu H.-Y., Busha M. T., Klypin A. A., Primack J. R., 2012b, The Astrophysical Journal, 763, 18
- Blazek et al. (2015) Blazek J., Vlah Z., Seljak U., 2015, Journal of Cosmology and Astroparticle Physics, 2015, 015
- Blazek et al. (2016) Blazek J., Seljak U., Mandelbaum R., 2016, in van de Weygaert R., Shandarin S., Saar E., Einasto J., eds, IAU Symposium Vol. 308, The Zeldovich Universe: Genesis and Growth of the Cosmic Web. pp 452–455 (arXiv:1504.04412), doi:10.1017/S1743921316010358
- Bridle & King (2007) Bridle S., King L., 2007, New Journal of Physics, 9, 444
- Camelio & Lombardi (2015) Camelio G., Lombardi M., 2015, A&A, 575, A113
- Catelan et al. (2001) Catelan P., Kamionkowski M., Blandford R. D., 2001, MNRAS, 320, L7
- Chisari et al. (2015) Chisari N., et al., 2015, MNRAS, 454, 2736
- Chisari et al. (2017) Chisari N. E., et al., 2017, MNRAS, 472, 1163
- Davis et al. (1985) Davis M., Efstathiou G., Frenk C. S., White S. D., 1985, The Astrophysical Journal, 292, 371
- Dubois et al. (2014) Dubois Y., et al., 2014, MNRAS, 444, 1453
- Hilbert et al. (2017) Hilbert S., Xu D., Schneider P., Springel V., Vogelsberger M., Hernquist L., 2017, MNRAS, 468, 790
- Hirata & Seljak (2004) Hirata C. M., Seljak U., 2004, Physical Review D, 70, 063526
- Hirata et al. (2007) Hirata C. M., Mandelbaum R., Ishak M., Seljak U., Nichol R., Pimbblet K. A., Ross N. P., Wake D., 2007, MNRAS, 381, 1197
- Hopkins et al. (2005) Hopkins P. F., Bahcall N. A., Bode P., 2005, ApJ, 618, 1
- Ivezić et al. (2008) Ivezić Ž., et al., 2008, arXiv e-prints, p. arXiv:0805.2366
- Joachimi et al. (2011) Joachimi B., Mandelbaum R., Abdalla F. B., Bridle S. L., 2011, A&A, 527, A26
- Joachimi et al. (2015) Joachimi B., et al., 2015, Space Science Reviews, 193, 1
- Khandai et al. (2015) Khandai N., Di Matteo T., Croft R., Wilkins S., Feng Y., Tucker E., DeGraf C., Liu M.-S., 2015, Monthly Notices of the Royal Astronomical Society, 450, 1349
- Kiessling et al. (2015) Kiessling A., et al., 2015, Space Science Reviews, 193, 67
- Kirk et al. (2015) Kirk D., et al., 2015, Space Science Reviews, 193, 139
- Komatsu et al. (2011) Komatsu E., collaboration W., et al., 2011, J. Suppl, 192, 645
- Krause et al. (2016) Krause E., Eifler T., Blazek J., 2016, MNRAS, 456, 207
- Laureijs et al. (2011) Laureijs R., et al., 2011, arXiv preprint arXiv:1110.3193
- Leauthaud et al. (2012) Leauthaud A., et al., 2012, ApJ, 744, 159
- Lee et al. (2008) Lee J., Springel V., Pen U.-L., Lemson G., 2008, Monthly Notices of the Royal Astronomical Society, 389, 1266
- Mandelbaum (2018) Mandelbaum R., 2018, ARA&A, 56, 393
- Mandelbaum et al. (2006) Mandelbaum R., Hirata C. M., Ishak M., Seljak U., Brinkmann J., 2006, MNRAS, 367, 611
- Mitchell et al. (2016) Mitchell P. D., Lacey C. G., Baugh C. M., Cole S., 2016, MNRAS, 456, 1459
- Okumura et al. (2009) Okumura T., Jing Y. P., Li C., 2009, ApJ, 694, 214
- Schaye et al. (2015) Schaye J., et al., 2015, MNRAS, 446, 521
- Singh et al. (2015) Singh S., Mandelbaum R., More S., 2015, Monthly Notices of the Royal Astronomical Society, 450, 2195
- Spergel et al. (2015) Spergel D., et al., 2015, arXiv preprint arXiv:1503.03757
- Springel et al. (2001) Springel V., White S. D., Tormen G., Kauffmann G., 2001, Monthly Notices of the Royal Astronomical Society, 328, 726
- Tenneti et al. (2014) Tenneti A., Mandelbaum R., Di Matteo T., Feng Y., Khandai N., 2014, Monthly Notices of the Royal Astronomical Society, 441, 470
- Tenneti et al. (2015a) Tenneti A., Singh S., Mandelbaum R., Matteo T. D., Feng Y., Khandai N., 2015a, Monthly Notices of the Royal Astronomical Society, 448, 3522
- Tenneti et al. (2015b) Tenneti A., Mandelbaum R., Di Matteo T., Kiessling A., Khandai N., 2015b, MNRAS, 453, 469
- Tenneti et al. (2016) Tenneti A., Mandelbaum R., Di Matteo T., 2016, Monthly Notices of the Royal Astronomical Society, 462, 2668
- The LSST Dark Energy Science Collaboration et al. (2018) The LSST Dark Energy Science Collaboration et al., 2018, arXiv e-prints, p. arXiv:1809.01669
- Troxel & Ishak (2015) Troxel M., Ishak M., 2015, Physics Reports, 558, 1
- Velliscig et al. (2015) Velliscig M., et al., 2015, MNRAS, 454, 3328
- Vogelsberger et al. (2014) Vogelsberger M., et al., 2014, Monthly Notices of the Royal Astronomical Society, 444, 1518
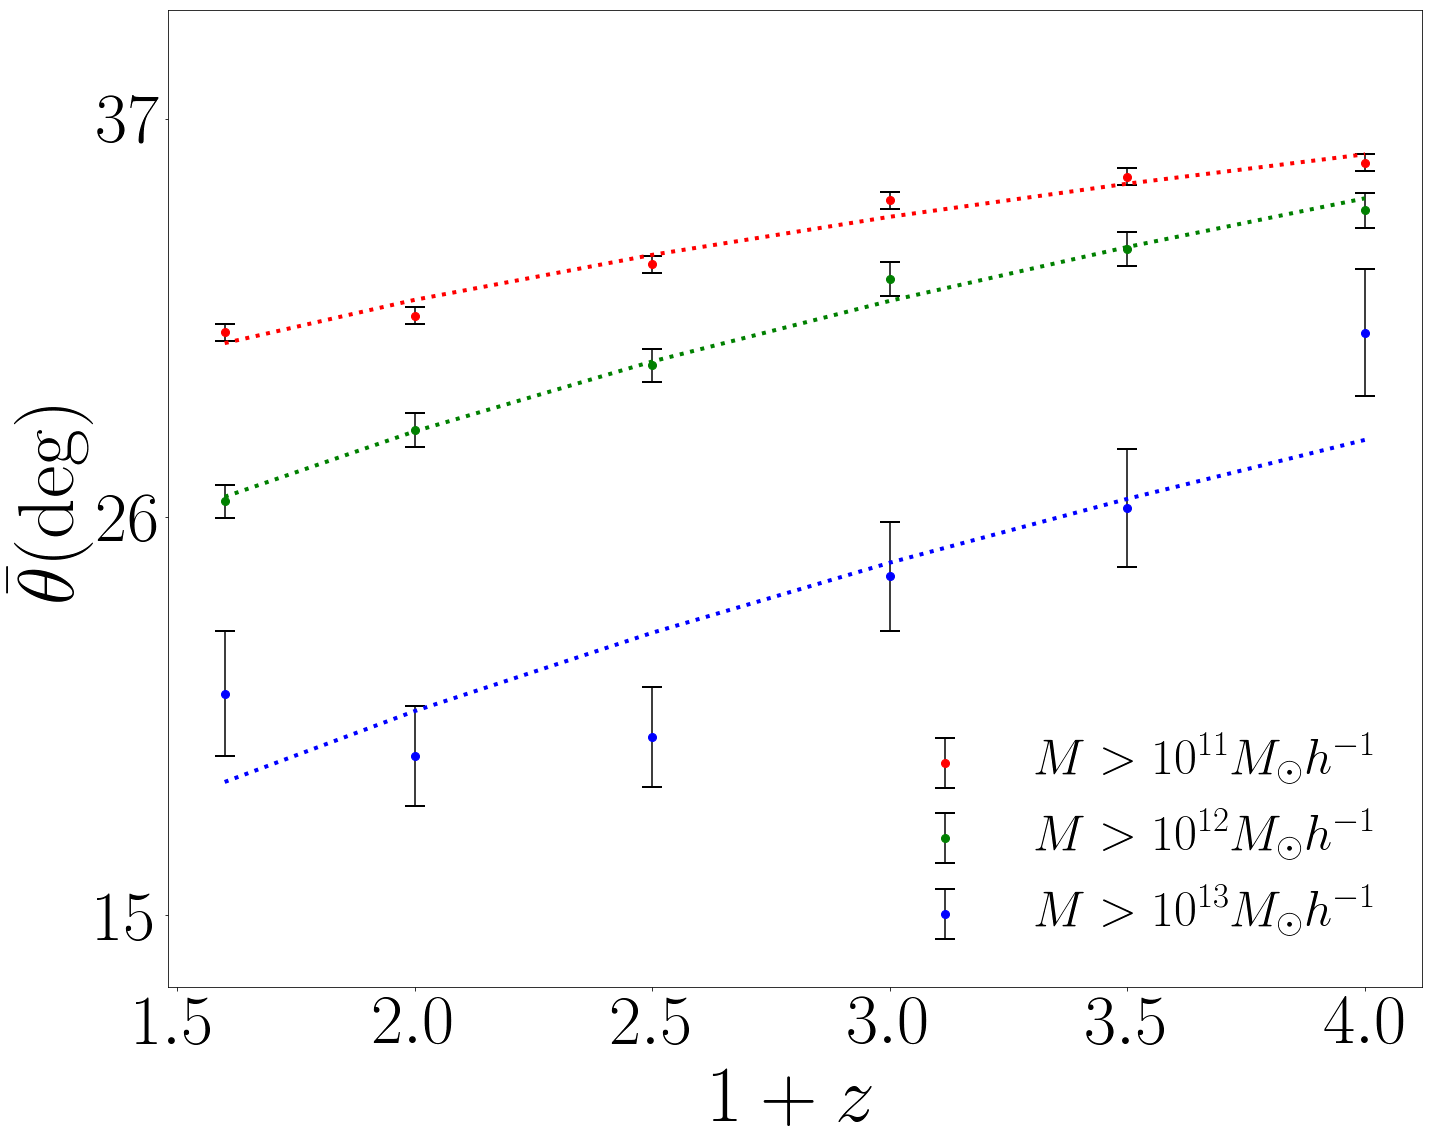
Appendix A Fitting the evolution of shape and misalignment angle
Here we present fitting functions for the evolution of the axis ratios and misalignment angles. We model the redshift evolution as a power-law,
| (5) |
where represent the quantity of interest (axis ratios/ misalignment angle). is the average value of the distribution . is the value of at . The filled circles in figures 11, 12 and 13 correspond to the average of the distributions of axis ratios and misalignment angles. The dashed lines show the best fits obtained using Eq. (5). The corresponding best fit parameters are shown in Table LABEL:table_fits1.
| X | ||
|---|---|---|
| 0.897 | 0.115 | |
| 0.756 | 0.129 | |
| 0.841 | 0.04 | |
| 0.599 | -0.02 | |
| 28.4 | -0.170 |