Ultrathin complex oxide nanomechanical resonators
)
Abstract
Complex oxide thin films and heterostructures exhibit a profusion of exotic phenomena, often resulting from the intricate interplay between film and substrate. Recently it has become possible to isolate epitaxially grown single-crystalline layers of these materials, enabling the study of their properties in the absence of interface effects. In this work, we create ultrathin membranes of strongly correlated materials and demonstrate top-down fabrication of nanomechanical resonators made out of \ceSrTiO3 and \ceSrRuO3. Using laser interferometry, we successfully actuate and measure the motion of the nanodrum resonators. By measuring their temperature-dependent mechanical response, we observe signatures of structural phase transitions in \ceSrTiO3, which affect the strain and mechanical dissipation in the resonators. This approach can be extended to investigate phase transitions in a wide range of materials. Our study demonstrates the feasibility of integrating ultrathin complex oxide membranes for realizing nanoelectromechanical systems on arbitrary substrates.
I Introduction
It is well established that the electronic and magnetic properties of complex oxides are extremely sensitive to mechanical strain due to the strong coupling between the lattice and the charge, spin, and orbital degrees of freedom 1; 2; 3; 4; 5; 6. This sensitivity stems from rotations and distortions of the corner-connected \ceBO6 octahedra (where B is a transition metal ion situated in the centre of the octahedron formed by the oxygen atoms), which determine the overlap between orbitals on adjacent atomic sites 7. The B–O bond lengths and rotation angles are routinely controlled by strain through heteroepitaxy, which forms a powerful tool to tune the properties of ultrathin films. The strong dependence of their electronic properties on mechanical strain has attracted a lot of attention towards their implementation in nanoelectromechanical sensors and actuators 8, but exploiting this trait to the fullest has been limited by the requirement of a substrate for the epitaxial growth. This constrains the possibilities for their mechanical manipulation and integration with electronics and it could not be circumvented until recently, when single-crystal films of complex oxides were successfully released and transferred 9; 10. This sparked a new wave of interest in studying the intrinsic properties of these materials, this time in their isolated, ultrathin form.
On the other hand, a wide variety of mechanical manipulation techniques have been developed for another class of ultrathin materials, the so-called van der Waals materials 11, where weak interlayer bonding enables exfoliation of single- and few-layer films. Their ease of manipulation has enabled the top-down fabrication of a variety of nanomechanical elements, such as suspended membranes and ribbons. This, combined with their flexibility, low mass and remarkable strength, has made them extremely promising candidates for nanomechanical sensing applications 12; 13; 14; 15. Conversely, the well-developed field of nanomechanics has established a solid basis for characterising the thermal and mechanical properties of van der Waals materials 16; 17; 18. In this work, we utilize the fabrication techniques for van der Waals materials to realize ultrathin nanomechanical resonators made out of epitaxially grown single-crystal complex oxide films. We show that these devices can be used to detect signatures of temperature-induced phase transitions in the material, which are related to its intrinsic properties and the configuration and dynamics of structural domains.
II Results
II.1 Sample fabrication and characterisation
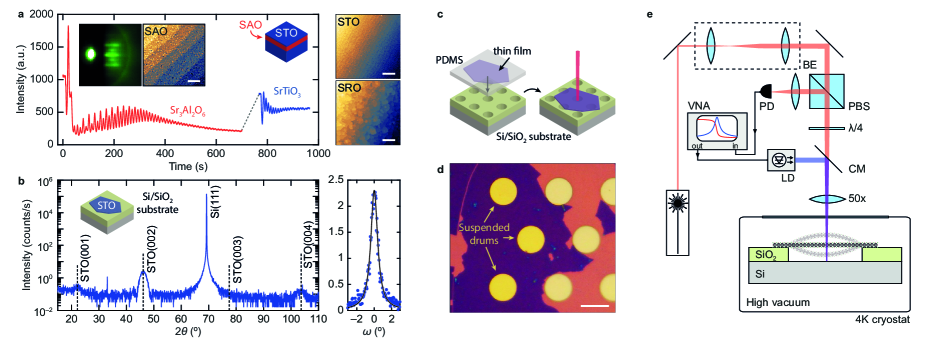
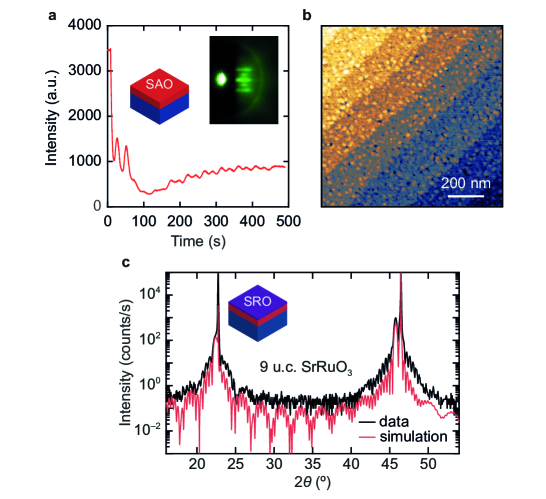
The fabrication of the complex oxide mechanical resonators is described in Fig. 1. To isolate the epitaxial \ceSrTiO3 (STO) and \ceSrRuO3 (SRO) thin films from the substrate, a water-soluble epitaxial \ceSr3Al2O6 (SAO) layer is first deposited by pulsed laser deposition on a \ceTiO2-terminated STO(001) substrate (see Methods). Figure 1a shows the reflection high-energy electron diffraction (RHEED) intensity of the specular spot during the growth of SAO and STO. Oscillations are observed during the growth of both films, indicating that the growth occurs in layer-by-layer mode. An atomic force microscopy (AFM) topographic map shows that the STO surface has a step-and-terrace structure, corroborating the growth mode. SRO grows in step-flow mode, as can be inferred from the atomically flat surface and the absence of RHEED oscillations. An XRD measurement of an STO/SAO/SRO heterostructure is shown in Supplementary Figure 1.
To dissolve the sacrificial layer and release the thin film from the substrate, a polydimethylsiloxane (PDMS) layer is attached to the surface before the entire stack is immersed in deionized water. After the dissolution of the SAO layer (approximately 1 hour for a 5 x 5 mm2 50 nm-thick SAO film, see Supplementary Movie 1), the film can be transferred onto other substrates such as \ceSi/\ceSiO2 using a deterministic dry-transfer technique 19. An X-ray diffraction (XRD) measurement of a 10 u.c. STO flake on a \ceSi/\ceSiO2 substrate is shown in Fig. 1b (left). Laue oscillations are clearly visible, indicating that the films are of excellent crystalline quality after the release and transfer process. Since the film is no longer epitaxial on the substrate, the rocking curve (right) is a measure of the morphology of the STO film lying on the \ceSiO2. The small full width at half maximum () indicates that the film lies very flat on the \ceSi/\ceSiO2 substrate. Here this growth technique is extended by transferring STO and SRO films onto \ceSi/\ceSiO2 substrates pre-patterned with circular cavities, demonstrating the feasibility of creating suspended complex oxides membranes. An optical image of 9 u.c. (thickness: 3.6 nm) thick SRO drums (diameter: m) is shown in Fig. 1d. It is remarkable that these materials, much like their van der Waals counterparts, have the flexibility and tensile strength required to be suspended with aspect ratios exceeding .
II.2 Mechanical characterisation of the nanodrums
We characterise the high-frequency dynamics of the complex oxide nanodrums using the optical actuation and detection setup shown in Fig. 1e. The drums are mounted in the vacuum chamber ( mbar) of a closed-cycle cryostat with optical access. Their motion is read out using a red HeNe laser ( 632.8 nm). The complex oxide membrane and the silicon underneath form a Fabry-Pérot cavity, where the motion of the membrane modulates the intensity of the reflected light, which is measured by a photodiode. The resonators are actuated optothermally, using a blue laser that is coupled into the optical path via a cold mirror 20; 21. Measurements are performed in a homodyne detection scheme using a Vector Network Analyser (VNA), simultaneously sweeping the actuation and detection frequencies.
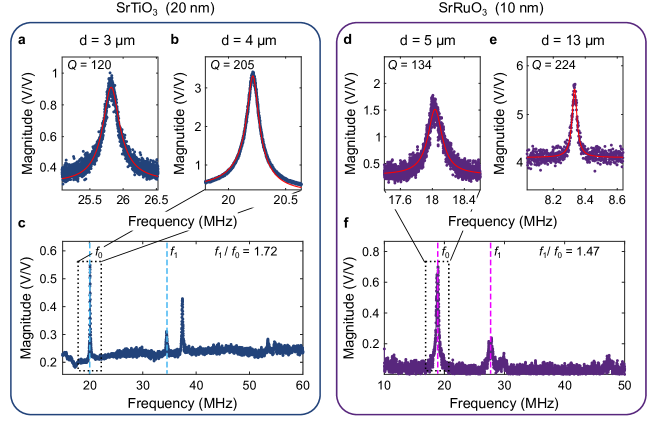
The mechanical resonances of several STO and SRO drums are shown in Fig. 2. Although STO is transparent in the visible range 22, the motion of the drums can still be actuated and measured optically since the refractive index of the STO is different from that of vacuum. Figure 2a-b shows measurements of two STO drums, and Fig. 2d-e of two SRO drums of different diameters. Measurements over a wider frequency range show that higher order resonances of the drums can also be detected; two examples are shown in Fig. 2c,f, where up to four higher order resonances are visible. By taking the ratio of the second harmonic to the fundamental mode, we can estimate whether the mechanical properties are dictated by the pre-tension (theoretical ratio 1.59) or if they are dominantly determined by the bending rigidity (theoretical ratio 2.09), the latter being dependent on the Young’s modulus of the material (). It can be seen from Fig. 2c that the STO drums are in a cross-over regime (ratio 1.72), similar to what has been observed in drums of similar dimensions made of \ceMoS2 21 and \ceTaSe2 23 (an atomic force microscopy nanoindentation measurement of the sample characterised in Fig. 2c is shown in Supplementary Figure 2). On the other hand, the mechanical properties of the SRO drums are almost entirely determined by their pre-tension since , which is close to the theoretical value of 1.59. Statistics on 18 STO drums are shown in Supplementary Figure 3.

II.3 Temperature-dependent mechanical properties
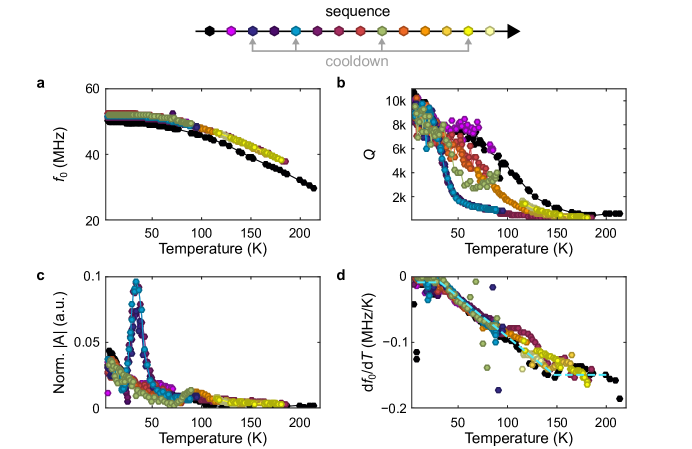
Having confirmed that the resonators can be mechanically characterised at room temperature, we now investigate how their mechanical properties change with temperature. STO is known to undergo a number of phase transitions as a function of temperature, which are expected to influence the mechanical properties of the resonators. Figure 3 shows the temperature dependence of the mechanical properties of an STO nanodrum. The temperature dependence of the resonance frequency (Fig. 3a) shows an evolution which is commonly observed in 2D materials 24; 25; 26. This behavior is usually ascribed to a difference in thermal expansion coefficient between the membrane and the substrate 25; 26, which results in thermally induced tensile stress. Since the resonance frequency is related to the thermal expansion coefficient (), an abrupt change in will noticeably affect . Interestingly, two discontinuities are observed in Fig. 3a: a deviation of below 165 K and a kink in at around 30 K (Fig. 3a, inset). To identify the cause of these discontinuities, it is of interest to compare the temperatures at which they occur to the phase transitions in the bulk material.
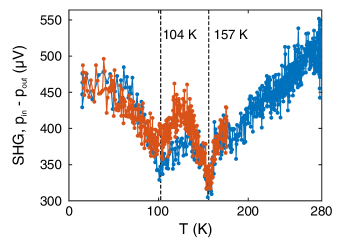
Below 105 K, the cubic structure of bulk STO is known to break up into locally ordered tetragonal domains joined by ferroelastic domain walls 27; 28. Another phase transition occurs at around 30 K, below which the Sr-ions disorder along [111] directions, rendering the structure locally triclinic 29; 30; 31. Both transitions are accompanied by changes in mechanical properties 32; 33; 34; 35; 36, as well as in the thermal expansion coefficient of STO 37 and can therefore be related to the signatures at 165 K and 30 K in Fig. 3a. The difference between the observed elevated transition temperature of 165 K compared to the bulk value of 105 K has been attributed to surface effects 38 and thermally induced strain 39. Additional evidence for an elevated cubic-to-tetragonal transition temperature is found from second harmonic generation measurements that we performed on the layers, which show a feature around 157 K (see Supplementary Figure 4). The fact that the resonance frequency increases with decreasing temperature, despite the decrease of the Young’s modulus of bulk STO below the transition temperature 33; 36 indicates that the mechanical behaviour of the resonator is dominated by tension, rather than bending rigidity 21.
While the phase transitions only lead to relatively small shifts in the resonance frequency (Fig. 3a), they greatly impact the measured mechanical dissipation, as shown in Fig. 3b. To characterise dissipation we use the quality factor of the resonator, which is extracted from the frequency domain measurements as ( is the full width at half maximum of the resonance peak). Whereas is influenced both by the pre-tension of the membrane and the Young’s modulus of the STO, the quality factor is also dependent on the intrinsic losses in the material ( for a complex Young’s modulus 40). In Fig. 3b we show the evolution of the factor for 7 alternating upward and downward temperature sweeps. In the regions below 30 K and above 165 K the data show a continuous temperature dependence. At intermediate temperatures, two distinct branches are observed: a low-dissipation branch, traced out by the red data points (belonging to the first two temperature sweeps, including the measurement from Fig. 3a), and a high-dissipation branch traced out by the blue data points. The light blue points correspond to measurements taken during cooling down and the red and dark blue points are measurements taken during warming up. The overlap between the measurements in both directions implies that there is no correlation between the dissipation state and the direction of the temperature sweep. Besides an upward shift of resonance frequency after the first temperature cycle, in all subsequent measurements the - curves are reproducible with only small variations (1 MHz, see Supplementary Figure 5). This suggests that the effect responsible for the different branches does not influence the mechanical stiffness of the nanodrum and is not correlated to or caused by a change in the resonance frequency. Subsequent measurements (shown in Supplementary Figure 5) indicate that dissipation states in between the red and the blue data points are also accessible, but values of outside of the range defined by the measurements in Fig. 3b were not measured. Similar trends in and as a function of temperature were observed in two other samples (see Supplementary Figure 6).
III Discussion
The trend of decreasing dissipation (increasing ) at lower temperatures is often observed in 2D materials 24; 26; 41 and in microelectromechanical systems in general 42 and is a subject of ongoing discussion. A proposed explanation for this effect is the increased in-plane tension which is known to lower dissipation in nanomechanical structures 43; 40; 23; 44. However, the different dissipation states of the STO drums between 30 and 165 K are, to our knowledge, a phenomenon that has not been observed in other nanomechanical systems. Despite experimental efforts, we have not been able to systematically control the dissipation state which the system exhibits. Even under identical experimental conditions, different dissipation states are observed. Some key observations out of 14 temperature sweeps on the same sample are: i) the low dissipation (high ) state could only be observed after cooling down below 30 K and then warming up; ii) a transition from the low- to the high-dissipation state was observed once at around 85 K, after which the system was locked in the high dissipation branch; iii) the only way to get back to the low dissipation branch was to warm up above 160 K and then cool it down to 5 K.
From these observations it appears that the low-dissipation state is less stable than the high-dissipation state. The appearance of multiple phase states is reminiscent of the behaviour of phase-change materials that can enter crystalline, poly-crystalline or amorphous phases triggered by slight changes in cooldown rate. These phases can have huge variations in electrical resistance as well as in mechanical and optical properties. A potential comparable microscopic candidate for such behaviour in \ceSrTiO3 could be its ferroelastic domain structure, since the motion of the domain walls has previously been linked to mechanical dissipation 31. Nevertheless, to confirm this hypothesis, a simultaneous measurement of the mechanical properties and the domain wall configuration is needed.
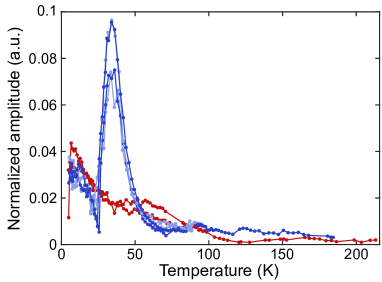
Finally we discuss the measured amplitude at resonance, presented in Fig. 4. The amplitude at resonance decreases with increasing temperature, which can be explained by the significant decrease in the quality factor (observed in Fig. 3b) because in a harmonic oscillator , where is the driving force, is the natural frequency and is the effective mass of the resonator. Interestingly, the measurement points that belong to the high-dissipation branch (blue points in Figures 3b and 4) exhibit a large peak at around 34 K. This is counterintuitive, as one would expect that a lower quality factor should result in a lower amplitude. However, it might be that the driving force is temperature dependent and more than compensates for the decrease in the -factor. If so, this phenomenon cannot be caused by a change in the optical absorption of STO (at nm), which is constant as a function of temperature in the measured range 45. Therefore, it is more likely that the increased driving efficiency is caused by a difference in the thermal properties between the low- and high-dissipation states of the material. In connection to this, it is worth mentioning that a peak in the heat capacitance of bulk \ceSrTiO3 has been previously observed in a similar temperature window 46.
In conclusion, we demonstrated the fabrication of ultrathin mechanical resonators made of epitaxially grown STO and SRO films. Using laser interferometry, we mechanically characterised the nanodrums and showed that they can be used as nanomechanical devices, much like drums made of van der Waals materials 20; 21; 47; 23; 26; 48. We show that phase transitions affect the temperature-dependent dynamics of the resonators and that their mechanical dissipation can shed light on the microscopic loss mechanisms, which are often coupled to electronic and magnetic degrees of freedom. This work connects and presents advances in two fields: (i) the field of complex oxides will benefit from a method for probing the mechanical properties of these strongly correlated electron materials in suspended form; (ii) the field of nanomechanics will now have access to a class of atomically-engineerable materials and heterostructures with exotic properties that can be used as functional elements in NEMS. Such nanomechanical resonators can be used in self-transducing mechanical devices, suspended Bragg reflectors, bimorphic actuators and novel thermomechanical and piezoelectric sensors. Furthermore, by decoupling the high-temperature growth of the materials from the device fabrication flow, these complex oxide NEMS can be easily integrated into fully functional CMOS devices, that cannot tolerate temperatures above 400∘C.
IV Methods
IV.1 Pulsed laser deposition of epitaxial films
SAO, STO, and SRO films were grown by pulsed laser deposition on \ceTiO2-terminated STO(001) substrates. The pulses were supplied by a \ceKrF excimer laser and the substrate was mounted using two clamps and heated by an infrared laser. SAO and STO were deposited using a laser fluence of , a substrate temperature of and an oxygen pressure of . SRO was deposited at , with a fluence of and an oxygen pressure of . The growth occurred in layer-by-layer mode for SAO and STO, while SRO was grown in step-flow mode. After the deposition, the heterostructures were annealed for one hour at in 300 mbar \ceO2, and cooled down in the same atmosphere.
IV.2 Release & transfer
The thin films were released by adhering a PDMS layer to the film surface and immersing the stack in water. Dissolution of a SAO layer was found to take approximately 60 minutes, without stirring or heating the water. After releasing the substrate, the PDMS layer with the thin film was dried using dry \ceN2. The STO and SRO films were transferred onto pre-patterned \ceSi/ \ceSiO2 substrates using an all-dry deterministic transfer technique 19. The crystallinity of the thin films before and after their release was investigated by X-ray diffraction (see Fig. 1b).
IV.3 Mechanical characterization
The mechanical characterisation of the resonators (Figures 2-4) was performed with an active position feedback and variable frequency range, to ensure that the laser spot is always centered and focused on the drum. The resonance peaks are recorded with high accuracy (5000 points per measurement) to rule out any measurement artifacts in the interpretation of the data. In order to eliminate potential artifacts stemming from variations in the adhesion between the membranes and the substrate, the samples are thermally cycled prior to the measurement.
IV.4 Second harmonic generation
The second harmonic generation (SHG) measurement was performed in a reflection geometry to further confirm the presence of the structural transition seen in the mechanical experiments. The sample was excited by a 60 fs laser pulse at a central wavelength of 800 nm from a regenerative Ti:Sapphire amplified laser system operating at a 1 kHz repetition rate. The fluence of the laser radiation used in the experiment was in the order of 10 mJ/cm2. The nonlinear response at the central wavelength of 400 nm was detected using a photomultiplier tube.
Data availability
The data that support the findings of this study are available from the corresponding authors upon reasonable request.
Acknowledgements
The authors thank Pavlo Zubko and Gustau Catalan for the fruitful discussions and extensive feedback. This work was supported by the Netherlands Organisation for Scientific Research (NWO/OCW), as part of the Frontiers of Nanoscience (NanoFront) program, by the Dutch Foundation for Fundamental Research on Matter (FOM), by the European Union Seventh Framework Programme under grant agreement Graphene Flagship, and by the European Research Council under the European Union’s H2020 programme/ERC Grant Agreement No. [677458].
V Author contributions
D.J.G., A.M.V.R.L.M., and A.D. deposited and characterised the epitaxial heterostructures and prepared the suspended films. D.D. and D.J.G. performed the measurements and analysed the data. D.D., D.J.G., A.M.V.R.L.M., H.S.J. v. d. Z., A.D.C. and P.G.S. interpreted the data. D.A. performed the second harmonic generation measurements. Y. H. and E. v. H. synthetized the SAO target for pulsed laser deposition. P.G.S. and A.D.C. supervised the overall project. D.D., D.J.G., A.D.C and P.G.S. wrote the manuscript with input from all authors.
VI Additional information
Supplementary Information is available in the online version of the paper. Reprints and permissions information is available online at www.nature.com/reprints. Correspondence and requests for materials should be addressed to D. D. or D. J. G..
VII Competing financial interests
The authors declare no competing financial interests.
References
- Dagotto (2005) Elbio Dagotto, “Complexity in strongly correlated electronic systems,” Science 309, 257–262 (2005).
- Reyren et al. (2007) N. Reyren, S. Thiel, A. D. Caviglia, L. Fitting Kourkoutis, G. Hammerl, C. Richter, C. W. Schneider, T. Kopp, A.-S. Rüetschi, D. Jaccard, M. Gabay, D. A. Muller, J.-M. Triscone, and J. Mannhart, “Superconducting interfaces between insulating oxides,” Science 317, 1196–1199 (2007).
- Farokhipoor et al. (2014) S Farokhipoor, César Magén, Sriram Venkatesan, Jorge Íñiguez, Christophe JM Daumont, Diego Rubi, E Snoeck, M Mostovoy, Coen De Graaf, Alexander Müller, et al., “Artificial chemical and magnetic structure at the domain walls of an epitaxial oxide,” Nature 515, 379–383 (2014).
- Holsteen et al. (2014) Aaron Holsteen, In Soo Kim, and Lincoln J Lauhon, “Extraordinary dynamic mechanical response of vanadium dioxide nanowires around the insulator to metal phase transition,” Nano letters 14, 1898–1902 (2014).
- Zubko et al. (2016) Pavlo Zubko, Jacek C Wojdeł, Marios Hadjimichael, Stéphanie Fernandez-Pena, Anaïs Sené, Igor Luk’yanchuk, Jean-Marc Triscone, and Jorge Íñiguez, “Negative capacitance in multidomain ferroelectric superlattices,” Nature 534, 524–528 (2016).
- Manca et al. (2017) Nicola Manca, Luca Pellegrino, Teruo Kanki, Warner J Venstra, Giordano Mattoni, Yoshiyuki Higuchi, Hidekazu Tanaka, Andrea D Caviglia, and Daniele Marre, “Selective high-frequency mechanical actuation driven by the vo2 electronic instability,” Advanced Materials 29, 1701618 (2017).
- Rondinelli et al. (2012) James M Rondinelli, Steven J May, and John W Freeland, “Control of octahedral connectivity in perovskite oxide heterostructures: An emerging route to multifunctional materials discovery,” MRS Bulletin 37, 261–270 (2012).
- Bhaskar et al. (2016) Umesh Kumar Bhaskar, Nirupam Banerjee, Amir Abdollahi, Zhe Wang, Darrell G Schlom, Guus Rijnders, and Gustau Catalan, “A flexoelectric microelectromechanical system on silicon,” Nature nanotechnology 11, 263 (2016).
- Paskiewicz et al. (2015) Deborah M Paskiewicz, Rebecca Sichel-Tissot, Evguenia Karapetrova, Liliana Stan, and Dillon D Fong, “Single-crystalline nanomembranes: a platform for flexible oxide electronics,” Nano Letters 16, 534–542 (2015).
- Lu et al. (2016) Di Lu, David J Baek, Seung Sae Hong, Lena F Kourkoutis, Yasuyuki Hikita, Harold Y Hwang, et al., “Synthesis of freestanding single-crystal perovskite films and heterostructures by etching of sacrificial water-soluble layers,” Nat. Mater 15, 1255–1260 (2016).
- Novoselov et al. (2016) KS Novoselov, A Mishchenko, A Carvalho, and AH Castro Neto, “2d materials and van der waals heterostructures,” Science 353, aac9439 (2016).
- Atalaya et al. (2010) Juan Atalaya, Jari M Kinaret, and Andreas Isacsson, “Nanomechanical mass measurement using nonlinear response of a graphene membrane,” EPL (Europhysics Letters) 91, 48001 (2010).
- Koenig et al. (2012) Steven P Koenig, Luda Wang, John Pellegrino, and J Scott Bunch, “Selective molecular sieving through porous graphene,” Nature Nanotechnology 7, 728–732 (2012).
- Smith et al. (2013) A. D. Smith, F. Niklaus, A. Paussa, S. Vaziri, A. C. Fischer, M. Sterner, F. Forsberg, A. Delin, D. Esseni, P. Palestri, M. Östling, and M. C. Lemme, “Electromechanical piezoresistive sensing in suspended graphene membranes,” Nano Letters 13, 3237–3242 (2013).
- Dolleman et al. (2016) Robin J. Dolleman, Dejan Davidovikj, Santiago J. Cartamil-Bueno, Herre S. J. van der Zant, and Peter G. Steeneken, “Graphene squeeze-film pressure sensors,” Nano Letters 16, 568–571 (2016).
- Lee et al. (2008) Changgu Lee, Xiaoding Wei, Jeffrey W. Kysar, and James Hone, “Measurement of the elastic properties and intrinsic strength of monolayer graphene,” Science 321, 385–388 (2008).
- Dolleman et al. (2017) Robin J. Dolleman, Samer Houri, Dejan Davidovikj, Santiago J. Cartamil-Bueno, Yaroslav M. Blanter, Herre S. J. van der Zant, and Peter G. Steeneken, “Optomechanics for thermal characterization of suspended graphene,” Physical Review B 96, 165421 (2017).
- Davidovikj et al. (2017) Dejan Davidovikj, Farbod Alijani, Santiago J Cartamil-Bueno, HSJ Zant, Marco Amabili, and Peter G Steeneken, “Nonlinear dynamic characterization of two-dimensional materials,” Nature Communications 8, 1253 (2017).
- Castellanos-Gomez et al. (2014) Andres Castellanos-Gomez, Michele Buscema, Rianda Molenaar, Vibhor Singh, Laurens Janssen, Herre SJ van der Zant, and Gary A Steele, “Deterministic transfer of two-dimensional materials by all-dry viscoelastic stamping,” 2D Materials 1, 011002 (2014).
- Bunch et al. (2007) J Scott Bunch, Arend M Van Der Zande, Scott S Verbridge, Ian W Frank, David M Tanenbaum, Jeevak M Parpia, Harold G Craighead, and Paul L McEuen, “Electromechanical resonators from graphene sheets,” Science 315, 490–493 (2007).
- Castellanos-Gomez et al. (2013) Andres Castellanos-Gomez, Ronald van Leeuwen, Michele Buscema, Herre S J van der Zant, Gary A Steele, and Warner J Venstra, “Single-layer MoS2 mechanical resonators,” Advanced Materials 25, 6719–6723 (2013).
- Cardona (1965) Manuel Cardona, “Optical properties and band structure of SrTi and BaTi,” Phys. Rev. 140, A651–A655 (1965).
- Cartamil-Bueno et al. (2015) Santiago J Cartamil-Bueno, Peter G Steeneken, Frans D Tichelaar, Efren Navarro-Moratalla, Warner J Venstra, Ronald van Leeuwen, Eugenio Coronado, Herre S J van der Zant, Gary A Steele, and Andres Castellanos-Gomez, “High-quality-factor tantalum oxide nanomechanical resonators by laser oxidation of TaSe2,” Nano Research 8 (2015).
- Chen et al. (2009) Changyao Chen, Sami Rosenblatt, Kirill I Bolotin, William Kalb, Philip Kim, Ioannis Kymissis, Horst L Stormer, Tony F Heinz, and James Hone, “Performance of monolayer graphene nanomechanical resonators with electrical readout,” Nature Nanotechnology 4, 861–867 (2009).
- Singh et al. (2010) Vibhor Singh, Shamashis Sengupta, Hari S Solanki, Rohan Dhall, Adrien Allain, Sajal Dhara, Prita Pant, and Mandar M Deshmukh, “Probing thermal expansion of graphene and modal dispersion at low-temperature usinggraphene nanoelectromechanical systems resonators,” Nanotechnology 21, 165204 (2010).
- Morell et al. (2016) Nicolas Morell, Antoine Reserbat-Plantey, Ioannis Tsioutsios, Kevin G Schädler, François Dubin, Frank HL Koppens, and Adrian Bachtold, “High quality factor mechanical resonators based on WSe2 monolayers,” Nano letters 16, 5102–5108 (2016).
- Lytle (1964) Farrel W Lytle, “X-ray diffractometry of low-temperature phase transformations in strontium titanate,” Journal of Applied Physics 35, 2212–2215 (1964).
- Unoki and Sakudo (1967) Hiromi Unoki and Tunetaro Sakudo, “Electron spin resonance of Fe3+ in SrTiO3 with special reference to the 110 K phase transition,” Journal of the Physical Society of Japan 23, 546–552 (1967).
- Zalar et al. (2005) Bostjan Zalar, Andrija Lebar, Janez Seliger, Robert Blinc, Valentin V. Laguta, and Mitsuru Itoh, “NMR study of disorder in BaTiO3 and SrTiO3,” Phys. Rev. B 71, 064107 (2005).
- Scott et al. (2012) J. F. Scott, E. K. H. Salje, and M. A. Carpenter, “Domain wall damping and elastic softening in : Evidence for polar twin walls,” Phys. Rev. Lett. 109, 187601 (2012).
- Salje et al. (2013) E. K. H. Salje, O. Aktas, M. A. Carpenter, V. V. Laguta, and J. F. Scott, “Domains within domains and walls within walls: Evidence for polar domains in cryogenic ,” Phys. Rev. Lett. 111, 247603 (2013).
- Ledbetter et al. (1990) Hassel Ledbetter, Ming Lei, and Sudook Kim, “Elastic constants, debye temperatures, and electron-phonon parameters of superconducting cuprates and related oxides,” Phase Transitions: A Multinational Journal 23, 61–70 (1990).
- Scott and Ledbetter (1997) JF Scott and H Ledbetter, “Interpretation of elastic anomalies in SrTiO3 at 37 K,” Zeitschrift für Physik B Condensed Matter 104, 635–639 (1997).
- Balashova et al. (1995) EV Balashova, VV Lemanov, R Kunze, G Martin, and M Weihnacht, “Interdigital transducer application for ultrasonic study of SrTiO3 in the quantum paraelectric region,” Solid State Communications 94, 17–20 (1995).
- Ang et al. (1999) Chen Ang, J. F. Scott, Zhi Yu, H. Ledbetter, and J. L. Baptista, “Dielectric and ultrasonic anomalies at 16, 37, and 65 K in ,” Phys. Rev. B 59, 6661–6664 (1999).
- Kityk et al. (2000) AV Kityk, W Schranz, P Sondergeld, D Havlik, EKH Salje, and JF Scott, “Nonlinear elastic behaviour of SrTiO3 crystals in the quantum paraelectric regime,” EPL (Europhysics Letters) 50, 41 (2000).
- Tsunekawa et al. (1984) S Tsunekawa, HFJ Watanabe, and H Takei, “Linear thermal expansion of SrTiO3,” physica status solidi (a) 83, 467–472 (1984).
- Mishina et al. (2000) E. D. Mishina, T. V. Misuryaev, N. E. Sherstyuk, V. V. Lemanov, A. I. Morozov, A. S. Sigov, and Th. Rasing, “Observation of a near-surface structural phase transition in SrTiO3 by optical second harmonic generation,” Phys. Rev. Lett. 85, 3664–3667 (2000).
- Haeni et al. (2004) JH Haeni, P Irvin, W Chang, R Uecker, P Reiche, YL Li, S Choudhury, W Tian, ME Hawley, B Craigo, et al., “Room-temperature ferroelectricity in strained SrTiO3,” Nature 430, 758–761 (2004).
- Unterreithmeier et al. (2010) Quirin P. Unterreithmeier, Thomas Faust, and Jörg P. Kotthaus, “Damping of nanomechanical resonators,” Phys. Rev. Lett. 105, 027205 (2010).
- Will et al. (2017) M. Will, M. Hamer, M. Müller, A. Noury, P. Weber, A. Bachtold, R. V. Gorbachev, C. Stampfer, and J. Güttinger, “High quality factor graphene-based two-dimensional heterostructure mechanical resonator,” Nano Letters 17, 5950–5955 (2017).
- Kim et al. (2008) Bongsang Kim, Matthew A Hopcroft, Rob N Candler, Chandra Mohan Jha, Manu Agarwal, Renata Melamud, Saurabh A Chandorkar, Gary Yama, and Thomas W Kenny, “Temperature dependence of quality factor in MEMS resonators,” Journal of Microelectromechanical systems 17, 755–766 (2008).
- Verbridge et al. (2006) Scott S Verbridge, Jeevak M Parpia, Robert B Reichenbach, Leon M Bellan, and HG Craighead, “High quality factor resonance at room temperature with nanostrings under high tensile stress,” Journal of Applied Physics 99, 124304 (2006).
- Norte et al. (2016) Richard A Norte, Joao P Moura, and Simon Gröblacher, “Mechanical resonators for quantum optomechanics experiments at room temperature,” Physical Review Letters 116, 147202 (2016).
- Kok et al. (2015) Dirk J Kok, Klaus Irmscher, Martin Naumann, Christo Guguschev, Zbigniew Galazka, and Reinhard Uecker, “Temperature-dependent optical absorption of SrTiO3,” physica status solidi (a) 212, 1880–1887 (2015).
- Durán et al. (2008) A Durán, F Morales, L Fuentes, and JM Siqueiros, “Specific heat anomalies at 37, 105 and 455 K in SrTiO3:Pr,” Journal of Physics: Condensed Matter 20, 085219 (2008).
- Wang et al. (2015) Zenghui Wang, Hao Jia, Xuqian Zheng, Rui Yang, Zefang Wang, GJ Ye, XH Chen, Jie Shan, and Philip X-L Feng, “Black phosphorus nanoelectromechanical resonators vibrating at very high frequencies,” Nanoscale 7, 877–884 (2015).
- Cartamil-Bueno et al. (2017) Santiago J Cartamil-Bueno, Matteo Cavalieri, Ruizhi Wang, Samer Houri, Stephan Hofmann, and Herre SJ van der Zant, “Mechanical characterization and cleaning of CVD single-layer h-BN resonators,” npj 2D Materials and Applications 1, 16 (2017).
- Lichtensteiger (2018) Céline Lichtensteiger, “InteractiveXRDFit: a new tool to simulate and fit X-ray diffractograms of oxide thin films and heterostructures,” Journal of Applied Crystallography 51 (2018).
Supporting Information: Ultrathin complex oxide nanomechanical resonators
VII.1 Growth and structural characterisation
Figure 1a shows RHEED oscillations during the growth of a 19 u.c. SAO film on a \ceTiO2-terminated STO(001) substrate. An AFM measurement of the SAO surface is taken directly after the sample is removed from the vacuum chamber (see Fig. 1b). Clear steps and terraces are visible, indicating that the film grows in layer-by-layer mode. An XRD measurement of an SRO/SAO/STO heterostructure is shown in Fig. 1c. The simulation of the diffracted intensity (red line, calculated using InteractiveXRDFit 49) can capture both the peak position and Laue oscillations of the SAO layer and the ultrathin (9 u.c.) SRO film.
A recording of the release of an STO film on PDMS is included as a Supplementary Video.
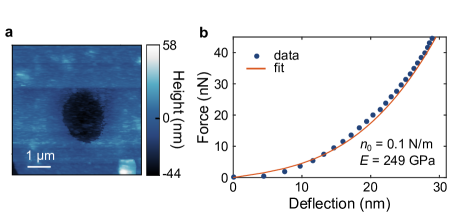
VII.2 Peak-force atomic force microscopy of suspended STO
In Fig. 2 we use peak-force atomic force microscopy (AFM) to extract the pre-tension and the Young’s modulus of the STO drum shown in Fig. 2a. The resonance frequency in the cross-over regime can be approximated as castellanos2013single:
| (1) |
where and . is the Young’s modulus, the initial pre-tension (in N/m), the thickness, and is the diameter. Using the numbers obtained from Fig. 2, we get MHz, similar to the measured value for the same drum (see Fig. 2a).
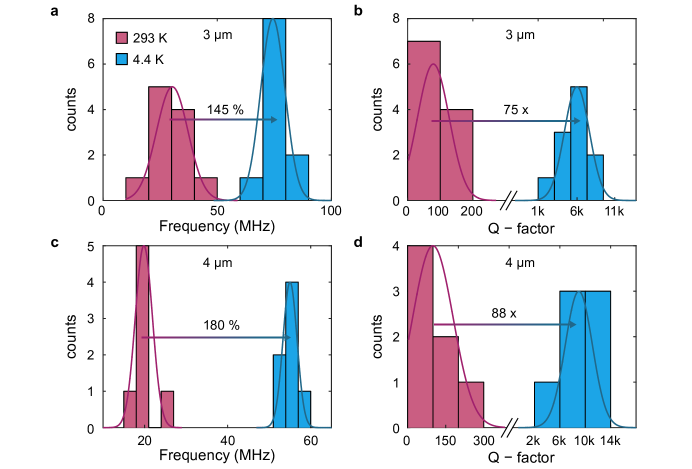
VII.3 Statistics of STO nanodrums
In Fig. 3 we show statistical data of eleven 3-m and seven 4-m drums measured at room temperature and at 4.4 K. In all the drums we see a drastic increase in the quality factor at low temperatures: an average of 75-fold increase in the 3-m drums and 88-fold increase in the 4-m drums. The resonance frequency is affected more strongly in the 4-m drums, which is expected, because for larger drums the pre-tension has a stronger influence on the dynamic behaviour.
VII.4 Second harmonic generation measurement of free-standing STO
Second harmonic generation (SHG) is a nonlinear optical technique based on the conversion of two photons of frequency to a single photon of frequency 2. SHG has been shown to be an efficient method to probe microscopic transformations of the crystal symmetry near structural phase transitions. Both the polarization and the intensity of the SHG light can be observed when the crystal structure changes from between two symmetry groups at the phase transition point.
An SHG measurement was performed on a 20 nm thick STO film transferred on a Si/\ceSiO2 substrate. The measurement area is determined by the laser spot size in the setup, which is estimated to be around 100 m. The polarization of the incoming light wave was controlled using a Glan-Taylor polarizer and a half-wave plate mounted in the rotation stage. The residual SHG signal from the optical components was filtered using a low-pass filter. The polarization of the reflected light was analyzed with a Glan-Taylor polarizer mounted in the rotational stage. The narrow band (10 nm) at the central filter was used to filter out light at the fundamental wavelength of 800 nm. The polarization of the incident light () is the same as the polarization of the recorded SHG signal (). The measurements were taken during cooling down (blue curve in Fig. 4) and during warming up (orange curve in Fig. 4). The measurements show two features, one at 105 K, which corresponds to the transition temperature of bulk STO, and another one at 157 K.
VII.5 Full set of measurements on the STO resonator
Figure 5 shows the full measurement set for the device shown in Fig. 2a, comprising 14 runs. Figure 5d shows the derivative of the resonance frequency with respect to temperature, which is flat below 30 K and shows a change in slope above 150 K (illustrated by the dashed blue line in Fig. 5d).
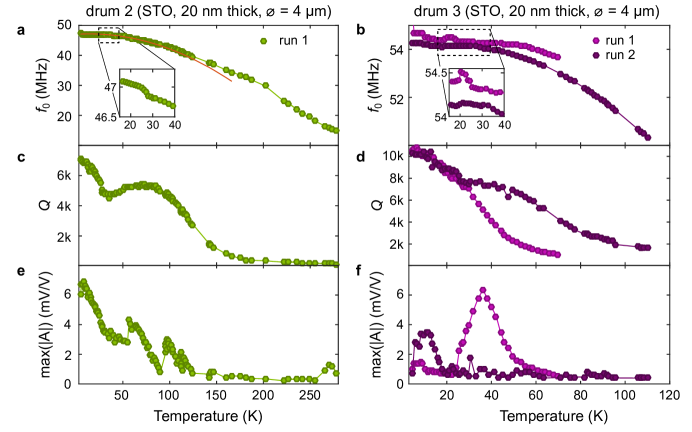
VII.6 Temperature-dependent measurements on additional STO drums
Temperature-dependent measurements were performed on two additional STO drums (20 nm thick, 4 m in diameter), shown in Fig. 6. Drum 2 shows a sudden change of behaviour of the resonance frequency (Fig. 6a), similar to the drum shown in Fig. 3, but at a lower temperature. Both samples show anomalies around 30 K, as shown in the insets of Fig. 6a-b. The -factor of drum 3 also shows two distinct dissipation branches for the two temperature sweeps, plotted in different colours in Fig. 6b,d,f. The low branch is, as in the case for the main device, accompanied by an increase in the vibrational amplitude, as can be seen in Fig. 6f. It is important to point out that the amplitude plotted in Fig. 6e-f is not normalised with respect to the photodiode voltage, so any effects stemming from changes in the optical properties of the material for the wavelength of the measurement laser ( = 632.8 nm) are not compensated in these plots.