Ultraviolet extinction properties of the 30 Dor Nebula
and interpreting observations of starburst clusters **affiliationmark:
Abstract
Recent investigation of the extinction law in 30 Dor and the Tarantula Nebula, at optical and near infrared (NIR) wavelengths, has revealed a ratio of total to selective extinction of about . This indicates a larger fraction of big grains than in the Galactic diffuse interstellar medium (ISM). Possible origins include coalescence of small grains, small grain growth, selective destruction of small grains, and fresh injection of big grains. From a study of the ultraviolet extinction properties of three massive stars in the 30 Dor Nebula (R 139, R 140, R 145), observed with the International Ultraviolet Explorer (IUE), we show that the excess of big grains does not come at the expense of small grains, which are still present and possibly even more abundant. Fresh injection of large grains appears the dominant mechanism. A process able to naturally account for this in environments such as the Tarantula Nebula, where formation of massive stars has been ongoing for over Myr, is the explosion of massive stars as type-II supernovae (SN). The ensuing change in the conditions of the ISM is only temporary, lasting less than Myr, because shattering and shocks will eventually break and destroy the bigger grains. However, this is the only time when star-forming regions are detectable as such in starburst and high-redshift galaxies and we highlight the complexity inherent in interpreting observations of star-forming regions in these environments. If the extinction characteristics are not known properly, any attempts to derive quantitative physical parameters are bound to fail.
Subject headings:
dust, extinction — stars: formation — galaxies: stellar content - galaxies: Magellanic Clouds - galaxies: star clusters — open clusters and associations: individual (30 Dor)1. Introduction
The Tarantula Nebula (30 Dor) in the Large Magellanic Cloud (LMC) is the nearest extragalactic massive star-forming region. Most of the energy in this region is produced by NGC 2070, an OB association containing at its center the Radcliffe 136 (R 136) cluster, the closest example of a massive extragalactic starburst region (Walborn 1991). R 136 is more massive than the supergiant H II region NGC 604 in M 33 (e.g. Drissen et al. 1993; Maiz Apellaniz et al. 2004; Martinez–Galarza et al. 2012) and similar in total mass and energetics to the super star clusters found in more distant irregular galaxies such as NGC 1705 (e.g. Ho & Filippenko 1996; Tosi et al. 2001) and NGC 1569 (e.g. De Marchi et al. 1997; Hunter et al. 2000), or in starburst galaxies such as M 82 (e.g. Gallagher & Smith 1999; Förster Schreiber et al. 2003; Smith et al. 2007). Understanding the physical properties of these objects and of the environments in which they are located is the key to properly interpreting also observations of star formation in high-redshift galaxies (e.g. Vanzella et al. 2017).
A crucial piece of information is a solid characterisation of the extinction properties in these low-metallicity environments. The metallicity of the Tarantula Nebula is , a typical value for the LMC (e.g. Hill et al. 1995; Geha et al. 1998), and corresponds to since (Asplund et al. 2009). Thus, 30 Dor provides an environment with conditions similar to those prevailing at redshift , when star formation in the universe was at its peak (e.g. Lilly et al. 1996; Madau et al. 1996), allowing us at the same time to observe and study individual objects rather than having to resort to their integrated properties. Therefore, a secure determination of the extinction in the Tarantula Nebula is very much needed, both in a local and cosmological context.
Recent independent determinations of the extinction properties in and around 30 Dor (Maiz Apellaniz et al. 2014; De Marchi & Panagia 2014; De Marchi et al. 2016) concur to indicate a value of around . This implies a larger fraction of big grains than in the diffuse Galactic interstellar medium (ISM; e.g. Cardelli et al. 1989), similar to what is seen in star-forming regions in the Milky Way (MW; e.g. Baade & Minkowski 1937; Watson & Costero 2011, and references therein).
A larger fraction of big grains requires a mechanism that either selectively adds big grains, or selectively removes small grains by destroying, growing or co-adding them, or possibly a combination of both. Regardless of the exact mechanism, the selective removal of small grains from the mix will have a direct and measurable effect on the shape of the extinction law at UV wavelengths, resulting in a flatter curve (e.g. Greenberg 1968)
To probe the UV extinction properties inside the 30 Dor Nebula, Fitzpatrick & Savage (1984) studied the spectra of two moderately reddened Wolf–Rayet (WR) stars close to its centre, namely R 145 (of spectral type WN6h+O; Schnurr et al. 2009) and R 147 (of spectral type WN5h; Evans et al. 2011; for details on the spectral type classification of WR stars see, e.g., Crowther 2007). They concluded that the dense nebular environment permeating 30 Dor has a reduced fraction of small grains, compared to the Galactic diffuse ISM, because the extinction law that they derived does not appear to rise as steeply as the Galactic law in the far UV.
Their result is based on the comparison of the spectra of R 145 and R 147 with that of R 144, also a WR object, projected about N of the 30 Dor core and known to be a double-lined spectroscopic binary of spectral type WN5/6h+WN6 (Sana et al. 2013). In the UV, the spectral features of R 144 appear to be compatible with those of R 145 and R 147, leading Fitzpatrick & Savage (1984) to conclude that these objects might have similar spectral types. However, it is known that the spectral energy distribution of WR stars at optical and NIR wavelength is severely affected (flattened) by stellar winds, and current models are not able to account for the observed differences (e.g. Bonanos et al. 2009). Therefore, spectral similarities in the UV do not necessarily extend to longer wavelengths, and in particular they do not guarantee that the continuum is similar, thus making it difficult to anchor the UV extinction properties to those in the optical domain and to derive an internally consistent extinction law.
Instead, armed with the knowledge of a robust optical extinction law now available for the 30 Dor region from hundreds of red giant stars (De Marchi & Panagia 2014; De Marchi et al. 2016), we have re-analised the UV spectra of both lightly and moderately reddened stars of type O and WR in 30 Dor and compared them with atmosphere models following the “extinction without standards” technique pioneered by Fitzpatrick & Massa (2005; see also Whiteoak 1966). We show that to explain the observed UV extinction properties inside 30 Dor there is no need to invoke a depletion of small grains. Rather, the main difference with respect to the Galactic diffuse ISM is the presence of a roughly twice as large relative fraction of big grains and a larger fraction of small grains too.
The structure of the paper is as follows. In Section 2 we briefly discuss the spectroscopic data and their analysis. Section 3 is devoted to the comparison between observations and atmosphere models, while in Section 4 we address the properties of the derived extinction curve. The discussion and conclusions follow in Sections 5 and 6, respectively.
2. Spectroscopic data
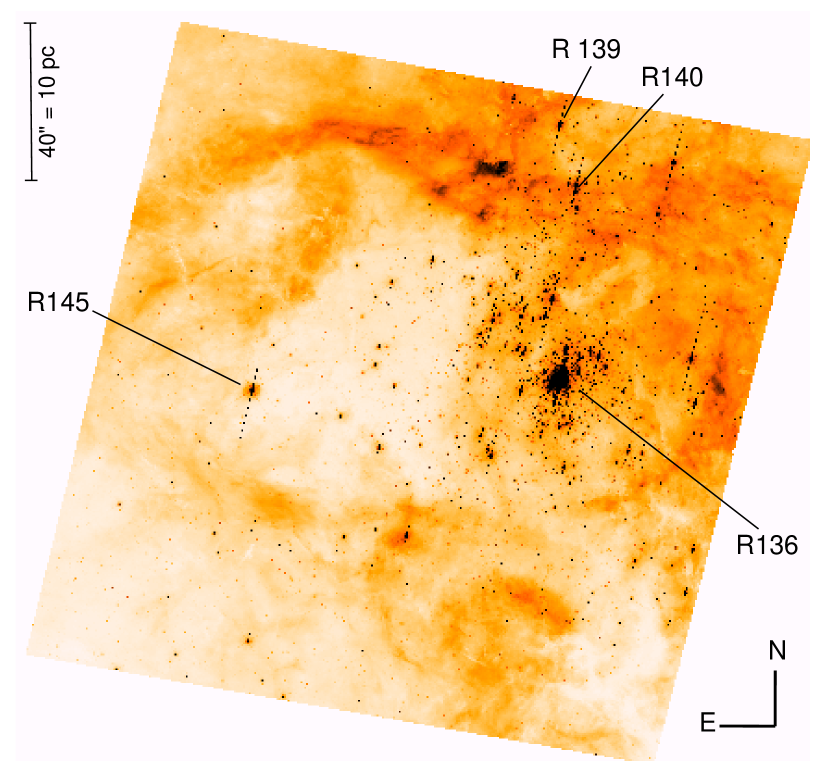
This paper concentrates on the central around the R 136 cluster (see Figure 1). The extinction of this region has been studied in detail with recent high spatial resolution Hubble Space Telescope (HST) multiband photometry in the m wavelength range (De Marchi et al. 2011; De Marchi, Panagia & Beccari 2017). Within this region there are three massive stars whose UV spectra have been obtained with the International Ultraviolet Explorer (IUE), namely R 139, R 140, and R 145. Also the central R 136 object itself has been observed with the IUE, but we do not consider it here because multiple massive stars are known to contribute to the light captured by the IUE spectroscopic aperture used in the observations (e.g. Weigelt & Baier 1985; De Marchi et al. 1993). In a future work, we will extend this investigation to other UV spectroscopic observations in the wider region covered by the Hubble Tarantula Treasury Project (Sabbi et al. 2013, 2016), within which we have already measured the extinction properties at optical and NIR wavelengths (De Marchi et al. 2016).
| Star | Spectral Type | Observation ID | ||
|---|---|---|---|---|
| (1) | (2) | (3) | (4) | (5) |
| R 129 | ONIa+ | SWP 5064 | LWR 4397 | |
| R 139 | O Iafc+O6 Iaf | SWP 10752 | LWR 9433 | |
| R 140 | WN7+WC4/5pec | SWP 10700 | LWR 13389 | |
| R 145 | WN7 | SWP 14005 | LWR 10646 | |
Note. — Table columns are as follows: (1) star name; (2) spectral type; (3) short-wavelength channel spectrum; (4) long-wavelength channel spectrum; (5) derived value of .
R 139 is a binary system, in which the primary is classified as an O Iafc supergiant, while the secondary is an O6 Iaf supergiant (Taylor et al. 2011). It is the primary source in this investigation.
R 140 is a WR system with multiple components, classified as WN6+WC by Conti (1982) and as WN7+WC4/5pec by Phillips (1982).
R 145 was classified as WN6 by Phillips (1982) and by Conti, Leep & Perry (1983) and later as WN7 by Moffat (1989), who also identified it as a binary system. More recently Schnurr et al. (2009) derived the orbital solution and classified it as WN6h+O.
A fourth massive star included in our analysis, for comparison, is R 129. This blue supergiant was classified as ONIa+ by Walborn (1977) and it is located just outside of the Tarantula Nebula, to the NNW of R 136 at a projected distance of pc (or ).
Table 1 lists the IUE observations that we analyse in this work. We extracted the calibrated low resolution version of the spectra from the IUE archive at the Mikulski Archive for Space Telescopes. To avoid the large photometric uncertainties associated with data collected through the IUE “small” aperture, we restricted our analysis to spectra secured through the “large” aperture. The spectral resolution of these low-dispersion spectra is about Å.
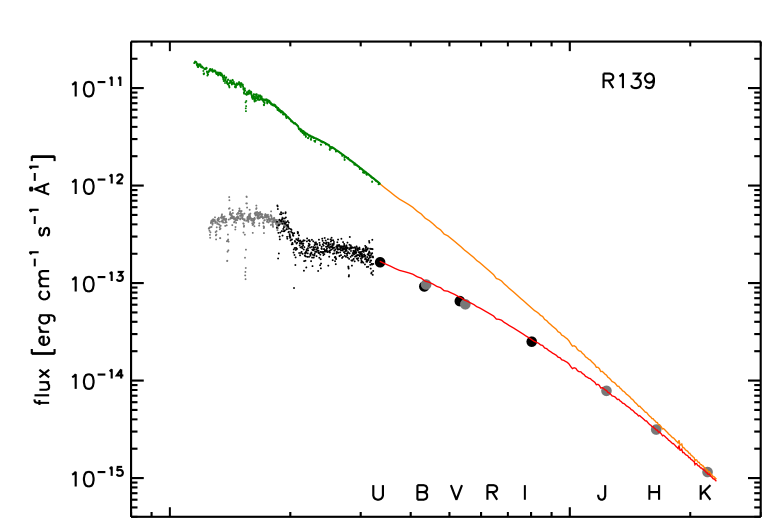
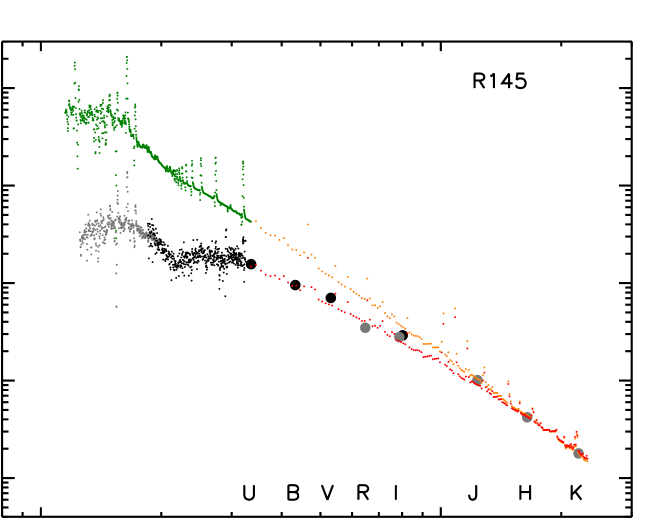
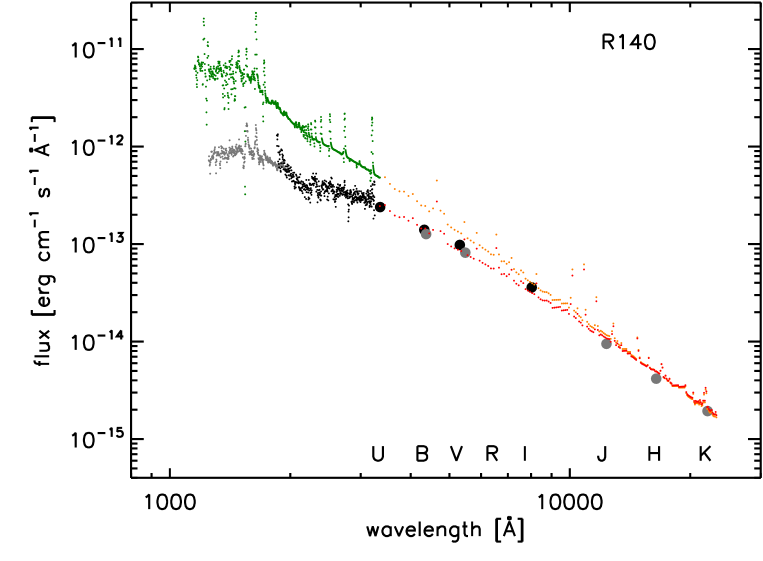
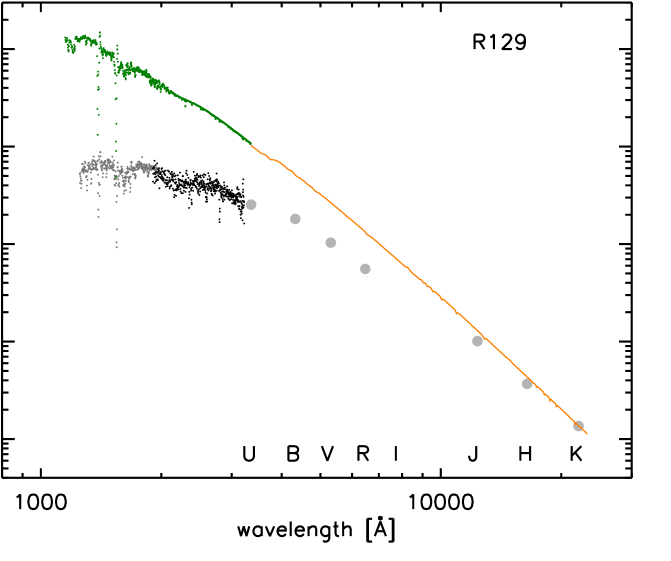
The observed IUE spectra are displayed in Figure 2 as small grey dots. The large dark dots correspond to the broad-band magnitudes measured for the same objects by De Marchi et al. (2011) using the Wide Field Camera 3 (WFC3) on board the HST, while the large grey dots are other recent broad-band measurements (see legend) available in the literature (from SIMBAD)111The band photometry given for R 129 in SIMBAD, referring to Bonanos et al. (2009) and in turn based on that originally given by Zaritsky et al. (2004), is incorrect, as already pointed out by Walborn et al. (2016).. The IUE spectra were normalised to match the photometry in the band obtained by De Marchi et al. (2011). The scale factors applied to the flux are for R 139, for R 140, for R 145, and for R 129. These values are consistent with the large aperture of IUE collecting also the light of some neighbouring stars, and with the % uncertainty on the large aperture’s photometric repeatability (Bohlin et al. 1980; see Bohlin & Bianchi 2018 for a more recent study). Stellar variability and nebular emission can also contribute to the apparent mismatch. However, as we will discuss later, regardless of its specific cause this discrepancy in the absolute photometric calibration of the IUE data does not affect the results of this work since we are interested in the overall shape of the extinction curve in the far UV (FUV) rather than in its detailed features.
3. Comparison with spectral models
To obtain information on the extinction properties of these stars, we compared the continuum of the observed IUE spectra with that of theoretical models for similar spectral types. In the case of R 139, we selected a model atmosphere from the TLUSTY grid (Lanz & Hubeny 2003) specific for the LMC with effective temperature K, surface gravity and metallicity Z⊙ (see Introduction). The adopted value is in line with the O6.5+O6 spectral type of this binary supergiant (e.g. Panagia 1973). We note that even adopting K or K would have resulted in marginal differences in our conclusions, less than 1 %. For R 129, given its somewhat later spectral type (OIa+ C), we selected from the TLUSTY grid a model with K, and metallicity Z⊙. Again, using K or K would have resulted in the same conclusions, to within (note that this slightly larger, yet still small, uncertainty compared to that for the hotter stars is to be expected due to the lower effective temperature of R 129). The adopted effective temperature is consistent with the results of the study of Evans et al. (2004), who employed the model atmosphere code CMFGEN (Hillier & Miller 1998) to investigate the spectral properties of this star and derived K.
Since the TLUSTY grid does not include WR model spectra, for the comparison with R 140 and R 145 we selected a theoretical model from the Potsdam library (Todt et al. 2015) specific for stars of the WNE type and LMC metallicity. The model that best matches the emission features observed in the IUE spectra is characterised by K and .
Although the extinction properties will be derived from the spectral continuum, a good match also between the observed spectral features and those predicted by the models is important to ensure a meaningful comparison. For this reason, the high-resolution model spectra were first convolved with a Gaussian kernel with a full width at half maximum of 6 Å, comparable with that of the low-resolution IUE observations. We then re-sampled the resulting spectra at the same wavelengths of the IUE observations.
The model spectra are shown by the top curves in each panel in Figure 2 and they already include the effects of the intervening MW absorption along the line of sight, adopting (Brunet 1975; Fitzpatrick & Savage 1984) and the standard Galactic extinction law (Fitzpatrick & Massa 1990), hence . For display purposes, the model spectra are registered with the photometric observations at the red end, in the K band.
Thanks to the robust extinction law recently measured inside 30 Dor at optical and NIR wavelengths (Maiz Apellaniz et al. 2014; De Marchi & Panagia 2014; De Marchi et al. 2016), from the comparison between the model spectra and photometry in Figure 2 we can derive not only the selective extinction , but also the absolute value of the total extinction towards R 139, R 140, and R 145. We recall that the 30 Dor extinction curve corresponds to a value of (De Marchi & Panagia 2014; De Marchi et al. 2016). The best fits to the photometric data, indicated by the red curves in Figure 2, correspond respectively to selective extinction values in the LMC of , , and , respectively for R 139, R 140, and R 145. When also the contribution of the intervening MW extinction is included, the values become , , and for the three stars, respectively. The total combined values of (including the contribution of the MW) correspond in turn to , , and respectively for R 139, R 140, and R 145. We note in passing that the value of quoted by Fitzpatrick & Savage (1984) for R 139 appears incompatible with the recently determined spectral type (O Iafc+O6 Iaf; Taylor et al. 2011) and observed colour (Evans et al. 2011) for this object.
For all stars in our sample we will extend the measurement of the absolute extinction to near UV and FUV wavelengths simply by comparing the observed IUE spectra with the model spectra. Indicating with and respectively the observed and model spectrum, the attenuation can be written as
| (1) |
This operation is particularly straightforward in Figure 2. At UV wavelengths and have the same resolution and sampling, so they can be simply divided point by point. Absolute normalisation is obtained by registering the resulting curve at the band.
R 129 is located just outside of the 30 Dor region, in an area of sky where no direct measurements exist concerning the extinction. Instead of making assumptions on the possible shape of the extinction curve in this area, we will use Equation 1 also to derive the extinction properties at optical and NIR wavelengths. Indeed, the nearest line of sight for which extinction has been measured is included in the study of Gordon et al. (2003), who measured the properties of the LMC 2 supershell surrounding 30 Dor. However, those lines of sight are typically about away from R 129. Therefore, rather than making uncertain assumptions, we will derive the optical and NIR extinction properties of R 129 simply by dividing the average flux of the model spectrum inside each photometric band by the corresponding values measured for this star. We will show in this way that also for R 129 the extinction properties are very similar to those characteristic of 30 Dor.
To verify that this approach gives meaningful results, we have applied it also to R 139. To achieve this, we derived an extinction curve from the comparison of the visible and NIR photometry with the model spectrum in Figure 2 and compared it with the extinction curve measured in the central regions of 30 Dor (De Marchi & Panagia 2014; De Marchi et al. 2016). As we will show in the next section, the extinction curve derived photometrically for R 139 is in excellent agreement with the absolute extinction law of 30 Dor.
4. Extinction curves
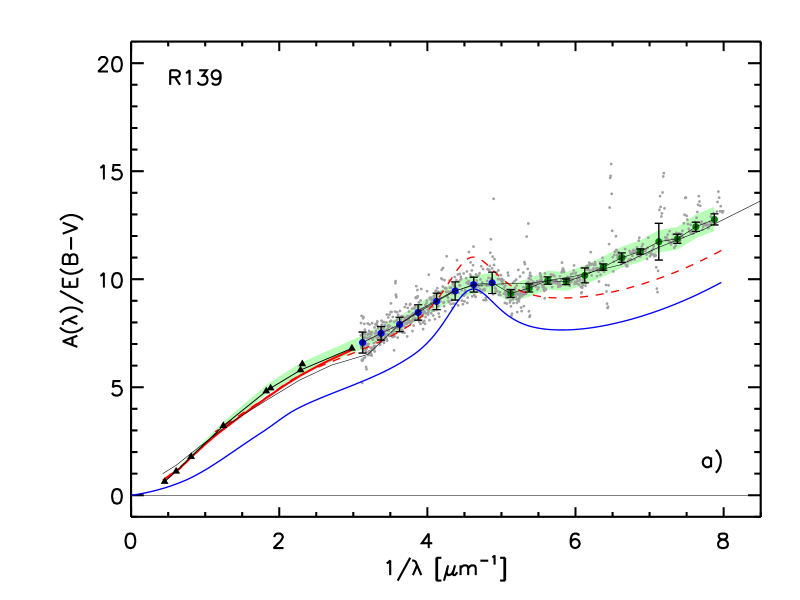
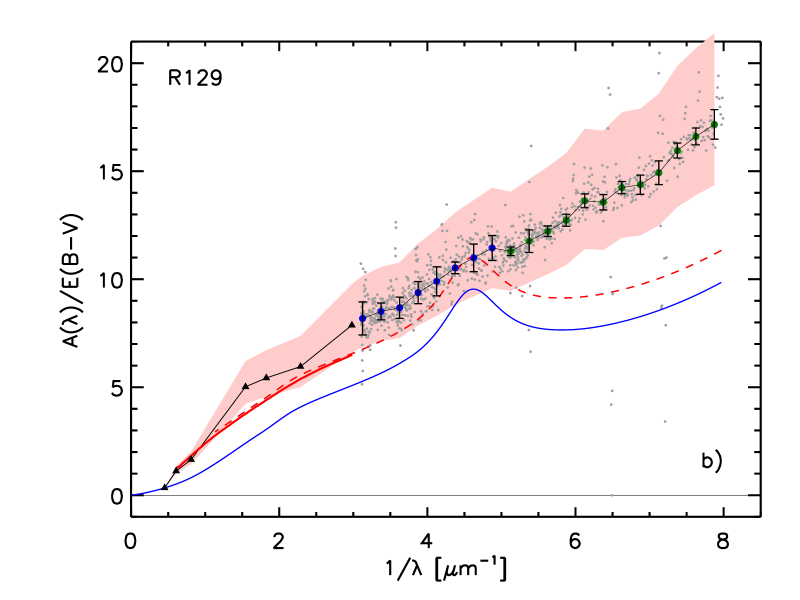
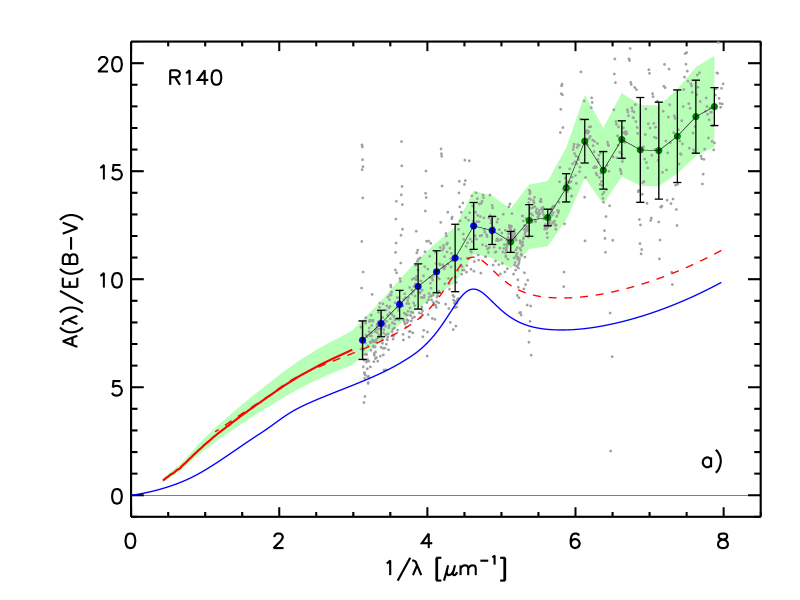
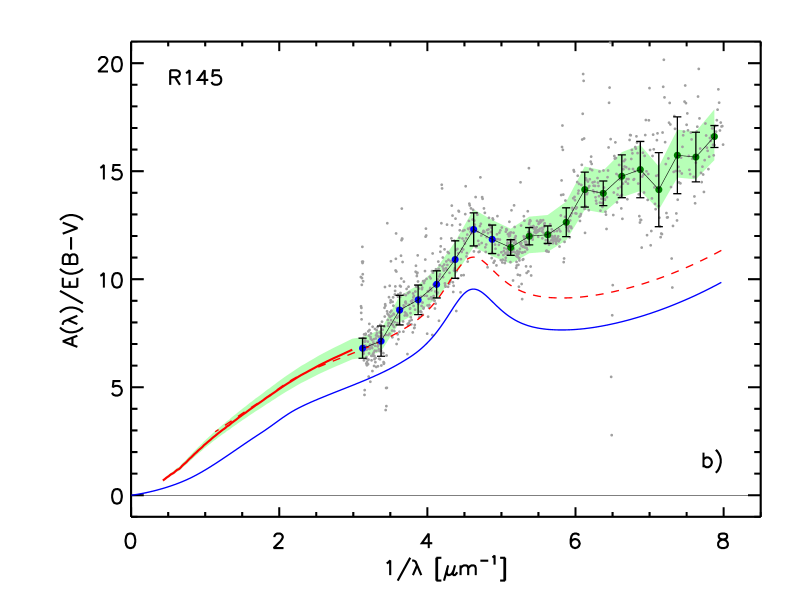
In Figures 3 and 4 we show the extinction properties derived for the four stars in our sample. The values are shown as a function of the wave number and, as customary, they are normalised by (see Table 1), i.e. . We note that, unless otherwise indicated, throughout this paper the values of and referring to the four stars in our sample never include the effects of the intervening MW absorption along the line of sight.
At UV wavelengths, the small grey dots are the result of the individual point-by-point ratios between spectra as per Equation 1, while the large dots with error bars show the average values inside -wide bins in . The average is calculated iteratively after applying a clipping to the data in order to remove outliers. The final uncertainties on the mean are shown by the error bars.
For reference, the thin blue solid lines correspond to the Galactic extinction law (Fitzpatrick & Massa 1990), while the dashed red curves are the same extinction law modified to account for the effects of a grey component as observed in 30 Dor by De Marchi & Panagia (2014). This modification of the Galactic law consists in an additive factor of at optical wavelengths and a multiplicative factor of 2 longwards of 1m (see De Marchi & Panagia 2014 for details). The shaded areas show how the photometric uncertainties on the values of affect the normalisation of the extinction curves. In the UV, the resulting uncertainty band is generally compatible with the error bars described above, but in the case of R 129 it is almost four times as wide. This is due to the relatively large mag uncertainty on combined with the intrinsically small value of . Other marginal sources of uncertainty on the derived extinction curves are associated with fluctuations on the value of the intervening MW extinction and possible spectral mismatches between the observed stars and the adopted spectral models. In fact, both are small. The former is the same for all objects in our field and amounts to mag (Brunet 1975; Fitzpatrick & Savage 1984). The latter is discussed in Section 3 and amounts to a few percent at most.
At longer wavelengths we show as a thick solid red line the optical and NIR extinction law of 30 Dor from De Marchi & Panagia (2014) and De Marchi et al. (2016), which we adopted in the study of the extinction towards R 139, R 140, and R 145. As mentioned earlier, for R 139 we also independently derived an empirical extinction curve from the comparison of the visible and NIR photometry with the model spectrum in Figure 2. The absolute normalisation of the curve is based on the K-band value of , as measured by De Marchi & Panagia (2014) in 30 Dor. The resulting curve, indicated by the connected triangles in Figure 3a, is in excellent agreement with the optical and NIR 30 Dor extinction law (thick solid red line).
Proceeding in the same way, we derived an empirical extinction curve also for R 129 in the NIR and optical range, also indicated by connected triangles (see Figure 3b). The resulting curve is similar to that of 30 Dor and suggests a slightly larger value of , namely instead of , revealing that also in this region outside of 30 Dor (180 pc NNW of R 136) there is an excess of big grains compared to the diffuse Galactic ISM. Note that, to be conservative, the empirical extinction curve of R 129 has been normalised to , namely the value characteristic for the diffuse Galactic ISM (Fitzpatrick & Massa 1990). If instead we had adopted a value intermediate between those of the Galaxy and of 30 Dor, namely , the entire R 129 curve in Figure 3b would be shifted up solidly by the corresponding amount, resulting in . This is not surprising, considering the value of measured by De Marchi et al. (2014) in a region located about SW of 30 Dor.
The actual shape of the extinction law is linked to the composition of the grains and to the distribution function of their sizes (e.g. Greenberg 1968). In particular, selective depletion of small grains from the mix has been shown to produce a flattening (weakening) of the extinction curve at UV wavelengths (e.g. Mathis, Rumpl, Nordsieck 1977). For example, the progressively flatter UV extinction curves observed towards the nearby massive stars Sco, Oph, and Ori are attributed by Mathis & Wallenhorst (1981) to the progressive disappearing of the small silicate grains first, followed by that of the smallest graphite grains.
Figures 3 and 4 immediately reveal that all four extinction curves climb steeply into the FUV, more steeply than the Galactic extinction law at the same wavelengths. Qualitatively, we can already conclude that there is a grain-size distribution function in which small particles are at least as abundant as in the diffuse Galactic ISM, both inside and outside 30 Dor.
For a more quantitative analysis, we compare the extinction curves of R 139 and R 129. Both have late O spectral type and the continuum in the spectra of stars of this type can be reliably modeled and reproduced without having to worry in detail about the effects of mass loss and the resulting stellar winds. The latter are important for the WR stars in our sample and are more difficult to model (e.g. Bonanos et al. 2009). Therefore, we focus our analysis on the O-type stars.
As Figure 3 illustrates, shortwards of Å, () the extinction curves of R 129 and R 139 are almost parallel to one another. The best fits to the slope of the curves in the range are, respectively, and (1 ). Both are steeper than the Galactic extinction law in the same range (). As mentioned above, this immediately suggests a relative excess of small grains.
It is well known (e.g. van de Hulst 1957; Greenberg 1968; Draine & Lee 1984) that at wavelengths short enough the extinction cross section (absorption + scattering) of a grain tends asymptotically to twice its geometric cross section , where denotes the grain radius. At longer wavelengths the extinction is essentially pure absorption and the cross section is smaller than , being proportional to . Conveniently enough, the transition occurs approximately at . Thus, for a fixed grain size, to a zeroth approximation one would expect a marked change of slope, with the transition occurring around and a flattening at shorter wavelengths. When a more realistic distribution of grain sizes is present, the transition will be obviously smoother, but the extinction curve would flatten out only at wavelengths shorter than . Since the extinction curves of both R 139 and R 129 continue to grow steeply with a steady slope and no abatement until the low wavelength end of our data (m), it appears that is not yet reached. Thus it is safe to assume that . In other words, the size of the smallest grains must be smaller than that corresponding to , i.e. smaller than . This suggests grain sizes of the order of m.
Even though a detailed study of the grain size distribution in 30 Dor is beyond the scope of this paper, because no information is available on the nature of the absorbers, comparing the extinction curves of our 30 Dor sources with those of other massive stars in the LMC can give us some indications about the small-grain population also in and around 30 Dor. A relevant comparison object is Sk – 70 116, a star of spectral type B2I located in LH 117, an OB association (Massey et al. 1989) about SE of 30 Dor and included in the LMC 2 Supershell sample studied by Gordon et al. (2003).
To ease the comparison, in Figure 5 we show the extinction curves with a different normalisation, namely in turn equivalent to or . This normalisation is immune from the effects of the additive grey extinction caused by an excess of large grains in the 30 Dor region (De Marchi & Panagia 2014). The red solid curve corresponds to R 139, while the dot-dashed line to Sk – 70 116 (Gordon et al. 2003). The agreement is excellent and applies to the entire wavelength range spanned by the observations, including the FUV rise, the shape of the characteristic Å feature and the decline in the infrared. We note in passing that the similarity in the shape of the latter suggests that the quoted by Gordon et al. (2003) is probably a lower limit to the actual value, which might be in excess of , also considering the uncertainties on the 2 MASS photometry for this object. Regardless of the actual value of , the excellent match between the curves reveals that the extinction properties towards R 139 are not unusual in this region of the LMC and confirms that even inside 30 Dor there is an excess of small grains with respect to the Galactic extinction law. .
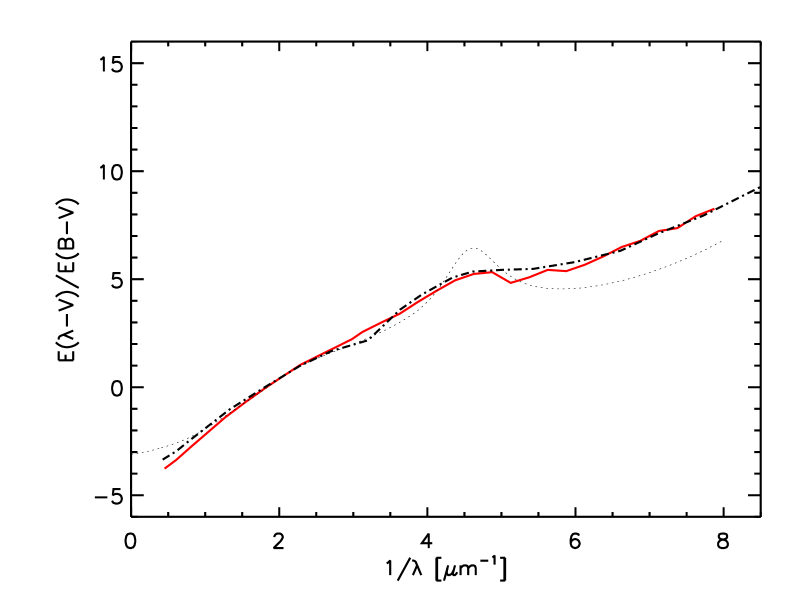
Also R 140 and R 145 confirm these conclusions (see Figure 4). Although spectral comparison with the atmosphere of WR stars is complicated by the presence of winds, that are not always properly modelled (Bonanos et al. 2009), these two stars provide a picture consistent with that outlined above. In fact, also two supergiants of spectral type B included in the sample studied by Gordon et al. (2003) in the LMC (Sk–67 2 and Sk–69 213) have extinction curves in rather good agreement with those of R 140 and R 145, including the shape of the 2 175 Å feature. This shows, once more, that the extinction conditions probed by R 140 and R 145 are similar to those found elsewhere in the LMC.
5. Discussion
In De Marchi & Panagia (2014) we showed that, at optical wavelengths, the shape of the extinction curve of 30 Dor has an additional grey component compared to the extinction law in the diffuse Galactic ISM. This reveals that in 30 Dor there is a larger fraction of big grains relatively to the MW (see also De Marchi et al. 2016). These are grains with sizes of m m (hereafter, for simplicity, “big grains”), whose effect is most directly seen on the extinction curve in the range m. To determine how large this fraction of big grains actually is, we looked in the NIR, where the wavelength is appreciably greater than the size of all grains, so that the extinction is dominated by grains of larger size and it is proportional to their total mass (e.g. Greenberg 1968).
We observed that at wavelengths longer than 1 m, the extinction curve of 30 Dor tapers off as . This behaviour is virtually identical to that of the Galactic extinction law (e.g. Cardelli, Clayton & Mathis 1989; Wang et al. 2013) and suggests that the big grains in 30 Dor have the same nature as those in the Galaxy. The ratio between the 30 Dor and Galactic curves is . Thus, even though we do not have direct information on the nature of the big grains in 30 Dor, the most reasonable explanation for the extinction curve that we observe at wavelengths longer than 1 m is that the nature of big grains in 30 Dor is the same as in the diffuse ISM of the Galaxy or LMC, but that the fraction of these big grains is about twice as high compared with the grain population in the Milky Way.
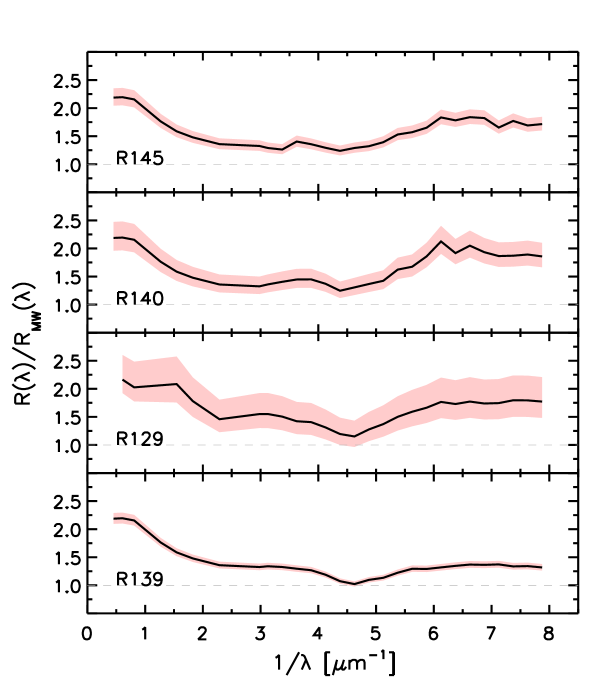
The analysis presented in the previous section, and in particular the steep FUV rise in Figures 3 and 4, indicates that in 30 Dor also grains with m m (hereafter, for simplicity, “small grains”) are overabundant compared to the diffuse Galactic ISM.222In the following discussion we will use as a reference the diffuse Galactic ISM, but we point out that the latter is in excellent agreement with the diffuse ISM in the LMC (e.g. Gordon et al. 2003). To gain some quantitative information on the excess of small grains, we consider in Figure 6 the ratio between the extinction curves of our 30 Dor stars and that of the Galactic ISM, , taken from Fitzpatrick & Massa (1990). We recall that does not include the intervening MW absorption along the line of sight to the LMC.
As mentioned above, at NIR wavelengths () the ratio of extinction curves is constant for all stars and has a value of about 2, indicating that the nature of the big grains is the same and their fraction is about twice as high as in the MW. A rather constant ratio is also seen in the FUV (), where for the O-type stars, and this suggests that also the nature of the small grains is the same as in the MW and that in 30 Dor their relative abundance is about 50 % higher than in the diffuse Galactic ISM. We stress that, even though small grains of a different nature could still reproduce the observed extinction curve with a different relative abundance, the most reasonable explanation is that the nature of the small grains is the same as in the MW. The observations of the WR stars R 140 and R 145 suggest a higher ratio, closer to , but this might be partly due to the strong winds of these WR stars, as mentioned before, rather than to the intrinsic properties of the ISM. Thus, we can safely conclude that the increase in the abundance of small grains is at least 50 % compared to the MW, and possibly larger.
The other interesting feature of Figure 6 is the marked minimum near , corresponding to the characteristic Å feature in the extinction curves. For the O-type stars (R 129 and R 139), the ratio at this wavelength is compatible with unity, and even for the WR stars (R 140, R 145) it is only slightly higher (). It appears that the processes responsible for the observed excess of both big grains and small silicate grains do not also contribute significantly to the very small carbonaceous particles with m (hereafter, “very small grains”), including possible graphitic grains and polycyclic aromatic hydrocarbons, which are traditionally associated with the Å feature (e.g. Weingartner & Draine 2001; Li & Draine 2001; Bradley et al. 2005). According to Weingartner & Draine (2001), the depletion of the Å feature observed in dense environments, where is large like in this case, might indeed result entirely from the lack of very small carbonaceous grains.
As we already pointed out in the Introduction, a larger fraction of big grains requires a mechanism that either selectively adds big grains, or selectively removes small grains by destroying or co-adding them, or a combination of both. However, any mechanism that produces big grains only by selectively removing or co-adding pre-existing small grains is not compatible with the observations, since not only the big grains, but also the small grains appear to be more abundant in 30 Dor than in the diffuse ISM of either the Galaxy or LMC. Therefore, Occam’s razor would suggest that the injection of fresh grains (both big and small) by 30 Dor into the LMC diffuse ISM is the preferred mechanism.
The resulting picture is one in which we identify two components in the ISM of 30 Dor. One is similar to that of the diffuse Galactic ISM and most likely represents the pre-existing diffuse ISM of the LMC (Gordon et al. 2003). The additional, newly injected component contains big grains with a relative abundance similar to that of the ISM in the MW or LMC, small grains with a relative abundance of about half that of the MW/LMC, and little or no very small carbonaceous grains. Thus, the distribution of the total mass stored in grains of different sizes in the newly injected component appears to be steeper than that of the diffuse ISM in the Galaxy or LMC, i.e. skewed towards larger values of the radius .
A process able to naturally account for the injection of new grains in a young region where star formation is still ongoing is the explosion of massive stars as type-II supernovae (SN). Indeed, massive-star SN are expected to have been major dust producers throughout the history of the universe (e.g. Sugerman et al. 2006). Observations of SN 1987A with Herschel and ALMA (Matsuura et al. 2011; Gomez et al. 2012; Indebetouw et al. 2014) and of the Crab Nebula and Cassiopeia A with Herschel (Barlow et al. 2010; Gomez et al. 2012; De Looze et al. 2017) have revealed up to and possibly exceeding M⊙ of dust formed in situ in core-collapse SN ejecta.
To be sure, there is still considerable uncertainty about the actual size distribution of dust formed in supernova remnants (e.g. Temim & Dwek 2013; Wesson et al. 2015; Owen & Barlow 2015; Bevan & Barlow 2016). Nevertheless, Gall et al. (2014) discovered rapid formation (within hundreds of days) of dust in the dense circumstellar medium of SN 2010jl and showed that, adopting a power-law distribution of grain sizes with a typical index , the observed extinction curves can be reproduced only if there is an excess of large grains and the maximum size of the grains exceeds m. Therefore, within the stated uncertainties, big grains appear to represent the majority of the produced dust mass. Simulations by Silvia et al. (2010) indicate that grains larger than m survive reverse shock interactions and only a low fraction of them is sputtered to smaller radii. Similarly, Biscaro & Cherchneff (2016) show that in SN with dense ejecta, like SN 1987A, also grains down to m survive thermal sputtering in the remnant. Therefore, the big grains to which our observations are sensitive (m) appear to be a natural and long-lasting end-product of type-II SN explosions.
Note that there is currently no way to know whether these big grains are produced directly as such by SN explosions or whether they result from quick growth of smaller grains produced in the ejecta. But for the purposes of our research, which is to understand the extinction properties in massive star-forming regions, this is not important. What is clear, however, is that even if the big grains were forming through the quick growth of small grains, the latter cannot be just the pre-existing small grains in the ISM of the LMC, because in the 30 Dor ISM their relative amount is about 50 % higher than in the diffuse ISM of the LMC or MW. In fact, unlike big grains, small grains may be destroyed in the shocked region within the type-II SN before being injected into the interstellar space (Bianchi & Schneider 2007; Nozawa et al. 2007) and might have been originally even more abundant. Therefore, pre-existing small grains alone and any process that they might have undergone cannot account for the spectrum of grain sizes and masses that our observed extinction curves reveal. Instead, fresh injection of new grains is necessary, and the spectrum of grain sizes for dust effectively injected by type-II SN explosions into the surrounding ISM agrees, at least qualitatively, with the mass distribution that we infer from the observations.
To be more quantitative, we compare the total mass of big grains implied by the extinction curve that we measure with that expected from SN-II explosions in the Tarantula Nebula. At wavelengths longer than the band, the effects of big grains start to saturate, suggesting that m (see Section 4) and, consequently, the presence of grains of radius m or cm. As noted in Section 4, at wavelengths short enough, the extinction cross-section of a grain of radius tends asymptotically to , corresponding to cm-2 in this case. Knowing the grain’s cross section, we can derive the number of grains along the line of sight simply as a ratio of optical depth and .
The median value of in the field of the Tarantula Nebula is (De Marchi et al. 2016), about 1/3 of which is due to the freshly injected component of big grains, since in the Tarantula Nebula and in the diffuse ISM of the LMC. The resulting value associated with the freshly injected big grains alone is then , which in turn corresponds to an optical depth . The number of big grains associated with the additional component along the line of sight is simply
| (2) |
Assuming a spherical shape for the Tarantula Nebula, with diameter cm (Sabbi et al. 2013), the spatial density of big grains along the line of sight is
| (3) |
With a total volume cm3, the total number of new big grains hosted in the Tarantula Nebula is
| (4) |
Silicates grains have a specific density of g cm-3 (Panagia 1974; Draine & Lee 1984), implying a typical mass per grain of g, and a total mass of freshly injected big grains of
| (5) |
or about M⊙ .
If we assume that each SN-II explosion provides about M⊙ of big grains (see above), then we need about 2400 such explosion occurring in the Tarantula Nebula over the time of its existence. Recently, Cignoni et al. (2015, 2016) studied the properties of the stellar populations present in the Tarantula region, using synthetic colour–magnitude diagrams generated with the latest PARSEC models (Bressan et al. 2012; Marigo et al. 2017) and assuming a Kroupa (2001) initial mass function (IMF; ). They showed that star formation within the whole Tarantula Nebula has been active for more that 20 Myr. Also, for one of the more evolved clusters in the Tarantula region, Hodge 301, they estimate an age of about 29 Myr, a total stellar mass of 8800 Msolar, and a number of about 49 SN-II explosions occurred since its birth. We adopt as a conservative value for the total mass of the Tarantula M⊙ , considering that the R 136 cluster alone has a mass of M⊙ with a half-mass radius of 14 pc (Bosch et al. 2009). Thus, using the data of Hodge 301 to base our extrapolation, we obtain about 5600 as a lower limit to the total number of SN-II occurred since the Tarantula Nebula formation (i.e. no less than of 30 Myr ago). In fact, the rate of SN-II could be higher adopting the “shallower” IMF index , as recently determined by Schneider et al. (2018) for 30 Dor. Therefore, although these calculations are necessarily approximate, it appears that the total mass of big grains required by our extinction curves is quantitatively consistent with that expected from SN-II explosions.
6. Conclusions
Our work suggests that type-II SN explosions can modify the conditions of the ISM by injecting a mixture of grains with a different distribution of sizes. This change is only temporary, because grain shattering will eventually affect the newly injected grains, breaking bigger grains, and shocks will ultimately destroy them and increase the abundance of small grains (e.g. Jones et al. 1996; Hirashita & Kuo 2011).
The lifetime of dust grains in the Magellanic Clouds, as calculated by Temim et al. (2015) from the analysis of the complete sample of SN remnants in these galaxies, ranges from to Myr, depending on their composition and location. Considering that the lifetime of the lowest-mass type-II SN progenitors ( M⊙ ) is of the order of 40 Myr and for the most massive stars only a few Myr (e.g. Marigo et al. 2017), the modified distribution of grain sizes is likely to affect the ISM for about Myr starting some Myr after a major star-formation event, also including the time needed for the ejecta from the first SN explosions to be dispersed in the surrounding ISM. Obviously, regions of extended and protracted star formation like 30 Dor and the entire Tarantula Nebula (De Marchi et al. 2017; Sabbi et al. 2016; Cignoni et al. 2015) will bear the consequences of a modified ISM for a longer time. Indeed, in the somewhat older neighbouring star-forming region located about SW of 30 Dor, De Marchi et al. (2014) measured an even higher value of , namely , indicating an even larger fraction of big grains. Nor is the contamination of the ISM with freshly injected grains limited only to the immediate surroundings of the star-forming regions themselves.
Assuming a typical velocity dispersion of km s-1 in massive star-forming regions (e.g. Bosch, Terlevich & Terlevich 2009; Rochau et al. 2010) as a very conservative lower limit to the velocity of the ejecta in the ISM, some Myr after a major star-formation event we should expect the freshly created grains to have travelled distances of pc, as long as they are not slowed down or destroyed in their flight.
Thus, in star-forming regions hosting stars that end their life as SN-II, and hence more massive than M⊙ , we should expect extinction properties appreciably different from those of the diffuse ISM. This includes the nearby Orion Nebula Cluster, whose anomalous extinction properties have been noticed first by Baade & Minkowski (1937) and for which a value of in excess of has been consistently reported since the 1950s (e.g. Sharpless 1952; Johnson & Borgman 1963; Johnson & Mendoza 1964; Gebel 1968; Breger et al. 1981). The observed extinction properties are attributed to an additional component of big grains (e.g. Cardelli & Clayton 1988; Beitia–Antero & Gomez de Castro 2017). These properties are fully compatible with those observed in 30 Dor and can be attributed to fresh injection of preferentially big grains by type-II SN explosions.
Conversely, star-forming regions of low total mass should not display anomalous extinction curves because they do not contain enough massive stars whose explosion as type-II SN can effectively alter the conditions of the ISM. A nearby example is that of the Taurus star-forming region, with a very low total mass ( M⊙ ; De Marchi et al. 2010) and membership (438 members; Luhman 2018), and with extinction properties (Vrba & Rydgren 1985; Kenyon et al. 1994; Arce & Goodman 1999) fully consistent with those of the diffuse Galactic ISM.
Our work highlights the complexity inherent in interpreting observations of star-forming regions, even in the Milky Way and nearest Magellanic Clouds galaxies. Deriving stellar masses and star formation rates from broad-band photometry and emission-line luminosities in more distant starburst galaxies and at high redshift is subject to even more severe limitations, because the extinction properties and three-dimensional distribution of the stars with respect to the dust are completely unknown. Yet the only star-forming regions that can be observed in these early Universe environments are clusters as massive as 30 Dor or more. They can only be observed when massive stars are still present, and therefore when the ISM is mostly affected by big grains injected by SN-II. Therefore, without proper knowledge of the actual extinction properties, any attempts to derive quantitative physical parameters in these environments will be plagued by very large uncertainties and are bound to fail.
References
- (1) Arce, H., Goodman, A. 1999, ApJ, 517, 264
- (2) Asplund, M., Grevesse, N., Sauval, A., Scott, P. 2009, ARAA, 47, 481
- (3) Baade, W., Minkowski, R. 1937, ApJ, 86, 123
- (4) Barlow, M., Krause, O., Swinyard, B., et al. 2010, A&A, 518, L138
- (5) Beitia–Antero, L., Gómez de Castro, A. 2017, MNRAS, 469, 2531
- (6) Bevan, A., Barlow, M. 2016, MNRAS, 456, 1269
- (7) Biscaro, C., Cherchneff, I. 2016, A&A, 589, A132
- (8) Bianchi, S., Schneider, R. 2007, MNRAS, 378, 973
- (9) Bohlin, R., Holm, A., Savage, B., Snijders, M., Sparks, W. 1980, A&A, 85, 1
- (10) Bohlin, R., Bianchi, L. 2018, AJ, 155, 162
- (11) Bonanos, A., Massa, D., Sewilo, M., et al. 2009, AJ, 138, 1003
- (12) Bosch, G., Terlevich, E., Terlevich, R. 2009, AJ, 137, 3437
- (13) Bradley, J., Dai, Z., Erni, R., et al. 2005, Sci, 307, 244
- (14) Breger, M., Gehrz, R., Hackwell, J. 1981, ApJ, 248, 963
- (15) Bressan, A., Marigo, P., Girardi, L., et al. 2012, MNRAS, 427, 127
- (16) Cardelli, J., Clayton, G. 1988, AJ, 95, 516
- (17) Cardelli, J., Clayton, G., Mathis, J. 1989, ApJ, 345, 245
- (18) Cignoni, M., Sabbi, E., van der Marel, R., et al. 2015, ApJ, 811, 76
- (19) Cignoni, M., Sabbi, E., van der Marel, R., et al. 2016, ApJ, 833, 154
- (20) Conti, P. 1982, in Wolf-Rayet stars: Observations, Physics, Evolution, IAU Symp. 99, ed. C. de Loore, A. Willis (Dordrecht: Reidel), 511
- (21) Conti, P., Leep, M., Perry, D. 1983, ApJ, 268, 228
- (22) Crowther, P. 2007, ARAA, 45, 177
- (23) Cutri, R., Skrutskie, M., van Dyk, S., et al. 2003, The IRSA 2MASS All-Sky Point Source Catalog (Pasadena, CA: IPAC/CalTech)
- (24) De Looze, I., Barlow, M. , Swinyard, B., et al. 2017, MNRAS, 465, 3309
- (25) De Marchi, G., Clampin, M., Greggio, L., et al. 1997, ApJ, 479, L27
- (26) De Marchi, G., Nota, A., Leitherer, C., Ragazzoni, R., Barbieri, C. 1993, ApJ, 419, 658
- (27) De Marchi, G., Panagia, N. 2014, MNRAS, 445, 93
- (28) De Marchi, G., Panagia, N., Beccari, G. 2017, ApJ, 846, 110
- (29) De Marchi, G., Panagia, N., Girardi, L. 2014, MNRAS, 438, 513
- (30) De Marchi, G., Panagia, N., Sabbi, E., et al. 2016, MNRAS, 455, 4373
- (31) De Marchi, G., Paresce, F., Panagia, N., et al. 2011, ApJ, 739, 27
- (32) De Marchi, G., Paresce, F., Portegies Zwart, S. 2010, ApJ, 718, 105
- (33) Draine, B., Lee, H. 1984, ApJ, 285, 89
- (34) Drissen, L., Moffat, A., Shara, M. 1993, AJ, 105, 1400
- (35) Evans, C., Crowther, P., Fullerton, A., Hillier, D. 2004, ApJ, 610, 1021
- (36) Evans, C., Taylor, W., Hènault–Brunet, V., et al. 2011, A&A, 530, A108
- (37) Fitzpatrick, E., Massa, D. 1990, ApJS, 72, 163
- (38) Fitzpatrick, E., Massa, D. 2005, AJ, 130, 1127
- (39) Fitzpatrick, E., Savage, B. 1984, ApJ, 279, 578
- (40) Förster Schreiber, N., Genzel, R., Lutz, D., Sternberg, A. 2003, ApJ, 599, 193
- (41) Gall, C., Hjorth, J., Watson, D., et al. 2014, Nature, 511, 326
- (42) Gallagher, J., Smith, L. 1999, MNRAS, 304, 540
- (43) Gebel, W. 1968, ApJ, 153, 743
- (44) Geha, M. et al. 1998, AJ, 115, 1045
- (45) Gomez, H., Krause, O., Barlow, M., et al. 2012, ApJ, 760, 96
- (46) Gordon, K., Clayton, G., Misselt, K., Landolt, A., Wolff, M. 2003, ApJ, 594, 279
- (47) Greenberg, J. M. 1968, in Nebular and interstellar matter, Ed. B. Middlehurst, L. Aller (Chicago: Univ. Chicago Press), 221
- (48) Hill, V., Andrievsky, S., Spite, M. 1995, A&A, 293, 347
- (49) Hillier, D., Miller, D. 1998, ApJ, 496, 407
- (50) Hirashita, H., Kuo, T. 2011, MNRAS, 416, 1340
- (51) Ho, L., Filippenko, A. 1996, ApJ, 472, 600
- (52) Howarth, I. 2013, A&A, 555, A141
- (53) Hunter, D., O’Connell, R., Gallagher, J., Smecker-Hane, T. 2000, AJ, 120, 2383
- (54) Indebetouw, R., Matsuura, M., Dwek, E., et al. 2014, ApJ, 782, L2
- (55) Johnson, H., Borgman, J. 1963, Bull. Astron. Inst. Netherlands, 17, 115
- (56) Johnson, H., Mendoza v., E. 1964, BOTT, 3, 331
- (57) Jones, A., Tielens, A., Hollenbach, D. 1996, ApJ, 469, 740
- (58) Kenyon, S., Dobrzycka, D., Hartmann, L. 1994, AJ, 108, 1872
- (59) Kroupa, P. 2001, MNRAS, 322, 231
- (60) Lanz, T., Hubeny, I. 2003, ApJS, 146, 417
- (61) Li, A., Draine, B. 2001, ApJ, 554, 778
- (62) Lilly, S., Le Fevre, O., Hammer, F., Crampton, D. 1996, ApJ, 460, L1
- (63) Luhman, K. 2018, AJ, 156, 271
- (64) Maíz Apellániz, J., Evans, C., Barbá, R., et al. 2014, A&A, 564, A63
- (65) Maíz Apellániz, J., Perez, E., Mas–Hesse, J. M. 2004, AJ, 128, 1196
- (66) Madau, P., Ferguson, H., Dickinson, M., Giavalisco, M., et al. 1996, MNRAS, 283, 1388
- (67) Marigo, P., Girardi, L., Bressan, A., et al. 2017, ApJ, 835, 77
- (68) Martinez–Galarza, J., Hunter, D., Groves, B., Brandl, B. 2012, ApJ, 761, 3
- (69) Massey, P., Garmany, C., Silkey, M., Degioia–Eastwood, K. 1989, AJ, 97, 107
- (70) Mathis, J., Rumpl, W., Nordsieck, K. 1977, ApJ, 217, 425
- (71) Mathis, J., Wallenhorst, S. 1981, ApJ, 244, 483
- (72) Matsuura, M., Dwek, E., Meixner, M., et al. 2011, Sci, 333, 1258
- (73) Moffat, A. 1989, ApJ, 347, 373
- (74) Nozawa, T., Kozasa, T., Habe, A., et al. 2007, ApJ, 666, 955
- (75) Owen, P., Barlow, M. 2015, ApJ, 801, 141
- (76) Panagia, N. 1973, AJ, 78, 929
- (77) Panagia, N. 1974, ApJ, 192, 221
- (78) Phillips, M. 1982, MNRAS, 198, 1053
- (79) Rochau, B., Brandner, W., Stolte, A., et al. 2010, ApJ, 716, L90
- (80) Sabbi, E., Anderson, J., Lennon, D., et al. 2013, AJ, 146, 53
- (81) Sabbi, E., Lennon, D., Anderson, J., et al. 2016, ApJS, 222, 11
- (82) Sana, H., van Boeckel, T., Tramper, F., et al. 2013, MNRAS, 432, L26
- (83) Schneider, F., Sana, H., Evans, C., et al. 2018, Sci, 359, 69
- (84) Schnurr, O., Moffat, A., Villar–Sbaffi, A., St-Louis, N., Morrell, N. 2009, MNRAS, 395, 823
- (85) Sharpless, S. 1952, AJ, 116, 251
- (86) Silvia, D., Smith, B., Shull, J. 2010, ApJ, 715, 1575
- (87) Smith, L., Bastian, N., Konstantopoulos, I., et al. 2007, ApJ, 667, L145
- (88) Sugerman, B., Ercolano, B., Barlow, M., et al. 2006, Sci, 313, 196
- (89) Taylor, W., Evans, C., Sana, H., et al. 2011, A&A, 530, L10
- (90) Temim, T., Dwek, E. 2013, ApJ, 774, 8
- (91) Temim, T., Dwek, E., Tchernyshyov, K., et al. 2015, ApJ, 799, 158
- (92) Todt, H., Sander, A., Hainich, R., et al. 2015, A&A, 579, A75
- (93) Tosi, M., Sabbi, E., Bellazzini, M., et al. 2001, AJ, 122, 1271
- (94) Valencic, L., Clayton, G., Gordon, K. 2004, ApJ, 616, 912
- (95) van de Hulst, H. 1957, Light Scattering by Small Particles (New York: John Wiley & Sons)
- (96) Vanzella, E., Castellano, M., Meneghetti, M., et al. 2017, ApJ, 842, 47
- (97) Vrba, F., Rydgren, A. 1985, AJ, 90, 1490
- (98) Walborn, N. R. 1977, ApJ, 215, 53
- (99) Walborn, N. 1991, in “The Magellanic Clouds”, IAU Symp. 148, Ed. R. Haynes, D. Milne (Dordrecht: Kluwer), 145
- (100) Wang, S., Gao, J., Jiang, B., Li, A., Chen, Y. 2013, ApJ, 773, 30
- (101) Watson, A., Costero, R. 2011, RMxAC, 39, 9
- (102) Weigelt, G., Baier, G. 1985, A&A, 150, L18
- (103) Weingartner, J., Draine, B. 2001, ApJ, 548, 296
- (104) Wesson, R., Barlow, M., Matsuura, M., Ercolano, B. 2015, MNRAS, 446, 2089
- (105) Whiteoak, J. 1966, ApJ, 144, 305
- (106) Zacharias, N., Finch, C. T., Girard, T. et al. 2013, AJ, 145, 44
- (107) Zaritsky, D., Harris, J., Thompson, I., Grebel, E. K. 2004, AJ, 128, 1606