H i Clouds in LITTLE THINGS Dwarf Irregular Galaxies
Abstract
We identify 814 discrete H i clouds in 40 dwarf irregular galaxies from the LITTLE THINGS survey using an automated cloud-finding algorithm. The cloud masses range from to , have a surface density averaged over all of the clouds of pc-2, and constitute 2-53% of the total H i mass of the host galaxy. For individual clouds, the mass including He varies with cloud radius as and the internal velocity dispersion varies as . The H i clouds tend to be in the outer regions of the galaxies, with 72% of the galaxies having more than 70% of their clouds outside one disk scale length, and 32% of the galaxies having more than 50% of their clouds outside the radius encircling the H ii emission. 36% of the clouds are essentially non-self-gravitating from H i alone, with a virial parameter that exceeds , and 5% have . We estimate the missing molecular mass, based on the total star formation rate and a typical molecular consumption time of 2 Gyr, as observed in CO-rich galaxies. The resulting molecular fraction has a value averaged over the galaxies of 0.23 and correlates with both the surface density of star formation and the fraction of H i clouds in the outer regions. We conclude that a significant fraction of the inner parts of these dwarf galaxy disks is in the form of dark molecular gas, and that this fraction could be high enough to make the inner disks mildly gravitationally unstable as a precursor to star formation.
1 Introduction
It is commonly believed that stars form in molecular clouds and molecular clouds form from H i clouds (McKee & Ostriker, 2007). This concept is difficult to observe in gas-rich dwarf irregular galaxies (dIrrs) because molecular tracers like CO and cold dust are usually too faint to see at the low metallicities of these galaxies (e.g., % solar; for example, Elmegreen et al., 2013; Cormier et al., 2017; Madden & Cormier, 2019). Generally only H i is observed in emission and that H i has a large-scale average gas density that is too low for clouds to form by self-gravitational processes, which seem to be more evident in spirals (see, for example, van Zee et al., 1997; Hunter et al., 1998; Bigiel et al., 2008). Yet, dIrrs have both star formation and H i clouds. For example, Kim et al. (2007) conducted a survey of neutral hydrogen clouds in the Large Magellenic Cloud (LMC) and identified 468 clouds with masses in the range of ☉ to M☉.
Here, we present a study of the H i clouds in a sample of 40 nearby dwarf irregular galaxies. The clouds are found from radio interferometric position-velocity H i data cubes using automatic cloud detection software made publicly available by Rosolowsky & Leroy (2006). We discuss the source of the data in Section 2, and the cloud identification process in Section 3. In Section 4 we present the cloud properties and distributions within the galaxies. Although we compare our results to those of Kim et al. (2007), the galaxies in our sample had spatial resolutions ranging from of 19 pc (IC 10) to 424 pc (F564-V3) while Kim et al.’s survey had a spatial resolution of 12 pc at the LMC. Section 5 then considers the likelihood that a significant fraction of the gas is molecular in the inner regions.
2 Data
We used the LITTLE THINGS222Funded in part by the National Science Foundation through grants AST-0707563, AST-0707426, AST- 0707468, and AST-0707835 to US-based LITTLE THINGS team members and with generous technical and logistical support from the National Radio Astronomy Observatory. (Local Irregulars That Trace Luminosity Extremes, The H i Nearby Galaxy Survey; Hunter et al. 2012) sample of dIrr galaxies. LITTLE THINGS is a multi-wavelength survey of 37 dIrr galaxies and 4 Blue Compact Dwarfs (BCD) aimed at understanding what drives star formation in tiny systems. The LITTLE THINGS galaxies were chosen to be nearby (10.3 Mpc), contain gas so they could be forming stars, and cover a large range in dwarf galactic properties, such as rate of star formation. The LITTLE THINGS data sets include H i-line maps obtained with the National Science Foundation’s Karl G. Jansky Very Large Array (VLA333The VLA is a facility of the National Radio Astronomy Observatory. The National Radio Astronomy Observatory is a facility of the National Science Foundation operated under cooperative agreement by Associated Universities, Inc.). The H i data cubes combine observations in the B, C, and D arrays and are characterized by high sensitivity (1.1 mJy beam-1 per channel), high spectral resolution (1.3 or 2.6 km s-1), and moderately high angular resolution (frequently, 6″). In this study we used the robust-weighted maps. In robust-weighting the spatial resolution is somewhat higher compared to naturally-weighted mapping and the beam shape is more gaussian. The galaxies used in this study and their properties that are useful here are listed in Table 1.
| D | Beam sizeaaBeam FWHM determined from the square-root of the major axis times the minor axis, for robust-weighted maps (Hunter et al., 2012). | bbIntegrated star formation rate (SFR) determined from the Galaxy Evolution Explorer (GALEX; Martin et al., 2005) far-ultraviolet (FUV) luminosity (Hunter et al., 2010). The SFR is normalized by dividing by the area within one disk scale length . | ccTotal H i mass of the galaxy from Hunter et al. (2012). | dd is the radius at which the -band surface brightness profile changes slope, if it does (Herrmann et al., 2013). is the disk scale length determined from the -band (Herrmann et al., 2013). is the extent of H emission (Hunter & Elmegreen, 2004). is the radius of the furthest out FUV knot identified on GALEX images (Hunter et al., 2016). | dd is the radius at which the -band surface brightness profile changes slope, if it does (Herrmann et al., 2013). is the disk scale length determined from the -band (Herrmann et al., 2013). is the extent of H emission (Hunter & Elmegreen, 2004). is the radius of the furthest out FUV knot identified on GALEX images (Hunter et al., 2016). | dd is the radius at which the -band surface brightness profile changes slope, if it does (Herrmann et al., 2013). is the disk scale length determined from the -band (Herrmann et al., 2013). is the extent of H emission (Hunter & Elmegreen, 2004). is the radius of the furthest out FUV knot identified on GALEX images (Hunter et al., 2016). | dd is the radius at which the -band surface brightness profile changes slope, if it does (Herrmann et al., 2013). is the disk scale length determined from the -band (Herrmann et al., 2013). is the extent of H emission (Hunter & Elmegreen, 2004). is the radius of the furthest out FUV knot identified on GALEX images (Hunter et al., 2016). | |
|---|---|---|---|---|---|---|---|---|
| Galaxy | (Mpc) | (pc) | (☉yr-1 kpc-2) | (☉) | (kpc) | (kpc) | (kpc) | (kpc) |
| CVnIdwA | 3.6 | 187 | -2.480.01 | 7.67 | 0.560.49 | 0.250.12 | 0.69 | 0.490.03 |
| DDO 43 | 7.8 | 262 | -1.550.01 | 8.23 | 1.460.53 | 0.870.10 | 2.36 | 1.930.08 |
| DDO 46 | 6.1 | 170 | -2.460.01 | 8.27 | 1.270.18 | 1.130.05 | 1.51 | 3.020.06 |
| DDO 47 | 5.2 | 245 | -2.400.01 | 8.59 | 1.340.05 | 5.58 | 5.580.05 | |
| DDO 50 | 3.4 | 108 | -1.550.01 | 8.85 | 2.650.27 | 1.480.06 | 4.860.03 | |
| DDO 52 | 10.3 | 297 | -2.430.01 | 8.43 | 2.801.35 | 1.260.04 | 3.69 | 3.390.10 |
| DDO 53 | 3.6 | 105 | -2.410.01 | 7.72 | 0.620.09 | 0.470.01 | 1.25 | 1.190.03 |
| DDO 63 | 3.9 | 130 | -1.950.00 | 8.19 | 1.310.10 | 0.680.01 | 2.26 | 2.890.04 |
| DDO 69 | 0.8 | 22 | -2.220.01 | 6.84 | 0.270.05 | 0.190.01 | 0.76 | 0.760.01 |
| DDO 70 | 1.3 | 85 | -2.160.00 | 7.61 | 0.130.07 | 0.440.01 | 1.23 | 1.340.01 |
| DDO 75 | 1.3 | 44 | -1.070.01 | 7.86 | 0.71 0.08 | 0.180.01 | 1.17 | 1.380.01 |
| DDO 87 | 7.7 | 256 | -1.000.01 | 8.39 | 0.990.11 | 1.210.02 | 3.18 | 4.230.07 |
| DDO 101 | 6.4 | 236 | -2.810.01 | 7.36 | 1.160.11 | 0.970.06 | 1.23 | 1.230.06 |
| DDO 126 | 4.9 | 147 | -2.100.01 | 8.16 | 0.600.05 | 0.840.13 | 2.84 | 3.370.05 |
| DDO 133 | 3.5 | 195 | -2.620.01 | 8.02 | 2.250.24 | 1.220.04 | 2.60 | 2.200.03 |
| DDO 154 | 3.7 | 127 | -1.930.01 | 8.46 | 0.620.09 | 0.480.02 | 1.73 | 2.650.04 |
| DDO 155 | 2.2 | 114 | 7.00 | 0.200.04 | 0.150.01 | 0.67 | ||
| DDO 165 | 4.6 | 194 | 8.13 | 1.460.08 | 2.240.08 | 3.16 | ||
| DDO 167 | 4.2 | 126 | -1.830.01 | 7.18 | 0.560.11 | 0.220.01 | 0.81 | 0.700.04 |
| DDO 168 | 4.3 | 141 | -2.040.01 | 8.45 | 0.720.07 | 0.830.01 | 2.24 | 2.250.04 |
| DDO 187 | 2.2 | 63 | -1.980.01 | 7.12 | 0.280.05 | 0.370.06 | 0.30 | 0.420.02 |
| DDO 210 | 0.9 | 44 | -2.710.06 | 6.30 | 0.160.01 | 0.290.01 | ||
| DDO 216 | 1.1 | 84 | -3.210.01 | 6.75 | 1.770.45 | 0.520.01 | 0.42 | 0.590.01 |
| F564-V3 | 8.7 | 424 | -2.790.02 | 7.61 | 0.730.40 | 0.630.09 | 1.240.08 | |
| IC 10 | 0.7 | 19 | 7.78 | 0.300.04 | 0.390.01 | |||
| IC 1613 | 0.7 | 24 | -1.990.01 | 7.53 | 0.710.12 | 0.530.02 | 1.770.01 | |
| LGS 3 | 0.7 | 36 | -3.880.06 | 5.19 | 0.270.08 | 0.160.01 | 0.320.01 | |
| M81dwA | 3.6 | 122 | -2.260.01 | 7.18 | 0.380.03 | 0.270.00 | 0.710.03 | |
| NGC 1569 | 3.4 | 91 | -0.010.01 | 8.39 | 0.850.24 | 0.460.02 | 5.190.03 | |
| NGC 2366 | 3.4 | 106 | -1.660.01 | 8.85 | 2.570.80 | 1.910.25 | 5.58 | 6.790.03 |
| NGC 3738 | 4.9 | 140 | -1.530.01 | 8.06 | 1.160.20 | 0.770.01 | 1.48 | 1.210.05 |
| NGC 4163 | 2.9 | 106 | -1.740.01 | 7.16 | 0.710.48 | 0.320.00 | 0.88 | 0.470.03 |
| NGC 4214 | 3.0 | 101 | -1.080.01 | 8.76 | 0.830.14 | 0.750.01 | 5.460.03 | |
| SagDIG | 1.1 | 117 | -2.110.01 | 6.94 | 0.570.14 | 0.320.05 | 0.51 | 0.650.01 |
| UGC 8508 | 2.6 | 68 | 7.28 | 0.410.06 | 0.230.01 | 0.79 | ||
| WLM | 1.0 | 30 | -2.050.01 | 7.85 | 0.830.16 | 1.180.24 | 1.24 | 2.060.01 |
| Haro 29 | 5.8 | 173 | -1.070.01 | 7.80 | 1.150.26 | 0.330.00 | 0.96 | 0.860.06 |
| Haro 36 | 9.3 | 286 | -1.550.01 | 8.16 | 1.160.13 | 1.010.00 | 1.06 | 1.790.09 |
| Mrk178 | 3.9 | 110 | -1.660.01 | 6.99 | 0.380.00 | 0.190.00 | 1.17 | 1.450.04 |
| VII Zw 403 | 4.4 | 182 | -1.670.01 | 7.69 | 1.020.29 | 0.530.02 | 1.27 | 0.330.04 |
3 Cloud Identification
The cloud identifications were done with a program called CLOUDPROPS that runs under the Interactive Data Language (IDL) software (Rosolowsky & Leroy, 2006). CLOUDPROPS is a program originally built to identify molecular clouds by decomposing emission into peaks and associated intensity clumps that appear to be unique in position-velocity cubes. To use this program, we input the H i data cube for the galaxy of interest, the rms of individual H i channel maps in the cube, and the distance to the galaxy. We found that the program did not always locate clouds we could identify by eye in the integrated H i moment 0 map of the galaxy, so we experimented with four built-in, but optional, parameters in the code – BMFRIENDS, SPECFRIEND, DELTA, and BCLIP – to optimize them for our data.
3.1 BMFRIENDS
When searching for intensity peaks in the data cube, CLOUDPROPS identifies pixels with intensities greater than all of the other surrounding pixels in a box. BMFRIENDS or “beam friends” sets the length and width of this box. The program’s default for the length and width of the box is 3 beam sizes, BMFRIENDS=3. Decreasing the size of the box means there are more boxes in the space of the data cube, and if there are more boxes, usually more clouds are identified. This also affects the degree to which areas of emission are decomposed into smaller subregions. When choosing a value for this parameter, we considered that the same beam size covers a different physical area in a galaxy 1 Mpc away versus a galaxy 10 Mpc away, assuming the absolute cloud sizes are similar between galaxies.
To test the effects of changing BMFRIENDS on the clouds, we compared the clouds that the program found when we ran one galaxy through with a BMFRIENDS of 3, 4, 5, 6, 7 and 9. For each value of BMFRIENDS, the program largely identified the same clouds but picked up a few more clouds the lower the value of BMFRIENDS. For example, in going from a BMFRIENDS of 5 to 4, we found that in two cases the cloud peak was split into two smaller peaks. And in going from a BMFRIENDS of 5 to 6, we found that the opposite occurred and two peaks were combined into one larger peak. However, besides these two clouds, the clouds we found were reproducable for a range of reasonable parameters and the changes primarily affected the identification of tinier clouds.
Therefore, we used BMFRIENDS=6 as the standard for a galaxy at a distance of about 3.6 Mpc, and varied BMFRIENDS based on how far away other galaxies were: a larger BMFRIENDS for closer galaxies and a smaller BMFRIENDS for more distant galaxies.
3.2 SPECFRIENDS
SPECFRIENDS sets the depth in velocity channels of the same box that BMFRIENDS sets the angular length and width for. Because Hanning smoothing was applied during data processing, we input the requirement that a cloud must appear in a minimum of 3 velocity channels (MINVCHAN=3), but we also extended the SPECFRIENDS box. The default for SPECFRIENDS is one velocity channel. Extending the box had the consequence of decreasing the number of clouds found per galaxy, but we found that SPECFRIENDS of 5 worked well and we used this value for SPECFRIENDS for all galaxies.
3.3 DELTA
DELTA designates how much a peak must stand out above the noise and other gas in the galaxy to be selected. As part of the iterative decomposition process, for each pair of peaks, CLOUDPROPS defines the highest surface brightness level that includes both peaks as the “merge level”. As a default, the program will only consider peaks that have an intensity that is 2rms above the merge level, which corresponds to DELTA=2. Below 2rms, the decomposition is more likely to identify noise as cloud peaks. We increased DELTA to 2.2, meaning the peak must be 2.2rms greater than the merge level, in order to pick up less noise in the cloud identification step. We held DELTA constant for all galaxies.
3.4 BCLIP
BCLIP is used to vary how likely it is that CLOUDPROPS will identify substructure within a cloud as individual, smaller clouds. BCLIP defaults to infinity such that no pixels are altered to reduce their contrast. By setting BCLIP, the program decreases the contrast of pixels above a specified intensity, assumes intensities above this level are associated with clouds, and uses the reduced contrast data in the decomposition. BCLIP is set in intensity units of the data, in our case Jy bm-1. Decreasing BCLIP has the effect of decreasing the number of clouds found. We used BCLIP = 0.01 Jy bm-1 because we found that this value generally neither clumped clouds together that we felt should be separate nor separated substructure into individual clouds.
3.5 Solving problems with CLOUDPROPS
For both DDO 75 and DDO 133 the program entirely avoided particular large regions of the galaxy where there were obvious clumps of gas. We tried adjusting the parameters and found none that would make the program touch those parts of the galaxy. For these two galaxies, we cut out sub-cubes from the emission data cubes. We ran these sub-cubes through CLOUDPROPS and this allowed the program to pick up the clouds in each region. We then combined the clouds from the different searches into one catalog for each galaxy.
3.6 Completeness
3.6.1 Comparison to finding clouds by hand
The advantages to using an automatic algorithm for finding clouds are clear: no human biases and much less time intensive. With the parameters discussed above, CLOUDPROPS ran well, for the most part, on our H i data cubes. To see how identifying clouds by hand compares with the catalogues produced by CLOUDPROPS, we identified clouds by hand in 10 galaxies from our sample. “By hand” means that we examined the H i cube channel by channel looking for coherent structures that were present over at least three channels. The test galaxies were chosen to have at least several clouds but not more than 20 to keep this test feasible.
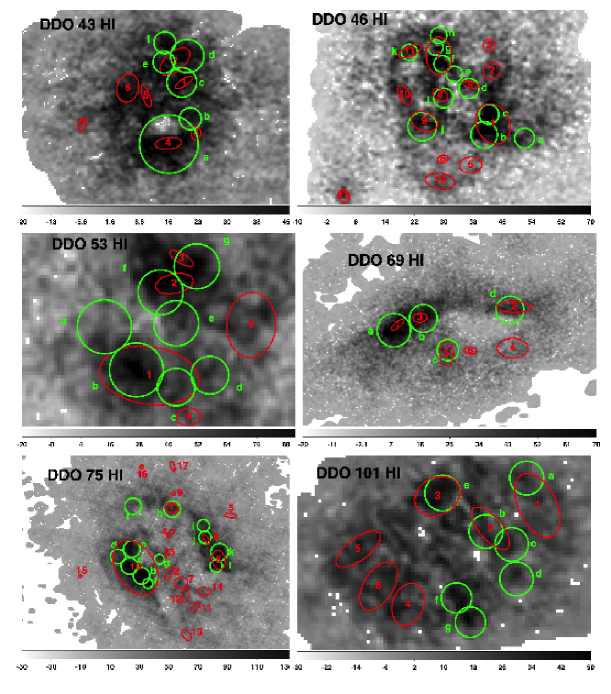
Figure 1 outlines the clouds we identified by hand and those identified by CLOUDPROPS on the integrated H i moment 0 maps of the galaxies. We identified a total of 85 clouds by hand in the 10 galaxies, and CLOUDPROPS identified 74. We missed 33 of the clouds that CLOUDPROPS identified and identified 26 clouds that CLOUDPROPS had not identified. There were 13 occurrences of multiple clouds that we identified by hand being parts of single CLOUDPROPS clouds, but only once were our clouds combined into a single cloud by CLOUDPROPS.
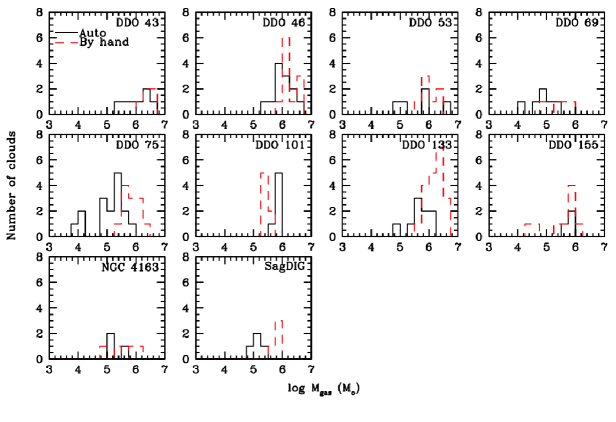
Figure 2 shows a histogram of the cloud masses that were identified by hand compared to the histogram of the clouds in the CLOUDPROPS catalogues. (The masses of the clouds are discussed in more detail in the next section). The clouds identified by hand tend to be at the more massive end of the range of masses found by CLOUDPROPS in several of the galaxies.
![[Uncaptioned image]](/html/1904.13381/assets/x2.png)
3.6.2 Finding added clouds
To examine how well the program finds clouds for which we have prior knowledge, we added clouds found in one galaxy to another galaxy and ran CLOUDPROPS with the original parameters for the host galaxy. A cloud was added to a galaxy by summing the data cube of the galaxy being tested with the data cube of the cloud. The data cube of the cloud was produced by using the CLOUDPROPS mask for that cloud to replace with zero all pixels in the original galaxy data cube that do not belong to the cloud, producing a RA-Decl-Velocity data cube of just the cloud. Since different galaxies have different radial velocities and numbers of velocity channels, as well as RA and Decl, we simply summed pixels with the velocity axis of the cloud centered on the central velocity channel of the galaxy to which it was being added.
In particular we chose DDO 168 as the test host galaxy because it is of moderate size, at a distance (4.3 Mpc) not too different from the median distance for our sample (3.6 Mpc), and has a reasonable number of clouds of its own (21). We added the clouds identified in DDO 154 (distance 3.7 Mpc and 34 clouds), DDO 165 (distance 4.6 Mpc, 11 clouds), and NGC 2366 (distance 3.4 Mpc, 48 clouds) in three separate runs of CLOUDPROPS. We eliminated added clouds that fell outside the H i disk of DDO 168 and clouds that overlay DDO 168’s own identified clouds.
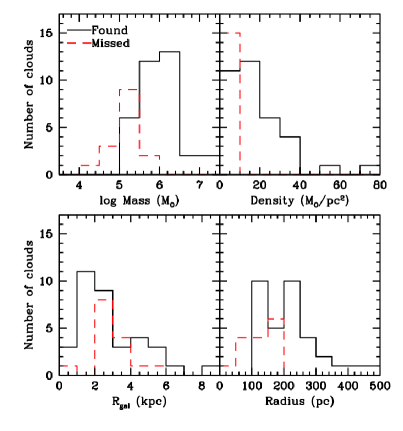
We ended with 15 added clouds that were missed and 35 added clouds that were found. Histograms of the mass, density, distance from the center of DDO 168 in the plane of the galaxy, and radius of the missed and found clouds are shown in Figure 3. We see that missed clouds tend to be less massive than ☉, have surface densities lower than ☉ pc-2, and be smaller than 200 pc in radius. In terms of distance from the center of the galaxy, the missed clouds are primarily found at middle radii. The catalogues that are given here are unlikely to be complete except for the most massive clouds ( ☉). However, the program did pick out a representative sample of clouds from each galaxy.
3.7 Extracting Properties from CLOUDPROPS
For each galaxy, CLOUDPROPS outputs a catalog of clouds and their properties. The properties that we were interested in included position of the cloud in the galaxy; the central velocity and the velocity dispersion ; the moment 2 of the emission along the major and minor axes of the cloud (, ); the radius of the cloud; the position angle (P. A.) of the major axis of the cloud; the signal to noise of the peak intensity of the cloud; and a mask that identifies the pixels in the H i data cube that belong to the cloud. All of our clouds have emission peaks with signal-to-noise greater than 4.
The rms spatial size determined by CLOUDPROPS from the moment 2 of the cloud emission is , and the radius of the cloud is given by . The factor of 1.91 comes from Solomon et al. (1987)’s definition of a cloud radius for giant molecular clouds. Versions of the radius of the cloud were also given in which the radius is deconvolved with the size of the beam, extrapolated to an edge temperature of 0 K, or both. The extrapolation to an edge is more uncertain for clouds, like H i clouds, that are sitting within extended emission than with molecular clouds whose contrast with their surroundings may be higher. We have chosen, therefore, to use radii without either deconvolution or extrapolation to 0 K, as did Kim et al. (2007) in their study of LMC clouds. We use the CLOUDPROPS moment 2 size with its factor of 1.91 to convert to cloud radius, but note that Kim et al. (2007) used , where the factor comes from one-half of the FWHM of a two-dimensional Gaussian distribution.
We examined a position-velocity (p-v) diagram for each cloud to make sure that it was separated in velocity space from other gas. To make the p-v diagram, we summed the data cube over the Declination covered by the cloud. We also used the mask generated by CLOUDPROPS as a conditional transfer to produce a cube with non-cloud pixels blanked. We summed the velocity channels for these cloud-specific cubes, to produce a moment 0 image of each cloud. We then integrated the total flux of each cloud and determined its mass and surface density , where the H i mass is multiplied by 1.36 to include Helium. The surface density is the mass divided by the area of the ellipse defined by and the minor-to-major axis ratio. We also determined the distance of the cloud from the center of the galaxy in the plane of the galaxy . Finally, we determined the virial parameter .
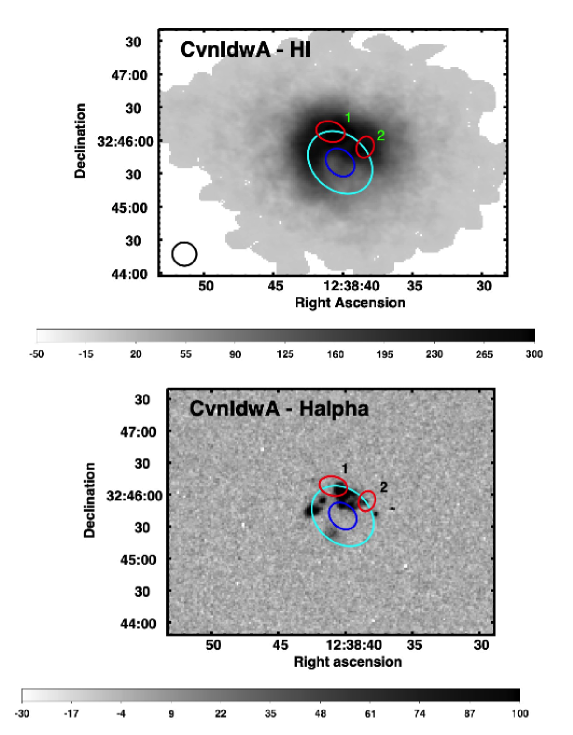
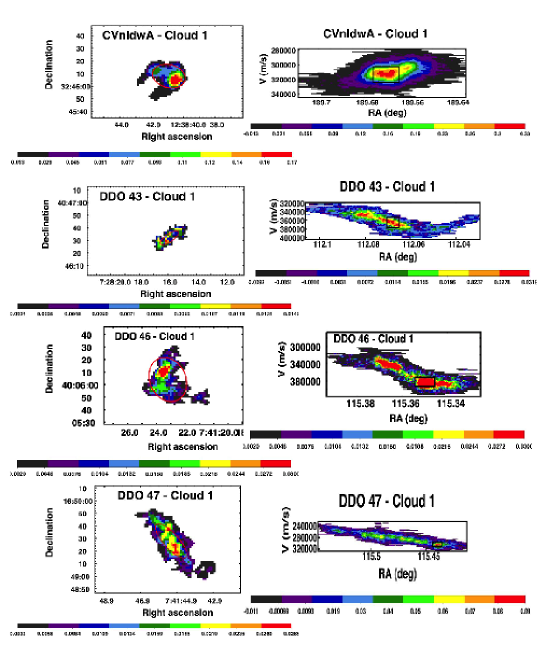
The clouds identified in each galaxy are listed in Table 2 and outlined on the galaxy integrated H i map and H image, if there is H emission, in Figure 4. The ellipses denoting the clouds represent the major and minor axes and position angle as described above. In Figure 5 we include the cloud moment 0 and p-v diagram of cloud No. 1 in each galaxy. Since the first cloud in the catalog is not first because of any property of the cloud itself, this illustrates a range of cloud masses and sizes. The red ellipse on each cloud in Figure 5 is the same as that in Figure 4.
The uncertainty in the cloud masses given in Table 2 are calculated from the channel rms, , given by Hunter et al. (2012) for the H i RA-Decl-Velocity data cubes. We multiply this by the square-root of the number of summed velocity channels, , in the cloud and the square-root of the number of beams in the cloud area, . The rms in mJy is then converted to solar mass by multiplying by , where delV is the channel separation. Thus, and .
The uncertainty in the gas density, , is derived from the uncertainty in the mass and the uncertainty in : and , where . The uncertainty in , , is derived from the uncertainties in the velocity dispersion, , and mass: and .
| R. A. | Decl. | P. A. | |||||||||||
|---|---|---|---|---|---|---|---|---|---|---|---|---|---|
| Galaxy | Cloud | (h m s) | (d m s) | (km s-1) | (deg) | (pc) | Peak S/N | (km s-1) | (M☉) | (M☉pc-2) | (kpc) | ||
| CVnIdwA | 1 | 12 38 40.9 | 32 46 08 | 312.4 | 76.2 | 22921 | 0.69 | 24.3 | 2.90.3 | 6.250.01 | 15.62.1 | 0.6 | 1.30.1 |
| 2 | 12 38 38.4 | 32 45 54 | 301.7 | -21.2 | 17019 | 0.78 | 25.5 | 2.90.3 | 6.020.01 | 14.72.5 | 0.6 | 1.60.2 | |
| DDO 43 | 1 | 7 28 15.9 | 40 46 32 | 366.6 | -55.6 | 32936 | 0.35 | 7.4 | 4.91.0 | 6.210.02 | 13.42.3 | 1.2 | 5.70.7 |
| 2 | 7 28 16.6 | 40 46 50 | 364.0 | -49.9 | 59153 | 0.52 | 7.4 | 6.50.7 | 6.390.03 | 4.30.7 | 1.9 | 11.81.4 | |
| 3 | 7 28 15.0 | 40 45 48 | 361.7 | -4.1 | 21953 | 0.73 | 7.2 | 1.10.8 | 5.470.05 | 2.61.0 | 1.7 | 1.10.3 | |
| 4 | 7 28 17.1 | 40 45 39 | 355.6 | -84.3 | 43639 | 0.44 | 8.5 | 3.90.4 | 6.640.01 | 16.52.3 | 1.5 | 1.80.2 | |
| 5 | 7 28 18.8 | 40 46 20 | 352.2 | 18.9 | 38462 | 0.31 | 6.2 | 2.40.5 | 5.910.03 | 5.61.4 | 0.8 | 3.20.6 | |
| 6 | 7 28 20.2 | 40 46 27 | 346.2 | -15.5 | 47352 | 0.73 | 6.5 | 3.60.7 | 6.350.03 | 4.40.8 | 1.6 | 3.20.4 | |
| 7 | 7 28 23.7 | 40 45 55 | 337.7 | -15.5 | 21436 | 0.61 | 5.4 | 2.10.6 | 5.610.04 | 4.61.3 | 2.7 | 2.70.5 | |
| DDO 46 | 1 | 7 41 23.2 | 40 06 04 | 385.6 | 24.6 | 53732 | 0.79 | 9.7 | 5.30.5 | 6.950.01 | 12.51.2 | 1.5 | 2.00.1 |
| 2 | 7 41 23.3 | 40 06 50 | 390.9 | -44.2 | 23328 | 0.85 | 5.6 | 5.61.1 | 5.960.04 | 6.21.3 | 1.0 | 9.41.4 | |
| 3 | 7 41 23.5 | 40 07 12 | 380.6 | 1.7 | 17226 | 0.89 | 4.8 | 3.50.7 | 5.700.04 | 6.01.5 | 1.4 | 5.00.9 | |
| 4 | 7 41 24.9 | 40 06 38 | 377.0 | 76.2 | 22349 | 0.35 | 6.4 | 3.60.7 | 5.920.02 | 15.25.1 | 0.4 | 4.00.9 | |
| 5 | 7 41 24.9 | 40 05 28 | 368.0 | -84.3 | 29029 | 0.71 | 5.1 | 3.50.7 | 5.870.04 | 3.90.7 | 2.4 | 5.60.8 | |
| 6 | 7 41 27.0 | 40 05 33 | 356.1 | -72.8 | 14331 | 0.73 | 5.8 | 3.10.6 | 5.350.07 | 4.81.8 | 2.2 | 7.11.9 | |
| 7 | 7 41 27.3 | 40 07 03 | 353.4 | 1.7 | 48224 | 0.68 | 8.1 | 9.00.9 | 6.740.01 | 11.20.9 | 0.9 | 8.20.5 | |
| 8 | 7 41 27.2 | 40 06 29 | 348.4 | 59.0 | 21021 | 0.69 | 7.2 | 5.40.5 | 6.150.02 | 14.82.4 | 0.5 | 5.00.6 | |
| 9 | 7 41 28.4 | 40 06 06 | 343.2 | 70.4 | 35339 | 0.67 | 6.6 | 4.50.5 | 6.310.02 | 7.71.3 | 1.3 | 4.10.5 | |
| 10 | 7 41 29.9 | 40 06 29 | 329.1 | 30.3 | 27333 | 0.50 | 6.1 | 4.20.4 | 6.110.02 | 11.02.1 | 1.3 | 4.30.6 | |
| 11 | 7 41 29.5 | 40 07 07 | 335.7 | -67.1 | 30631 | 0.43 | 7.5 | 3.80.8 | 6.200.02 | 12.41.9 | 1.5 | 3.20.3 | |
| 12 | 7 41 27.2 | 40 05 14 | 357.7 | 81.9 | 38030 | 0.53 | 5.5 | 4.90.5 | 6.390.02 | 10.11.3 | 2.9 | 4.30.4 | |
| 13 | 7 41 34.5 | 40 05 01 | 314.8 | 30.3 | 17421 | 0.78 | 5.2 | 5.51.1 | 5.910.03 | 10.92.1 | 4.3 | 7.61.1 |
Note. — Table 2 is published in its entirety in the electronic edition of the journal. A portion is shown here for guidance regarding its form and content.
4 Results
4.1 Cloud Properties
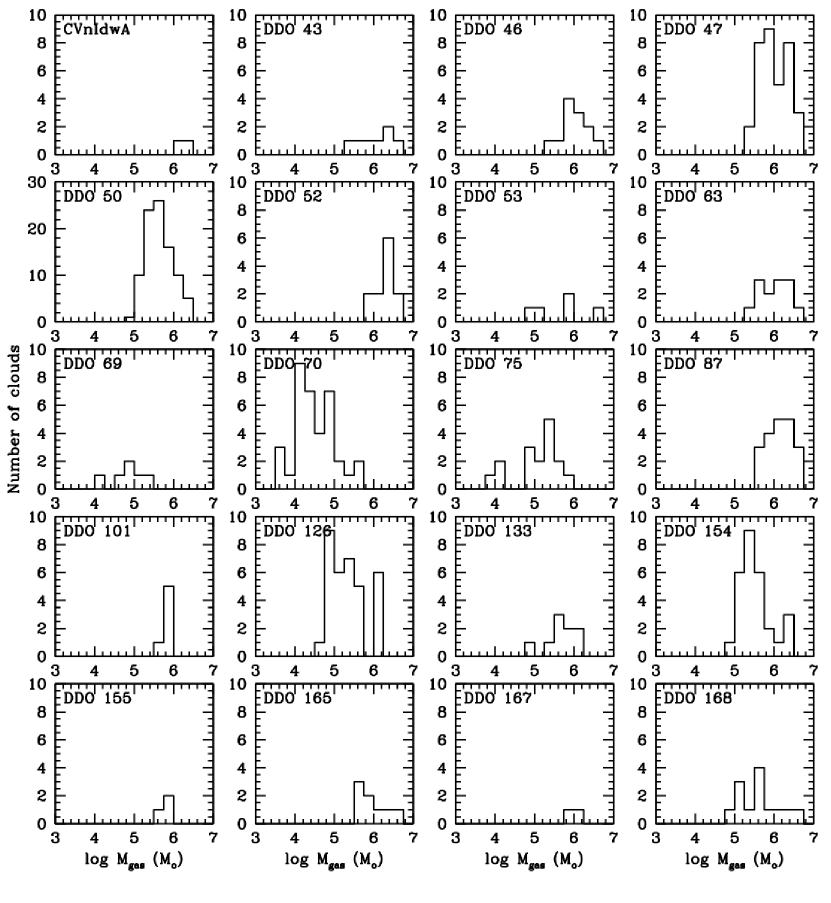
Table 2 gives the properties of the individual clouds including position, central velocity, position angle, major axis radius , minor-to-major axis ratio, signal-to-noise (S/N) of the peak, velocity dispersion , mass of gas (H i plus He), gas surface density , radius from the center of the galaxy in the plane of the galaxy , and the virial ratio . There are 814 clouds in 40 galaxies, and individual galaxies have from one cloud (DDO 210, M81dwA) to 161 clouds (NGC 4214). The number of clouds identified in each galaxy are given in Table 3. Cloud mass functions are plotted as histograms in Figure 6.
| aaH i mass of third most massive cloud for galaxies with at least three clouds. | FractionbbFraction of clouds beyond the extent of , , , and . | FractionbbFraction of clouds beyond the extent of , , , and . | FractionbbFraction of clouds beyond the extent of , , , and . | FractionbbFraction of clouds beyond the extent of , , , and . | ||||
|---|---|---|---|---|---|---|---|---|
| Galaxy | No. Clouds | (☉) | (☉) | beyond | beyond | beyond | beyond | |
| CVnIdwA | 2 | 6.32 | 0.05 | 1.00 | 1.00 | 0.00 | 1.00 | |
| DDO 43 | 7 | 6.95 | 0.05 | 6.35 | 0.71 | 0.86 | 0.14 | 0.14 |
| DDO 46 | 13 | 7.30 | 0.11 | 6.39 | 0.69 | 0.69 | 0.38 | 0.08 |
| DDO 47 | 35 | 7.57 | 0.09 | 6.50 | 0.94 | 0.17 | 0.17 | |
| DDO 50 | 92 | 7.60 | 0.06 | 6.33 | 0.72 | 0.87 | 0.21 | |
| DDO 52 | 13 | 7.42 | 0.10 | 6.59 | 0.38 | 0.85 | 0.15 | 0.31 |
| DDO 53 | 5 | 6.70 | 0.10 | 5.81 | 0.20 | 0.80 | 0.00 | 0.00 |
| DDO 63 | 13 | 7.13 | 0.09 | 6.28 | 0.38 | 1.00 | 0.00 | 0.00 |
| DDO 69 | 6 | 5.66 | 0.06 | 4.91 | 1.00 | 1.00 | 0.17 | 0.17 |
| DDO 70 | 36 | 6.27 | 0.05 | 5.38 | 1.00 | 0.94 | 0.64 | 0.58 |
| DDO 75 | 17 | 7.17 | 0.20 | 5.68 | 0.71 | 0.94 | 0.35 | 0.24 |
| DDO 87 | 20 | 7.42 | 0.11 | 6.59 | 1.00 | 0.90 | 0.55 | 0.35 |
| DDO 101 | 6 | 6.53 | 0.15 | 5.94 | 0.67 | 0.83 | 0.50 | 0.50 |
| DDO 126 | 34 | 6.97 | 0.07 | 6.08 | 0.94 | 0.94 | 0.26 | 0.15 |
| DDO 133 | 10 | 7.12 | 0.12 | 6.05 | 0.30 | 0.80 | 0.10 | 0.30 |
| DDO 154 | 28 | 7.09 | 0.04 | 6.40 | 0.93 | 0.96 | 0.71 | 0.50 |
| DDO 155 | 3 | 6.25 | 0.18 | 5.99 | 1.00 | 1.00 | 0.00 | |
| DDO 165 | 9 | 7.18 | 0.11 | 6.35 | 0.78 | 0.33 | 0.11 | |
| DDO 167 | 2 | 6.25 | 0.12 | 0.50 | 1.00 | 0.00 | 0.00 | |
| DDO 168 | 14 | 7.27 | 0.07 | 6.41 | 0.93 | 0.93 | 0.43 | 0.43 |
| DDO 187 | 2 | 5.82 | 0.05 | 0.50 | 0.00 | 0.50 | 0.00 | |
| DDO 210 | 1 | 6.02 | 0.53 | 0.00 | 0.00 | |||
| DDO 216 | 3 | 5.80 | 0.11 | 5.40 | 0.00 | 0.33 | 0.67 | 0.00 |
| F564-V3 | 4 | 6.11 | 0.03 | 5.65 | 1.00 | 1.00 | 0.50 | |
| IC 10 | 69 | 6.33 | 0.04 | 5.33 | 0.96 | 0.88 | ||
| IC 1613 | 93 | 6.46 | 0.09 | 5.33 | 0.94 | 0.98 | 0.41 | |
| LGS 3 | 4 | 3.89 | 0.05 | 3.24 | 0.00 | 0.25 | 0.00 | |
| M81dwA | 1 | 5.49 | 0.02 | 1.00 | 1.00 | 0.00 | ||
| NGC 1569 | 26 | 6.78 | 0.02 | 5.87 | 0.81 | 0.92 | 0.00 | |
| NGC 2366 | 44 | 7.58 | 0.05 | 6.53 | 0.80 | 0.84 | 0.09 | 0.00 |
| NGC 3738 | 6 | 7.17 | 0.13 | 5.70 | 1.00 | 1.00 | 1.00 | 1.00 |
| NGC 4163 | 3 | 5.64 | 0.03 | 5.06 | 0.00 | 0.67 | 0.00 | 0.33 |
| NGC 4214 | 161 | 7.73 | 0.09 | 6.52 | 0.98 | 0.99 | 0.17 | |
| SagDIG | 4 | 5.65 | 0.05 | 5.22 | 0.50 | 1.00 | 0.75 | 0.25 |
| UGC 8508 | 3 | 6.27 | 0.10 | 5.96 | 0.67 | 0.67 | 0.33 | |
| WLM | 11 | 6.23 | 0.02 | 5.44 | 0.82 | 0.64 | 0.46 | 0.09 |
| Haro 29 | 3 | 6.18 | 0.02 | 5.59 | 0.67 | 0.67 | 0.67 | 0.67 |
| Haro 36 | 5 | 7.23 | 0.12 | 6.53 | 0.40 | 0.40 | 0.40 | 0.20 |
| Mrk 178 | 2 | 6.26 | 0.18 | 1.00 | 1.00 | 0.00 | 0.00 | |
| VII Zw 403 | 4 | 6.59 | 0.08 | 5.22 | 0.50 | 0.75 | 0.50 | 1.00 |
![[Uncaptioned image]](/html/1904.13381/assets/x8.png)
In Figure 7 we plot the mass of the cloud against the size of the cloud. Kim et al. (2007) surveyed the LMC and identified 468 H i clouds in that galaxy. The cloud masses identified by Kim et al. (2007) vary from ☉ to M☉ and ours vary from ☉ to M☉. The LMC radii are mostly between 10 pc and 200 pc for a brightness threshold of 16 K (their Figure 11) while ours vary from 15 pc to 800 pc. The biggest cloud in our study is found in DDO 52 (820 pc), the most distant galaxy in our sample with a beam size of 300 pc, and the second and third largest clouds (720 pc, 700 pc) are found in DDO 87 with a beam size of 256 pc. This is what one would expect if clouds are merging into larger complexes at the lower spatial resolution of more distant galaxies. However, the fourth largest cloud (695 pc) is found in DDO 133 at 3.5 Mpc with a beam size of 195 pc, and a cloud of radius 540 pc is found in DDO 75 with a beam size of only 44 pc.
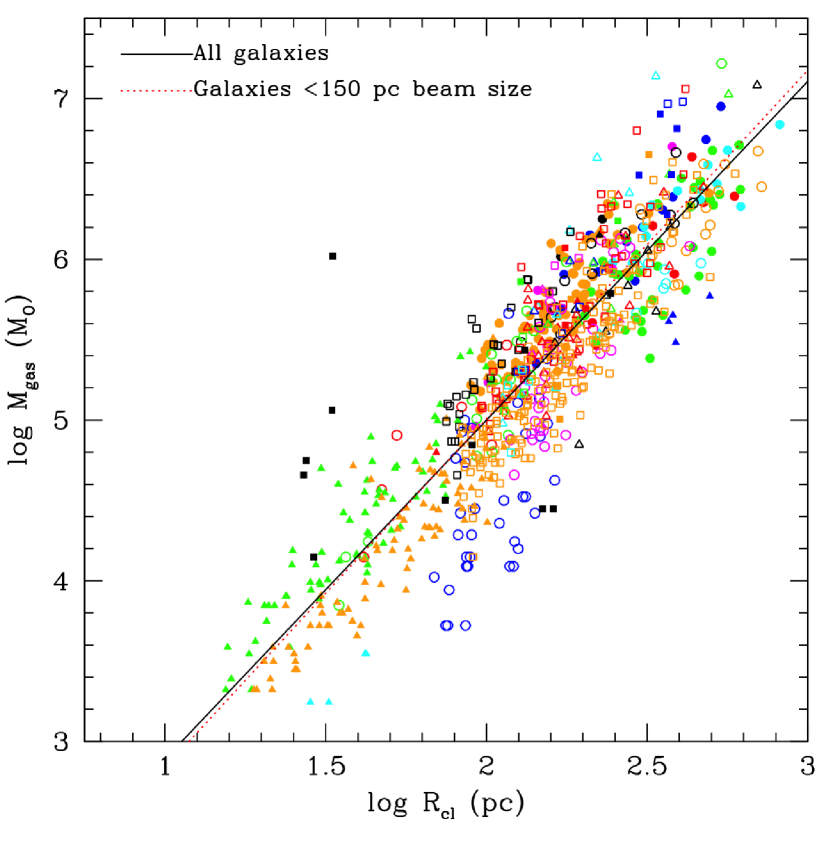
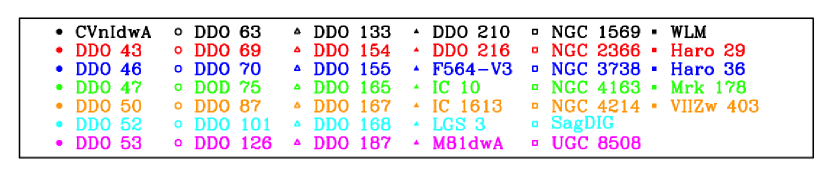
We see that generally the larger the cloud, the more massive it is, although we see that the clouds in DDO 70 (open blue circles) do fall systematically to lower gas mass for a given radius compared to the rest of the galaxies. The solid black line is a fit to all 814 of our clouds: . The dotted red line is a fit to the 643 clouds in galaxies with beam sizes pc: . The relationship found by Kim et al. (2007) for clouds in the LMC has a slope of 2.05, which is similar to our slope of 2.110.04.
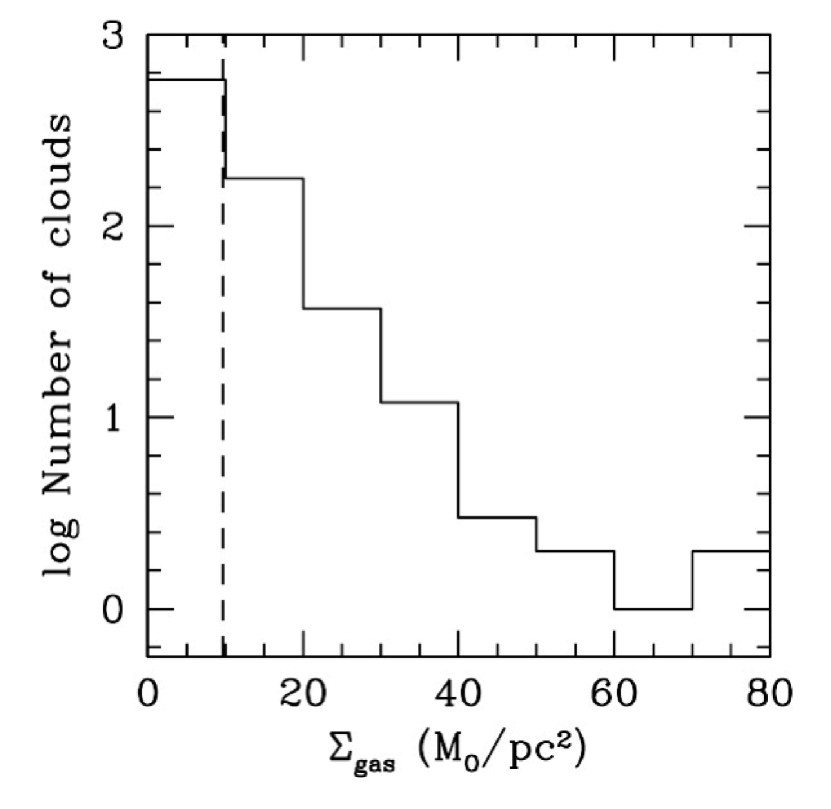
In Figure 8 we plot a histogram of the cloud gas surface densities for all clouds in the sample. Most clouds have densities less than 10 M☉ pc-2 and the numbers fall off out to 80 M☉ pc-2. The density averaged over all clouds, marked by a vertical dashed line, is 9.65 M☉ pc-2. By contrast the average surface density found by Kim et al. (2007) for LMC clouds was 4.8 M☉ pc-2, 2.5 M☉ pc-2, and 1.3 M☉ pc-2 for their threshold temperatures of 64 K, 32 K, and 16 K, respectively. Kim et al. (2007) selected three different brightness temperature thresholds for identifying pixels belonging to a single cloud in their study: 64 K, 32 K, 16 K. The lower the brightness temperature, the more clouds grow and merge into one. Most of our clouds have densities higher than theirs.
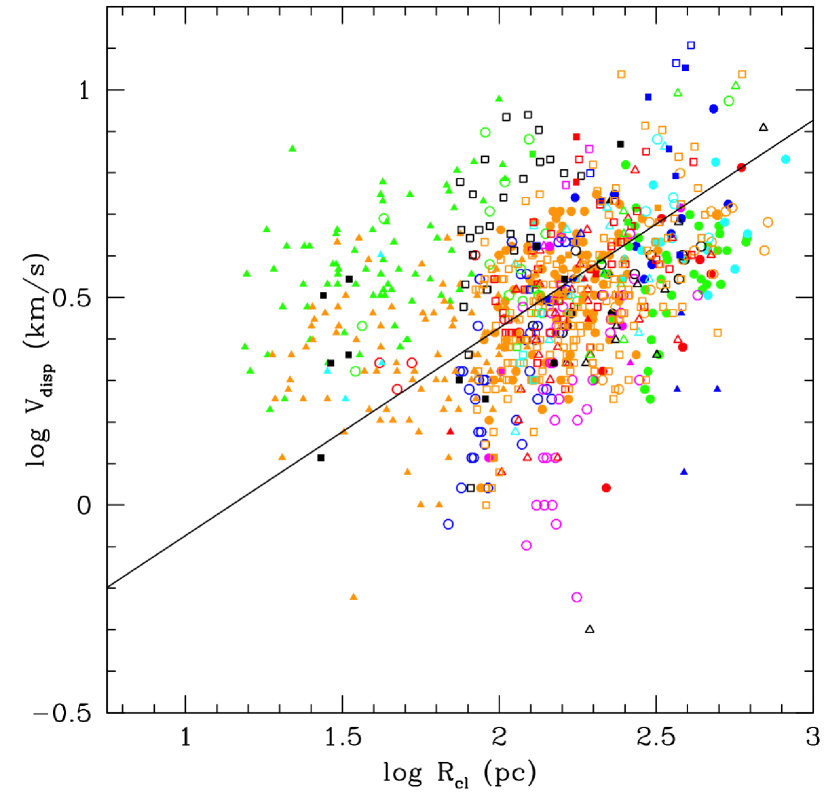
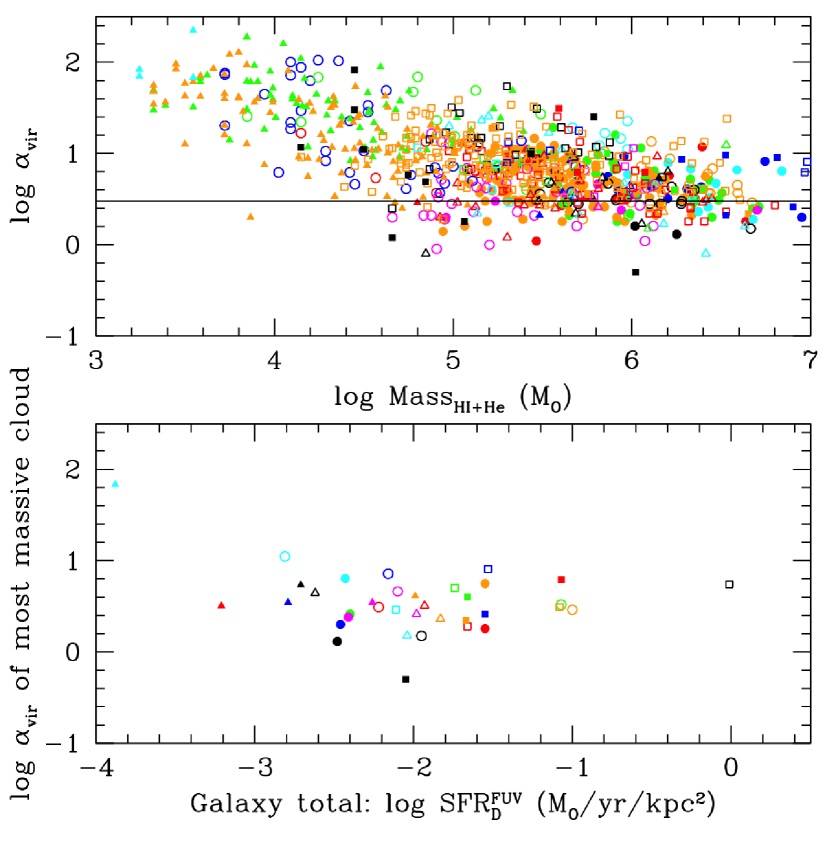
In Figure 9 we plot the logarithm of the velocity dispersion as a function of the logarithm of the size of the cloud . There is a very large amount of scatter but generally the larger the cloud, the higher the velocity dispersion. We plot this in log-log space in order to compare with the results for the LMC by Kim et al. (2007). The solid line in the figure is the LMC relationship plus a constant determined by our cloud sample: . Our clouds follow this trend but with lots of scatter. Our sizes cover the same range as those for the LMC clouds that were identified with a threshold of .
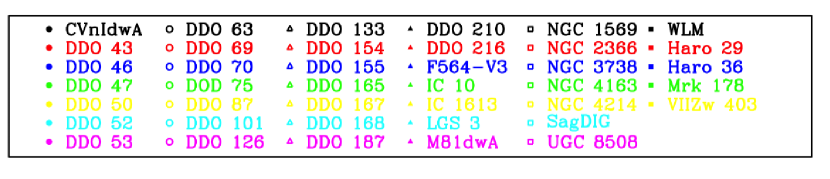
In the top panel of Figure 10 we plot against cloud gas mass for all of the clouds. The solid horizontal line marks the lower limit for most of the clouds from the Kim et al. (2007) study of clouds in the LMC. Our clouds have values like those of the LMC clouds but extend the range to higher . We see a trend of lower for higher cloud mass. In the bottom panel of Figure 10 we plot the value of the most massive cloud in each galaxy against the galaxy integrated star formation rate (SFR). We do not see any trend; there is not much of a range in for a large range of SFR. 36% of the clouds are essentially non-self-gravitating from H i alone, with a virial parameter that exceeds , and 5% have .
4.2 Integrated Properties
Table 3 gives the number of clouds identified in each galaxy, the total mass in those clouds, the ratio of cloud mass to total H i mass of the galaxy, the mass of the third most massive cloud in galaxies with at least three clouds, the fraction of clouds beyond the break radius , the fraction beyond one disk scale length , the fraction beyond the extent of H emission , and the fraction beyond the furthest FUV knot . The break radius is the radius at which the slope of the -band surface brightness profile of the galaxy changes sharply, usually down-bending (Herrmann et al., 2013). Only two of our galaxies do not show such a break in the outer disk: DDO 47 and DDO 210.
The number of clouds in a galaxy varies from one cloud in DDO 210 and M81dwA to 161 clouds in NGC 4214. The number of clouds is plotted against the integrated absolute magnitude of the galaxy in Figure 11. We see that galaxies with M have less than about 10 clouds. For galaxies brighter than this, the number of clouds ranges from a few to hundreds. We also plot against the distance of the galaxy in Figure 11 in order to see if spatial resolution is a factor in how many clouds are identified. We find that the five galaxies with more than 50 clouds are located within 4 Mpc.
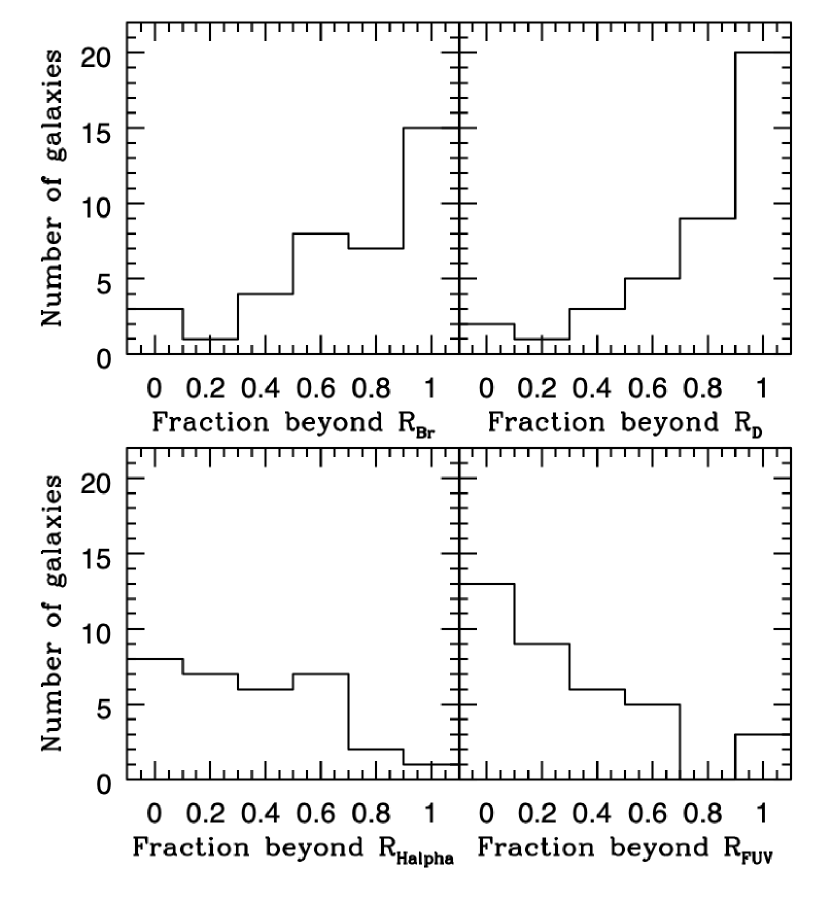
The clouds are found from near the center of the galaxy, such as 0.1 in DDO 126, out to 11 in DDO 154, showing that clouds exist both in the inner and in the far outer disk. In Figure 12 we plot a histogram of the number of galaxies as a function of the fraction of clouds beyond and the fraction beyond . In many galaxies over half of the clouds are found beyond these two radii that mark the outer disk.
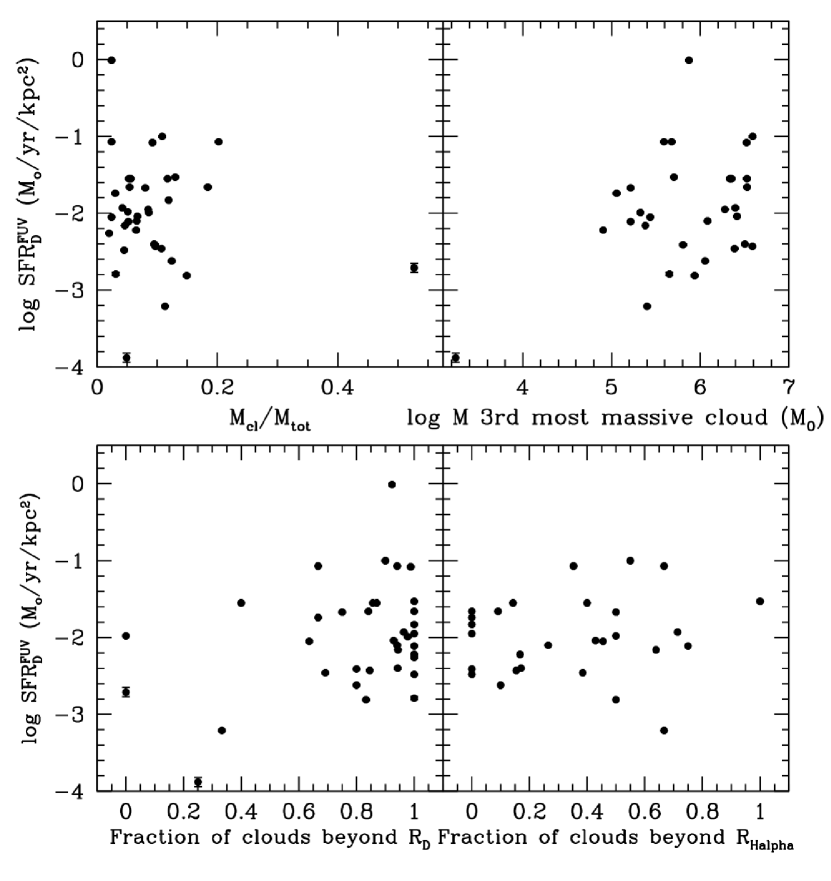
In Figure 13 we plot the galactic SFR surface density (integrated SFR divided by the area in one disk scale length in order to normalize the SFRs) against various global cloud parameters: fraction of total gas mass in the identified clouds, the mass of the third largest cloud, and the fraction of clouds beyond one disk scale length. Aside from a slight trend with the fraction of clouds beyond , we do not see any convincing relationship with SFR surface density.
4.3 Location of clouds with respect to star forming regions
In Figure 4 we show the location of the clouds on H images of those galaxies with H emission. Note that our H images do not cover the entire galaxy for DDO 50, IC 10, IC 1613, and NGC 4214. Most of the H i clouds in the central regions are associated with or next to H ii regions. Of our 40 galaxies, 29 have H ii region catalogues from Youngblood & Hunter (1999). There are 349 H i clouds in those galaxies, and of those, 223 clouds, or 64%, are not adjacent to or overlapping with an H ii region. Even galaxies without any H ii regions (LGS 3, M81dwA, DDO 210), nevertheless, have H i clouds.
In Figure 12 the lower left panel shows the number of galaxies with a given fraction of clouds beyond the extent of detected H emission (Hunter & Elmegreen, 2004). Most galaxies have some clouds beyond . In Figure 13 the bottom right panel shows the fraction of clouds beyond as a function of the galaxy-wide SFR surface density of the galaxy. There is no relationship.
5 Dark Molecular Hydrogen
Although only a small fraction, %, of H i in these galaxies has been catalogued here in the form of discrete clouds (cf. Fig. 13 top left), there is still an expectation that star formation in the form of H ii regions or far-ultraviolet (FUV) should correlate with clouds of some type, and most likely with dense, self-gravitating clouds, as observed nearly everywhere in the Milky Way and other nearby spiral galaxies (McKee & Ostriker, 2007). These clouds tend to be CO-emitting molecular clouds in more metal-rich galaxies like the Milky Way, so it is a reasonable assumption that CO-weak molecular clouds are associated with star formation in the low-metallicity dwarf irregulars studied here (e.g., Leroy et al., 2011; Bolatto et al., 2013; Rubio et al., 2015; Shi et al., 2015; Madden & Cormier, 2019). Such molecular clouds would not necessarily show up as discrete H i clouds if their atomic hydrogen is in an envelope that blends with the H i emission from the diffuse intercloud medium. This is essentially the model of Shaya & Federman (1987), namely H i occurs primarily in the optically thin regions of the interstellar medium and the optically thick gas is molecular whether or not it shows up in CO.
There are three indications that star formation in our survey is associated with dark molecular gas. First, a relatively high fraction of the identified H i clouds are outside the galactic radii where there are clear indications of star formation. This was shown in Figure 12 and by a slight upward trend in the lower left panel of Figure 13, where higher star formation rate surface densities have proportionally more of their H i clouds in the outer regions. Presumably, these high regions are rich in molecular gas. A similar conclusion was made by Leroy et al. (2008) and others (see review by Madden & Cormier, 2019).
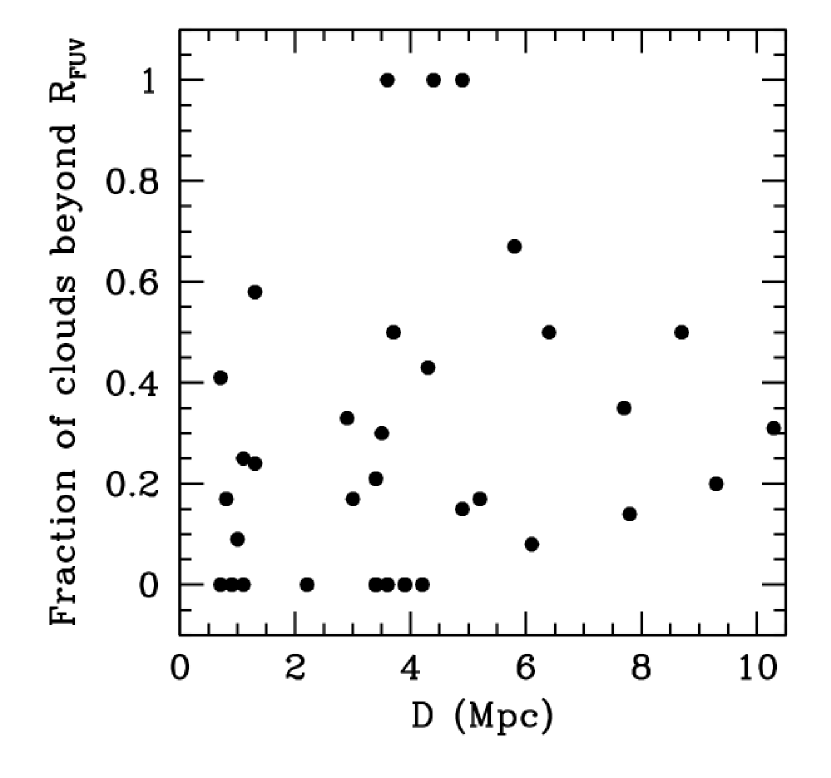
This point is illustrated further by Figure 12 (lower right panel), which shows a histogram of the number of galaxies with certain fractions of their H i clouds beyond the edge of the FUV disk. This figure complements that on the lower left side of Figure 12, which is for H. ( and are given in Table 1). In Figure 12, 22% of the galaxies have less than half of their H i clouds in the FUV disk where star formation occurs (i.e., 8/36 of the galaxies have a value on the abscissa that is greater than 0.5). Similarly, 32% (10/31) of the galaxies have more than 50% of their H i clouds beyond . In these galaxies, most H i clouds are unrelated to star formation and most star formation must be occurring in clouds that do not show up as discrete H i objects with our sensitivity and resolution. To examine the effect that resolution has on this result, we plot the fraction of clouds beyond against distance to the galaxy in Figure 14. There we see that the galaxies within 4 Mpc, which are also the galaxies with highest spatial resolution for a given cloud size, cover the same range in fraction of clouds beyond as the more distant galaxies. The difference is that galaxies with no clouds beyond are all within 4 Mpc. We conclude that resolution caused by distance to the galaxy is not generally skewing our conclusion that a large fraction of the galaxies in our sample have H i clouds unrelated to star formation.
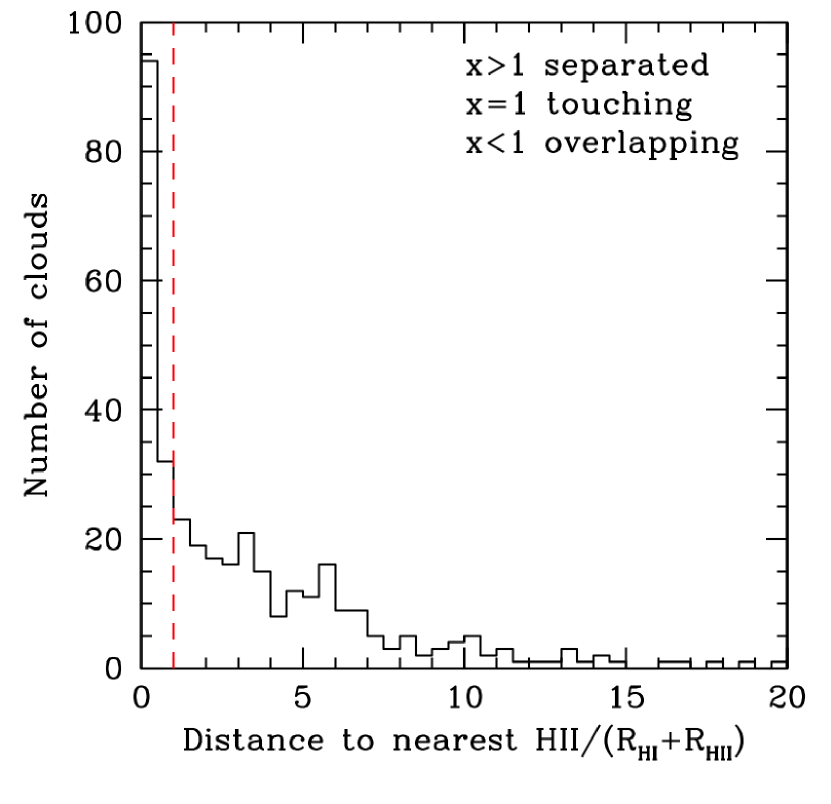
Secondly, most H ii regions lie outside the edges of giant H i clouds or far from these clouds. Figure 15 shows a histogram of the number of H i clouds at certain distances from the nearest H ii region, normalized to the sum of the cloud and H ii region radii. When this normalized distance exceeds unity, which it does for % of the clouds, the nearest H ii region is associated with star formation that has either destroyed or pushed away the adjacent regions of its primordial cloud, or has its stars forming in dark gas of some type. The first possibility seems unlikely for H ii regions more remote than a few times their summed sizes because there is little clearing or destructive force that young stars can exert on a cloud this far from the H ii region, which defines the zone of greatest interaction. Also, the H ii regions probably span a range of ages from zero to some 10 Myr, and the youngest ones that are forming stars now should still have gas nearby (e.g., Kruijssen et al., 2018). Most likely, the H ii regions have dark molecular gas or unresolved H i still fairly close to them.
Third, the inferred molecular content of these galaxies, determined from the product of the star formation rate and the typical molecular consumption time of yr (Bigiel et al., 2008), correlates inversely with the fraction of H i clouds outside the disk scale length. The total molecular mass is calculated from the equation
| (1) |
and the molecular fraction is calculated from
| (2) |
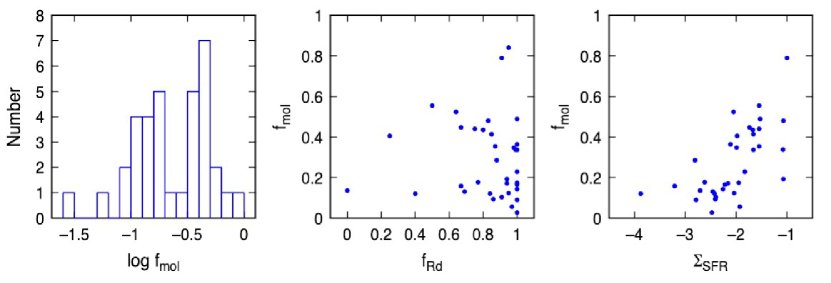
using quantities from Table 1. The distribution function of this molecular fraction is shown on the left in Figure 16. Typically more than 10% of the total gas is molecular according to this calculation; the average is , or %. The molecular fraction is also shown versus the fraction of catalogued clouds outside one disk scale length in the middle panel and versus the star formation rate surface density on the right. The middle panel shows that the galaxies with the highest molecular fractions also have the highest fraction of their clouds in the outer regions, which implies that the missing molecules are in the inner regions. The right-hand panel shows an increasing trend that follows mostly from the assumption that the molecular mass is proportional to the star formation rate, but it also contains the H i mass inside of , and H i is not part of that assumption. The implication is that regions with higher have a greater proportion of unobserved gas, most likely molecular, if they satisfy the Kennicutt-Schmidt relation (Bigiel et al., 2008). Otherwise they would lie high above this relation with star formation occurring in relatively little gas.
The distributions and correlations in Figures 12, 15, and 16 support the idea that a significant fraction of gas in the inner regions of dwarf irregulars is in molecular form as H2, even though it is not yet visible in CO or other molecular tracers nor clearly visible in dust emission because of low metallicity and temperature. Most likely, stars are forming in a combination of CO-dark H2 gas and atomic gas that is too cold and optically thick to stand out in our emission line maps.
The additional gas mass inferred from equation (1) makes the interstellar media of these dIrrs look more unstable to self-gravitational processes than previously thought. In Hunter et al. (1998), we calculated for many of the same galaxies that the area-average ratio of the gas surface density, , to the critical value from Toomre (1964), , was 0.53 (see Table 3 in that paper), compared to 0.7 at the H-emitting edges of spiral galaxies in Kennicutt (1989). Figure 16 now suggests that the average gas mass inside is higher by a factor when invisible H2 is included. This factor of 1.3 brings our previous value of up to 0.69, close to the Kennicutt value. Thus it seems possible that gravitational instabilities initiate star formation in some dIrrs like they do in spirals, and that dIrrs do this in a diffuse atomic and molecular medium that is currently invisible in CO emission. This is consistent with our previous suggestion (Elmegreen & Hunter, 2015) that the average midplane density of gas in dIrrs is higher than inferred from H i alone as a result of an invisible molecular diffuse medium.
6 Summary
The properties of 814 H i clouds in 40 nearby dIrr galaxies are determined from automated cloud-finding software and compared with the distributions of H ii regions and FUV emission from young stars. The internal cloud properties suggest a surface density spanning a relatively small range with a cloud average value, including He, equal to pc-2. Cloud masses range from to with the larger clouds in more massive galaxies. There is a weak square-root relation between internal cloud velocity dispersion and size, similar to that for molecular clouds, although the dispersions for these H i clouds are large enough to make most of them only weakly self-gravitating or diffuse.
The most interesting result is that the H i clouds tend to be outside the main regions of star formation, as shown by their prominence in the outer disks or by their typically large separations from the nearest H ii regions. This suggests that star formation is occurring in different clouds that are not visible in our H i emission line survey. Considering the usual correlation between molecular hydrogen as traced by CO emission and the star formation rate, we can infer the mass of missing molecular gas in these dIrrs. This missing H2 increases the gas mass in the inner disks by a galaxy average value of 23%, and makes the gas there about as unstable gravitationally as the gas in spiral galaxies where CO is observed directly. We conclude that the inner, star-forming disks of dIrr galaxies are rich in molecular and opaque atomic gas that does not typically appear in H i surveys, and that star formation proceeds by fairly normal processes in the dense molecular parts of these disks.
References
- Bigiel et al. (2008) Bigiel, F., Leroy, A., Walter, F., et al. 2008, AJ, 136, 2846
- Bolatto et al. (2013) Bolatto, A. D., Wolfire, M., & Leroy, A. K. 2013, ARA&A, 51, 207
- Cormier et al. (2017) Cormier, D., Bendo, G. J., Hony, S., et al. 2017, MNRAS, 468, L87
- Elmegreen & Hunter (2015) Elmegreen, B. G., & Hunter, D. A. 2015, ApJ, 805, 145
- Elmegreen et al. (2013) Elmegreen, B. G., Rubio, M., Hunter, D. A., Verdugo, C., & Brinks, E. 2013, Nature, 495, 487
- Herrmann et al. (2013) Herrmann, K. A., Hunter, D. A., & Elmegreen, B. G. 2013, AJ, 146, 104
- Hunter & Elmegreen (2004) Hunter, D. A., & Elmegreen, B. G. 2004, AJ, 128, 2170
- Hunter et al. (1998) Hunter, D. A., Elmegreen, B. G., & Baker, A. L. 1998, ApJ, 493, 595
- Hunter et al. (2016) Hunter, D. A., Elmegreen, B. G., & Gehret, E. 2016, AJ, 151, 136
- Hunter et al. (2010) Hunter, D. A., Elmegreen, B. G., & Ludka, B. C. 2010, AJ, 139, 447
- Hunter et al. (2012) Hunter, D. A., Ficut-Vicas, D., Ashley, T., et al. 2012, AJ, 144, 134
- Kennicutt (1989) Kennicutt, R .C. 1989, ApJ, 344, 685
- Kim et al. (2007) Kim, S., Rosolowsky, E., Lee, Y., et al. 2007, ApJS, 171, 419
- Kruijssen et al. (2018) Kruijssen, J.M.D., Schruba, A., Hygate, A.P.S., Hu, C.-Y,, Haydon, D.T., & Longmore, Steven N. 2018, MNRAS, 479, 1866
- Leroy et al. (2008) Leroy, A. K., Walter, F., Brinks, E., et al. 2008, AJ, 136, 2782
- Leroy et al. (2011) Leroy, A. K., Bolatto, A., Gordon, K. et al. 2011, ApJ, 737, 12
- Madden & Cormier (2019) Madden, S. C., & Cormier, D. 2019, in IAU Symposium 344, “Dwarf Galaxies: From the Deep Universe to the Present,” arXiv:1810.09953
- Martin et al. (2005) Martin, D. C., Fanson, J., Schiminovich, D., et al. 2005, ApJ, 619, L1
- McKee & Ostriker (2007) McKee, C. F. & Ostriker, E. C. 2007, ARA&A, 45, 565
- Rosolowsky & Leroy (2006) Rosolowsky, E., & Leroy, A. 2006, PASP, 118, 590
- Rubio et al. (2015) Rubio, M., Elmegreen, B. G., Hunter, D. A., et al. 2015, Nature, 525, 218
- Shaya & Federman (1987) Shaya, E. J. & Federman, S. R. 1987, ApJ, 319, 76
- Shi et al. (2015) Shi, Y., Wang, J., Zhang, Z.-Y., et al. 2015, ApJ, 804, L11
- Solomon et al. (1987) Solomon, P. M., Rivolo, A. R., Barrett, J., & Yahil, A. 1987, ApJ, 319, 730
- Toomre (1964) Toomre, A. 1964, ApJ, 139, 1217
- van Zee et al. (1997) van Zee, L., Haynes, M. P., Salzer, J. J., & Broeils, A. H. 1997, AJ, 113, 1618
- Youngblood & Hunter (1999) Youngblood, A. J., & Hunter, D. A. 1999, ApJ, 519, 55