DFTB modelling of lithium intercalated graphite with machine-learned repulsive potential
Abstract
Lithium ion batteries have been a central part of consumer electronics for decades. More recently, they have also become critical components in the quickly arising technological fields of electric mobility and intermittent renewable energy storage. However, many fundamental principles and mechanisms are not yet understood to a sufficient extent to fully realize the potential of the incorporated materials. The vast majority of concurrent lithium ion batteries make use of graphite anodes. Their working principle is based on intercalation—the embedding and ordering of (lithium-) ions in the two-dimensional spaces between the graphene sheets. This important process—it yields the upper bound to a battery’s charging speed and plays a decisive role for its longevity—is characterized by multiple phase transitions, ordered and disordered domains, as well as non-equilibrium phenomena, and therefore quite complex. In this work, we provide a simulation framework for the purpose of better understanding lithium intercalated graphite and its behaviour during use in a battery. In order to address the large systems sizes and long time scales required to investigate said effects, we identify the highly efficient, but semi-empirical Density Funtional Tight Binding (DFTB) as a suitable approach and combine particle swarm optimization (PSO) with the machine learning (ML) procedure Gaussian Process Regression (GPR) to obtain the necessary parameters. Using the resulting parametrization, we are able to reproduce experimental reference structures at a level of accuracy which is in no way inferior to much more costly ab initio methods. We finally present structural properties and diffusion barriers for some exemplary system states.
keywords:
battery materials, lithium-graphite, dftb, dftb parametrization, gaussian process regression, machine learningContributed equally to this work \altaffiliationContributed equally to this work \alsoaffiliationInstitute of Energy and Climate Research (IEK-9), Forschungszentrum Jülich, 52425 Jülich, Germany
![[Uncaptioned image]](/html/1904.13351/assets/img/toc_big.png)
1 Introduction
Within the past decade, studies investigating the consequences of man-made climate change 1, 2, 3 have become more specific, the predicted time frames shorter and the warnings more urgent. The immediate and radical reduction of carbon dioxide emissions by replacing fossil fuel based energy sources with renewable ones has been found to be the only reasonable approach to at least limit those consequences. 4 While the generation of electric energy from wind and sun is already quite advanced and efficient, its storage and transport are the main factors holding it back compared to coal and oil. Currently, two main approaches are being pursued in order to eliminate these drawbacks. One aims directly at the synthesis of alternative liquid or gas-phase fuels. The other intends to improve upon existing battery technology—especially lithium ion batteries—enough, to make it a serious contender in terms of energy sustenance. In this work, we intend to lay some groundwork for gaining deeper insight into some of the atomistic mechanisms limiting the (dis-)charging speed and lifetime of the most common types of lithium ion batteries, with graphite intercalation anodes.
Ever since graphite was ascertained experimentally and theoretically to be an excellent candidate as an anode for Li-ion batteries, numerous attempts were made at fully describing the working system. 5, 6, 7, 8, 9 Most of the electrochemical properties of the anode material itself are well-known. However, in particular transport processes during strongly driven operating conditions, like fast charging, are only poorly understood at a microscopic level. These technologically important macroscopic conditions are accompanied e.g. by temperature variations, leading to a capacity fade during ageing, as well as lithium plating. All of the above limit the lifetime of the battery. 10, 11, 12 Against this background, experiments and theory are pushed quite far to gain insight into the real processes occuring during the electrochemical operation. Depending on the quantities accessible via experiments and theory, two hypotheses are regularly invoked to explain the findings in the range of 0 % (graphite) to 100 % (LiC6) state of charge (SOC): the staging and the domain model. The lithium intercalation process shows evidence of multiple phase transitions in the voltage vs. SOC diagram. The corresponding system configurations are termed “stages” I, II and so forth. In the simple staging model, these correspond directly to the numbers of empty galleries (spaces between graphene sheets) between the fully occupied ones (see Figure 1).
In the domain model, these motifs are not assumed to range over meso-/macroscopic dimensions but to form regions of finite lateral extent. Consequently, it is quite clear that different SOC with the same nominal stoichiometry LiCx will not be configurationally homogeneous, making Li-intercalated graphite a profoundly non-trivial system to address.
In order to effectively connect to experimental studies, a theoretical framework for simulating large-scale and long-duration non-equilibrium processes in the graphite anode, based on kinetic Monte Carlo (kMC) 15 simulations is required. The first step towards this goal is gaining the ability to quickly and accurately calculate diffusion barriers on the fly, which is the primary motivation of this work. This requires the ability to reproduce reliably and accurately the layer distances (ideally of all possible configurations, but predominantly of the dilute, low-saturation stages) and the forces affecting the lithium-ions, while the strains within the graphene layers are of lesser importance.
Large-scale atomistic simulations typically pursue force field approaches 16 for those systems where energetics and kinetics are well described within the upper end of the SOC range. However, those approaches are limited when it comes to the entire range of different SOC, from extremely diluted stages to fully concentrated ones. Recently, a Gaussian Approximation Potential (GAP) was reported to be able to describe amorphous carbon well. 17 However, when the latter was later extended to model lithium intercalation, 18 it became apparent that the insertion of lithium into those host structures requires a non-trivial description of the electrostatic interaction. Contrary to most approaches, including the one presented in this work, Fujikake et al. did not treat the full Li-C system, but attempted to model the energy and force differences arising from lithium intercalation separately, and then added them to the carbon GAP. More specifically, their machine learning (ML) process is based on fitting the energy and force differences between identical carbon host structures, but with and without an intercalated lithium atom. However due to the fact that the lithium intercalation energies are significantly larger in magnitude than the electrostatic lithium-lithium interaction energies, they were not able to recover the latter from the data to a satisfactory degree and had to manually add an extra correction term (fitted to DFT) in order to account for those contributions. To avoid similar shortcomings, we rather base our approach on Density Functional Tight Binding (DFTB) 19, a semi-empirical—and thus computationally much cheaper—approximation to Density Functional Theory (DFT), 20 which has been the most common technique for high-accuracy electrochemical simulations for many decades 21. However, since DFTB’s speedup is achieved by pre-calculating atomic interactions to avoid expensive integrations at runtime, this comes at the cost—or rather, initial investment—of pairwise parametrization. As of now, no Li-Li and Li-C DFTB parameters are available. In the following, we combine for the first time the recently developed Particle Swarm Optimization (PSO) 22 parametrization approach as first proposed by Chou et al. 23 with a more flexible ML repulsive potential 24, to obtain finely-tuned parameters for this system—taking advantage of its physics, albeit perhaps at the expense of some transferability. Let us however stress that the parametrization procedure employed here remains completely general, as the system specificity lies entirely in the choice of the training set(s).
2 Methods
2.1 DFTB: electronic part
In DFTB jargon, the so-called “electronic part” includes the semi-empirical band structure and the Coulombic contributions to the total energy of the system. 21 These depend parametrically on the diagonal elements of the non-interacting Hamiltonian, the Hubbard- and a confinement potential which is used to cut off the diffuse tails of the basis orbitals. For the free atom, the first two quantities are tabulated for most elements or can be calculated with DFT. However, using the free atom values is an approximation, and the decision whether it is justified must be made carefully on a case to case basis. The confinement potential, on the other hand, is always treated as a parameter. Quadratic 25 and general power-law functional forms 26 are commonly used, as well as the Woods-Saxon potential 23 (also employed here) which assures a smoother transition to zero in the orbital tails. Each of these parameters needs to be determined for every chemical species present in the system of interest, typically in a non-linear optimization process. In the PSO, each particle then represents a set of parameters (, , and the confinement constants), with which the DFTB interaction is constructed, so that the parametrization can be improved by minimizing a cost function. The central task is thus the definition of a meaningful cost function. Frequently, one uses the weighted sum of an arbitrary number of contributions , each providing a measure of the deviation between DFT and DFTB for some system property . Hereby, as we are optimizing the electronic parameters only, the chosen target properties must not depend on repulsion. For our system, we target the band structures of metallic lithium, graphene and diamond. Additional details on the definition of the corresponding cost function, as well as the resulting optimal values of the onsite energies and the confinement coefficients, are provided in the SI. Figure 2 shows our resulting band structures. Overall, we recognize decent agreement for all band structures, while some deviations are expected given the minimal basis in DFTB. For example, the pronounced mismatch in the conduction band at the point in the lithium band structure as well as the incorrectly direct band gap of diamond can be ascribed to this over-simplification in the DFTB model. For the two carbon systems, we see very good qualitative agreement for most regions of the band structures, but notice a small degree of overall compression towards the Fermi level.
Given the overall agreement and also considering the fact that the repulsion potential is capable of quite effectively correcting small imperfections in the electronic part, we decide not to optimize the latter any further in this work—a decision justified in retrospect by the excellent results we present. However, let us still emphasize the opportunity for improvement here, should it eventually become necessary.
From a more techincal standpoint, we note in passing that while during the PSO optimization we employed an basis set for lithium, the production Slater Koster table was constructed including only the orbital for lithium (with the confinement optimized in the basis). While this may strike as a rather unhortodox choice, it is motivated by the concomitant observation that i) optimizing the lithium confinement with the orbital only produces inherently wrong results, and ii) the optimization of the repulsive potential on top of an -basis electronic part showed inherent pitfalls that likely cannot be overcome by any choice of training set. A detailed justification is provided in the SI.
2.2 DFTB: repulsive potential
It is common practice to assume some analytical form for the repulsive potential and fit the functional parameters as to minimize a set of DFT-DFTB force differences 21—a protocol easily implemented also for the PSO approach. However, limitations and bias may result from the choice of said parametrized functional form. It needs to be sufficiently flexible to cover a large space of systems and bonding situations. This typically yields a high dimensional non-linear optimization problem, which might still be insufficient to capture unexpected subtle, yet extremely relevant physical features. We rather adopt the GPrep method recently developed in our group 27, 24, which employs Gaussian Process Regression (GPR) 28 to create a flexible functional form “on the fly”, while adapting to the physics captured by the training data set, instead of forcing us to guess it a priori. In the SI, we give a short introduction to the method and explain the character and effect of the related hyperparameters, referring the reader to Rasmussen 28 for the underlying stochastic theory and to 27, 24 for the application to DFTB repulsive potentials. For the global damping, correlation distance, and data noise hyperparameters, we verified (see SI) that results are appropriately robust in a sizeable subspace of the overall hyperparameter-space. The same is not necessarily true for the cutoff radii . Since the electronic energy contribution is entirely based on just a sum of non-interacting atomic contributions, the repulsion potential has to account for different chemical environments affecting the same type of atom. In a GPR setting it is therefore of paramount importance to sample a sufficiently large set of training data which covers all interatomic distance ranges and chemical environments relevant for a faithful representation of the system studied. Ideally, it should also be ascertained that the model quality is stable w.r.t. the explicit choice of the cutoff radii as well as the other hyperparameters, at least within physically motivated boundaries roughly defined by characteristic lengths of the system, e.g. nearest neighbour (NN) distances. For instance, it is generally accepted that adequate cutoff values should fall somehwere between the 1st and the 2nd NN distances for the pair in consideration 21. However may extend to include ranges beyond the 2nd NN distance, should the particular physics the parametrization is aimed at not be entirely captured by shorter-ranged repulsive potentials.
3 Results and discussion
3.1 DFTB repulsion training
In terms of DFT functional, our starting point is PBE 29, which has been used by the majority of researchers working on intercalation phenomena and is known to describe LiC6 well. However, it does not reproduce the dispersive interaction between graphene sheets. In order to address this, we finally (see “Set 3” below) combine the reference PBE calculation with a Many Body Dispersion (MBD@rsSCS, throughout the text referred to as MBD) 30, 31 treatment and the DFTB model with a computationally cheap Lennard Jones (LJ) 32 dispersion correction 33. The rationale for this choice is that PBE should reproduce galleries containing many lithium atoms correctly and LJ-dispersion should predict empty galleries well, while not interfering too much with the PBE-description of the concentrated ones. However, it is unclear, how this interaction shapes out for intermediate, dilute lithium stoichiometries. During our investigations, we find that this approach works somewhat decently, but needs some controlled adjustments (vide infra) in order to produce truly satisfactory results.
As a first guess, we construct a set of training structures (Set 1) which consists of a balanced mix of LinC36 super-cells (), in order to represent the entire range of charging states. Additionally, those structures are rattled (each atom randomly displaced), as well as compressed or expanded. This procedure yields a smooth distribution of bond lengths and forces. We then train a GPR repulsion potential by matching DFTB against PBE forces for this structural ensemble, aiming at a first, mostly transferable model. The standard LJ DFTB correction is subsequently applied on top of this parametrized DFTB model. With this approach, we are able to find parametrizations that reproduce all layer distances (of graphite, LiC12 and of LiC6) correctly, albeit not for a stable range of all parameters.
As shown in Figure 3, the choice of cutoff radius for the C-C repulsion potential does not have a major influence on the layer-distances for quite a large range of values. In fact, the point at which the predictions stop being accurate can be identified as approximately the experimental values for the interlayer distances. Going beyond that with the cutoff radius essentially corresponds to including interlayer interactions in the potential fit, mixing their description with the intralayer covalent bonds. Thus, the restriction of the cutoff radius we find here is physically motivated by the range separation of the interactions that characterize our system: as the 2nd next neighbour distance in a relaxed graphene sheet is around Å and the layer distance is Å, the cutoff range defined by the plateau in Figure 3 represents a sweet spot where the GPR learns 2nd next neighbour interactions but does not yet (mistakenly) take any interlayer interactions (even in the compressed structures) into account in the repulsion potential. However, the same reasoning does not apply to CC bond lengths, which are not correctly reproduced if the GPR learns forces beyond the 1st NN distance (see SI). In light of these findings, we select the cutoff value Å for the C-C-repulsion potential. Indeed, we did not encounter any reason to change this selection during the entirety of this work (despite rigorously testing it for each of the training data sets).
However, with this first training set we do not obtain an equally stable plateau as a function of the Li-C repulsive cutoff (see SI), with the correct values corresponding to Å not belonging to a plateau at all. Furthermore, the quite strongly distorted graphite planes in these structures lead to large forces compared with those acting on the intercalated lithium-ions, causing a systematic underestimation in lithium-forces prediction. We tackle the second problem first: while the rattled, scaled structures in Set 1 cover a sufficiently large range of bond lengths, they only account for configurations with the lithium-ions sitting over the centre of a graphite ring, i.e. in a local energy minimum. We recognize this as the reason for the comparably small lithium-forces. In order to balance out this structural bias, we calculate a number of transition paths for lithium diffusion processes in LiC6 and LiC12 stage I/II compounds using a Nudged Elastic Band (NEB) method 36, 37. We are now able to extract structures from these trajectories, in which the lithium ions are subject to stronger forces commensurable with the graphite-layers. For our second training set (Set 2), we replace the higher-saturated rattled and scaled structures with those extracted from the transition paths. In doing so, we assume higher-saturated structures to be responsible for the slight contraction observed in C-C bonds (see SI).
By this measure, we are able to improve the accuracy for predicting forces on Li-ions significantly (albeit still slightly underestimated), without sacrificing the description of the graphite layers. However, while we do observe a plateau for the resulting layer distances with respect to , the interlayer distances are not reproduced equally well as in Figure 3 for Set 1 (see Figure 4, yellow area), with the exception of points 3.5 Å and 4.0 Å which do not belong to a plateau. This behaviour suggests that our problem here does not lie in the choice of the training set, but rather in the treatment of long-ranged interactions.
Let us consider the underlying predicament: so far, the DFTB-part of the force residues used for the ML process is calculated without LJ dispersion correction. We then construct the repulsion potential with the purpose of making those DFTB calculations match references based on PBE-DFT, which reliably predicts layer distances for LiC6. By then using LJ (required to obtain the correct empty layer distance in graphite) in our actual DFTB calculations (after the parametrization process), we cause the aforementioned offset for highly lithiated compounds. Using LJ already for the force-residue calculations during the ML seems like the obvious solution to this problem. However, this presents a new issue in the lower-saturation range (LiCx, ). There, we previously fitted the repulsion to PBE-DFT references, which are not correct in that range without dispersion correction. The resulting DFTB forces are then shifted by LJ towards the correct value (as is indicated by the quite decent results for LiC12 with Set 2). But after the modification, we would then fit the final DFTB forces (that result after applying the LJ) to the (incorrect) PBE-DFT references, thus improving our performance for highly saturated system states, but ruining it for dilute ones, by effectively double counting dispersive contributions. It becomes apparent that in order to make this approach work, we need to utilize dispersion corrected DFT reference forces which are also correct for low saturation states and, at the same time, compatible with the computationally cheap DFTB-LJ correction.
Our ansatz is that we can—to a degree—encode the difference between the LJ dispersion and the “true” dispersion into the repulsion potential. At this point we stress that ideally, both the true, non-local exchange correlation functional in DFT and an ideal repulsion energy in DFTB would already encompass all dispersion effects, and it is solely due to approximations in the derivations, e.g. of GGAs, that they do not in these models. Therefore, rather than mixing our repulsion potential with something fundamentally different (which would be physically questionable), what we do here simply corresponds to partially adding a contribution back in, that should have been there in the first place. To our knowledge, the currently best way to calculate dispersion corrected lithium intercalated graphite, with correct layer distances predicted for the entire saturation range, is the Many Body Dispersion (MBD) correction 30. This method is computationally rather expensive, but since we only need to run DFT calculations for our training data set, which is very limited in size, this is not vital to us.
In practical terms, we then build a Set 3 where DFTB-DFT force residues are replaced by DFTB(LJ)-DFT(MBD) force residues. We do realize that this approach most likely comes with some cost in terms of transferability. In order to retain as much of it as possible, we choose not to replace all force residues, but only (more precisely, only for structures containg no or 1 lithium atom), which proves sufficient to demonstrate the effectiveness of the presented method in a general way. Nonetheless, further investigating the effect this percentage has on the performance is certainly a task that should be tackled in the future. Of course, alternatively to our approach, it is possible to simply apply the MBD correction scheme directly to our DFTB calculations. However, doing so would cost us one to two orders of magnitude in speed, as MBD then becomes the computationally dominating step in production DFTB calculations.
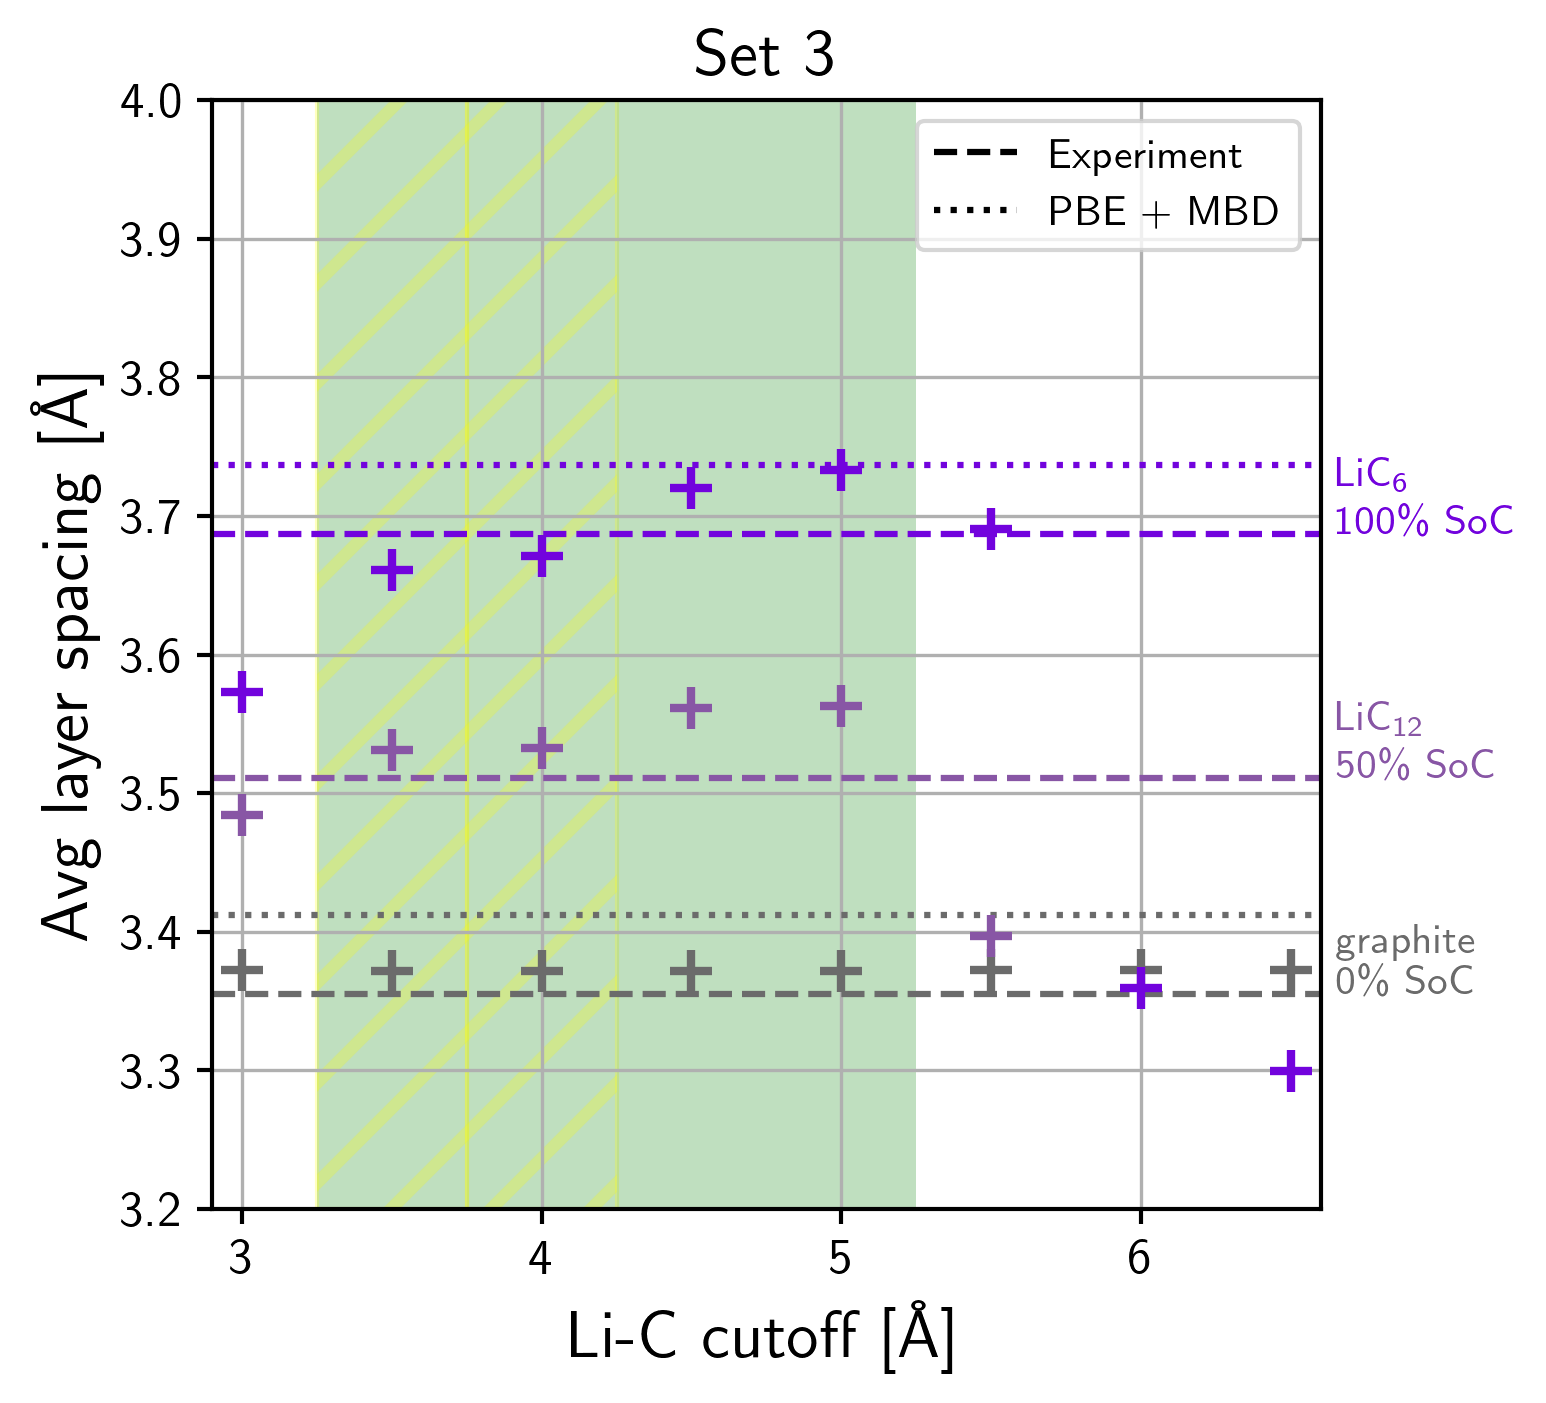
Using the previously explained modifications, we have succeeded at shifting the predicted interlayer distances (within the stable plateau) into the very close proximity of the experimental reference values for both LiC6 and LiC12, as shown in Figure 5. To be precise, the ranges of = Å and Å should be regarded as two distinct plateaus, both close to the correct experimental values. However, we shall consider the second as our final plateau, where the resulting interlayer distance fall between the experimental and the DFT reference values, since we trained against DFT reference forces. Of note, the predicted interlayer distance for LiC12 becomes wrong already at Å. Once again this is a physically motivated boundary: it is the distance at which the Li atoms start to “feel” the next layer. In LiC6, which has a larger interlayer spacing and for which the resulting interlayer distance is correct at that point, this happens for Å.
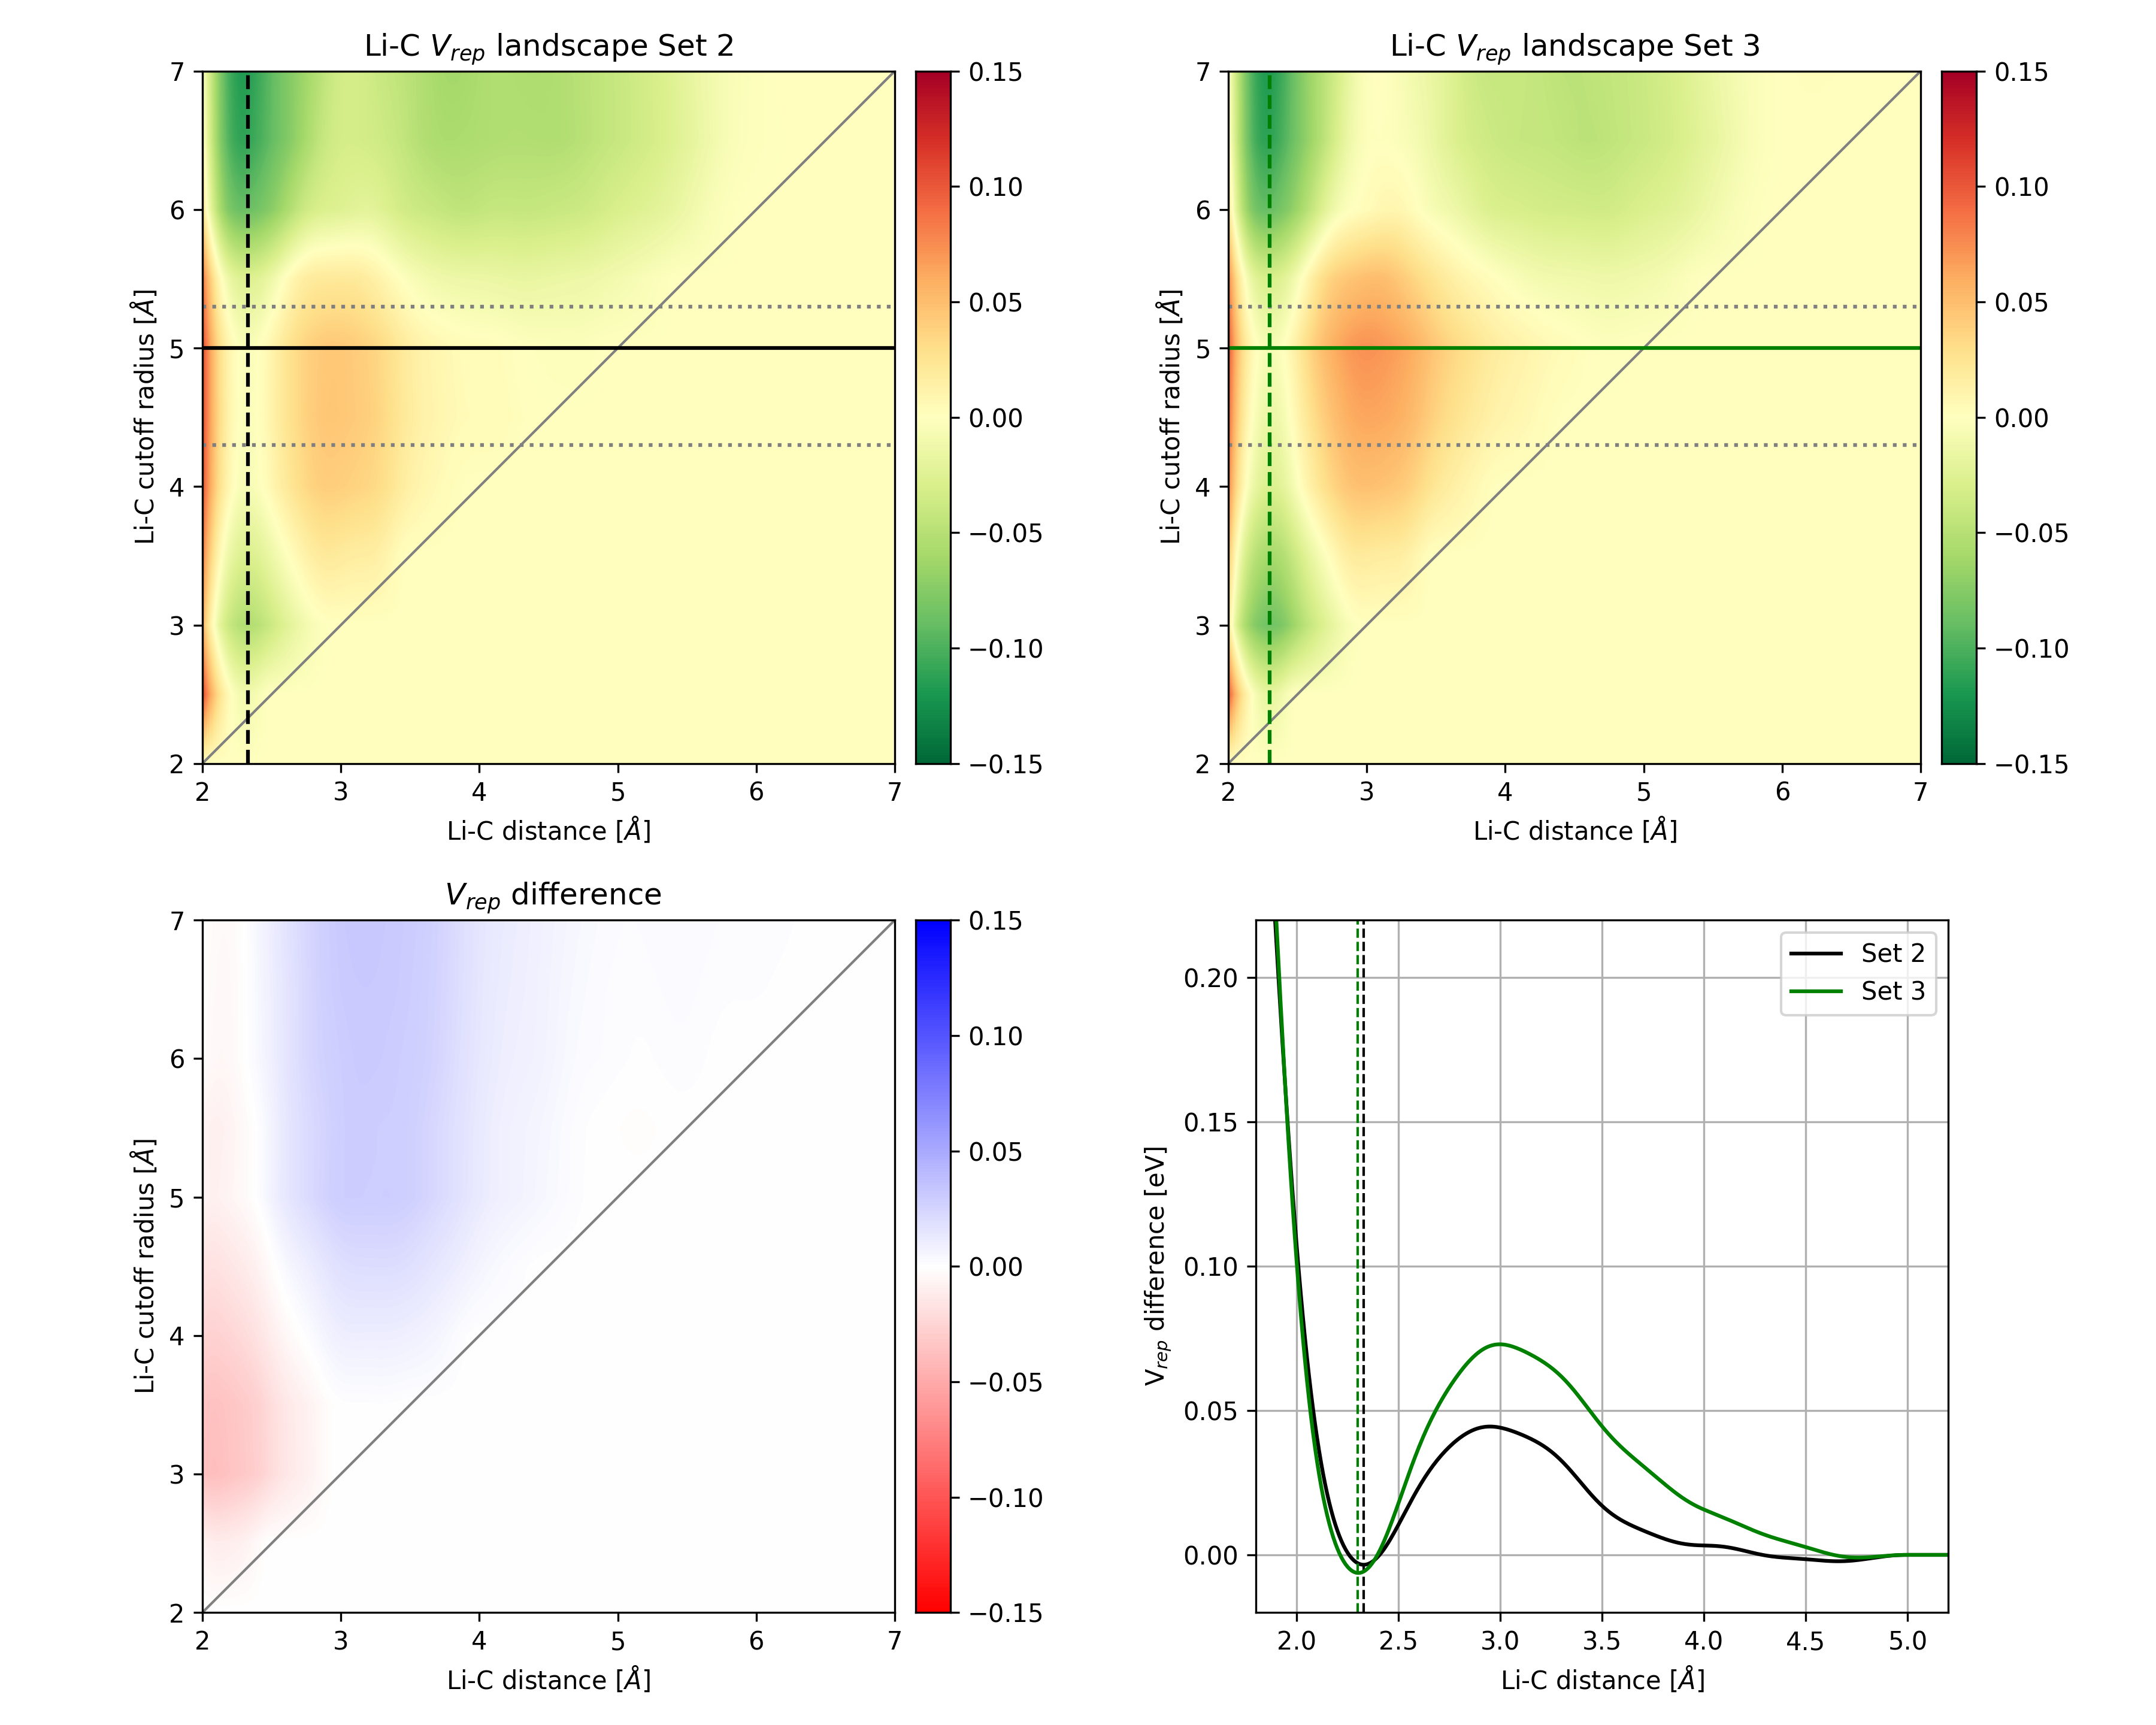
Especially the excellent results for the stage II compound LiC12 show that our parametrization is now able to handle both mainly ionic concentrated and mainly dispersive dilute layers to a satisfactory degree. In Figure 6, we illustrate the effect our modification has on the repulsion potential landscape for a wide range of Li-C cutoff radii. First (and most notably), we have moved and solidified the local minimum related to the next-neighbour lithium-carbon interaction (see bottom right). For the Set 2 and Set 3 potentials, the minima (black and green dashed lines respectively) are located at atomic distances of Å and Å respectively, which correspond to LiC6 interlayer distances of Å and Å, the exact values which do, in fact, result from the relaxation of those structures, using the two repulsion potentials respectively. The 2D maps (top) show that this behaviour is apparent for an entire range of cutoff radii, thus ruling out the possibility that the fit is only accidentally correct (as it happens, e.g., for Set 1 with Å. We can also clearly see the upper ( Å) and lower ( Å) boundaries for the cutoff radius, beyond which the physicality of the model falls apart. They define exactly the range within which we find the stable cutoff dependency plateau, which is now at the correct numerical value as shown in Figure 5. We may identify the upper boundary at Å (as discussed above), as the distance between a lithium ion and the second closest graphene sheet, which is an intuitively plausible limitation. It is less obvious, though, to assign a clear physical meaning to the lower bound at Å, as it cannot be directly related to any particular structural feature of LiCx. The most likely cause, we believe, is that the cosine-shaped cutoff function employed in the GPR framework starts cutting off physically relevant details from the repulsion potential below that.
A physically motivated lower bound of different nature may be identified by evaluating the relative RMSD of forces as a function of Li-C cutoff, shown in the SI. Overall, we now observe two separate Li-C cutoff plateaus: between approximately 4.3 Å and 5.3 Å, we obtain accurate layer distances (Figure 5), while for radii above roughly 4.0 Å and until 6.0 Å, our predictions for forces and transition energies are correct. This duality can very simply be explained by the fact that the first property is mostly a z-direction phenomenon (and interactions with the second closest graphene sheet limit the physicality of our model), while the other takes place almost exclusively in the xy-plane, where no such limitation applies, hence the broader plateau. Given this difference in fundamental nature, it is very plausible to trust both these plateaus. Thus, their overlap (4.3–5.3 Å) defines the region within which any value of the Li-C cutoff radius produces an almost identical parametrization that performs very well, for all our benchmark criteria, in a stable and trustworthy manner.
3.2 Interlayer distances and diffusion barriers
| (Average) inter-layer distances with detailed analysis of layer spacing and barriers. | |||||||
|---|---|---|---|---|---|---|---|
| compound | experimental | DFTB | DFT 38 | filled | empty | barrier | |
| graphite | – | Å | mÅ | mÅ | – | mÅ | – |
| LiC18 | stage III | Å | mÅ | mÅ | * mÅ | * mÅ | meV |
| LiC12 | stage II | Å | mÅ | mÅ | * mÅ | * mÅ | meV |
| LiC6 | stage I | Å | mÅ | mÅ | mÅ | – | meV |
| *: note that these numbers are not errors, but differences between specific and average layer distances | |||||||
| : estimated from experimental values for graphite and LiC6. | |||||||
Table 1 reports some resulting inter-layer distances and diffusion barriers based on our DFTB parametrization, compared with experimentally determined values, as well as previous theoretical findings. As a quick reminder, stages I, II and III correspond to every, every other and every third gallery being filled (to any degree) with lithium. Additionally, one may describe the concentration of the intercalant in a filled gallery as dilute (low) or concentrated (high), thus allowing for a simple classification of fundamentally different compounds. Here, however, we take only concentrated stages into consideration.
For all calculations, we chose a Li-C cutoff radius of Å, following the findings discussed above. As Table 1 clearly illustrates, we systematically outperform the method by Krishnan et al. 38—in terms of accuracy—for every structure they provide comparison for. This is especially remarkable considering the fact that they used full GGA-DFT with dispersion corrections in post-processing, which is the current state-of-the-art approach, as well as significantly more computationally expensive than our method.
Subsequently, we investigate intra-layer next-neighbour diffusion barriers and compare our results to recent experimental findings from Ref. 40 (based on muon spin relaxation spectroscopy) and theoretical from Ref. 41 (calculated at the LDA-DFT level without dispersion correction, which is only reliable for the predominantly ionic, filled state of charge).
Our calculations yield purely microscopic results within 50 meV from each other for all three relevant compounds, as is shown in Table 1. The deviations between them correlate to the slight differences in the filled-layer spacing of the different structures. Our 503 meV barrier for the elementary diffusion in LiC6 is in perfect agreement with the value of 490 meV reported by Toyoura et al. 41 In contrast, the experimentally determined active barriers of 270 meV for LiC6 and 170 meV for LiC12 show a strong dependency on the systems stage. We believe this difference to be caused by concerted effects. Capturing those using kinetic Monte Carlo simulation is something we intend to do in the near future.
4 Conclusions and outlook
In this work, we put forward—for the first time combining particle swarm (i.e. PSO) and machine learning 24 (i.e. GPR) approaches for this task—a well-performing DFTB-parametrization for lithium intercalated graphite which is capable of very accurately reproducing various structural properties and qualitative trends relating to the intercalation mechanism for a wide variety of LiCx compounds. In the course of this process, we believe to have shown that Density Functional Tight Binding (DFTB) is a superior approach for modelling intercalation compared with force field methods, including the more sophisticated machine learning approaches (e.g. the GAP by 18 requires a manual correction term for lithium-lithium interactions which our method does not). Furthermore, we share key details and choices along this process and thus provide guidance for similar endeavours in the future.
CP gratefully acknowledges funding from the German Research Foundation (DFG – Deutsche Forschungsgemeinschaft) through grant # PA 2932/1-1.
The Supporting Information is available free of charge at …
Supplementary discussion, including computational details, PSO cost function, choice of basis set, GPrep hyperparameters, description of training sets, full validation.
References
- Sharp et al. 2011 Sharp, M.; Burgess, D. O.; Cogley, J. G.; Ecclestone, M.; Labine, C.; Wolken, G. J. Extreme melt on Canada’s Arctic ice caps in the 21st century. Geophysical Research Letters 2011, 38
- Fisher et al. 2012 Fisher, D.; Zheng, J.; Burgess, D.; Zdanowicz, C.; Kinnard, C.; Sharp, M.; Bourgeois, J. Recent melt rates of Canadian arctic ice caps are the highest in four millennia. Global and Planetary Change 2012, 84, 3–7
- U.S. Global Change Research Program 2018 U.S. Global Change Research Program, Impacts of climate change on human health in the United States: a scientific assessment; Skyhorse Publishing, 2018
- Anderson et al. 2016 Anderson, T. R.; Hawkins, E.; Jones, P. D. CO2, the greenhouse effect and global warming: from the pioneering work of Arrhenius and Callendar to today’s Earth System Models. Endeavour 2016, 40, 178–187
- Hennig 1959 Hennig, G. R. Progress in Inorganic Chemistry; John Wiley & Sons, Inc., 1959; pp 125–205
- Guerard and Herold 1975 Guerard, D.; Herold, A. Intercalation of lithium into graphite and other carbons. Carbon 1975, 13, 337–345
- Hawrylak and Subbaswamy 1984 Hawrylak, P.; Subbaswamy, K. R. Kinetic Model of Stage Transformation and Intercalation in Graphite. Physical Review Letters 1984, 53, 2098–2101
- Conard et al. 1994 Conard, J.; Nalimova, V. A.; Guerard, D. NMR Study of LiCX Graphite Intercalation Compounds Prepared Under High Pressure. Molecular Crystals and Liquid Crystals Science and Technology. Section A. Molecular Crystals and Liquid Crystals 1994, 245, 25–30
- Nitta et al. 2015 Nitta, N.; Wu, F.; Lee, J. T.; Yushin, G. Li-ion battery materials: present and future. Materials Today 2015, 18, 252–264
- Gallagher et al. 2016 Gallagher, K. G.; Trask, S. E.; Bauer, C.; Woehrle, T.; Lux, S. F.; Tschech, M.; Lamp, P.; Polzin, B. J.; Ha, S.; Long, B. et al. Optimizing areal capacities through understanding the limitations of lithium-ion electrodes. Journal of The Electrochemical Society 2016, 163, A138–A149
- Wandt et al. 2018 Wandt, J.; Jakes, P.; Granwehr, J.; Eichel, R. A.; Gasteiger, H. A. Quantitative and time-resolved detection of lithium plating on graphite anodes in lithium ion batteries. Materials Today 2018, 21, 231–240
- Yang et al. 2018 Yang, X.-G.; Zhang, G.; Ge, S.; Wang, C.-Y. Fast charging of lithium-ion batteries at all temperatures. Proceedings of the National Academy of Sciences 2018, 115, 7266–7271
- Smith et al. 2017 Smith, R. B.; Khoo, E.; Bazant, M. Z. Intercalation kinetics in multiphase-layered materials. The Journal of Physical Chemistry C 2017, 121, 12505–12523
- Daumas and Herold 1969 Daumas, N.; Herold, A. Relations between phase concept and reaction mechanics in graphite insertion compounds. Comptes Rendus Hebdomadaires Des Seances De L’Academie Des Sciences Serie C 1969, 268, 373
- Andersen et al. 2019 Andersen, M.; Panosetti, C.; Reuter, K. A Practical Guide to Surface Kinetic Monte Carlo Simulations. Frontiers in Chemistry 2019, 7, 202
- van Duin et al. 2001 van Duin, A. C. T.; Dasgupta, S.; Lorant, F.; Goddard, W. A. ReaxFF: A reactive force field for hydrocarbons. The Journal of Physical Chemistry A 2001, 105, 9396–9409
- Deringer and Csányi 2017 Deringer, V. L.; Csányi, G. Machine learning based interatomic potential for amorphous carbon. Physical Review B 2017, 95, 094203
- Fujikake et al. 2018 Fujikake, S.; Deringer, V. L.; Lee, T. H.; Krynski, M.; Elliott, S. R.; Csányi, G. Gaussian approximation potential modeling of lithium intercalation in carbon nanostructures. The Journal of Chemical Physics 2018, 148, 241714
- Elstner et al. 1998 Elstner, M.; Porezag, D.; Jungnickel, G.; Elsner, J.; Haugk, M.; Frauenheim, T.; Suhai, S.; Seifert, G. Self-consistent-charge density-functional tight-binding method for simulations of complex materials properties. Physical Review B 1998, 58, 7260–7268
- Kohn and Sham 1965 Kohn, W.; Sham, L. J. Self-Consistent Equations Including Exchange and Correlation Effects. Physical Review 1965, 140, A1133–A1138
- Koskinen and Mäkinen 2009 Koskinen, P.; Mäkinen, V. Density-functional tight-binding for beginners. Computational Materials Science 2009, 47, 237–253
- Shi and Eberhart 1998 Shi, Y.; Eberhart, R. A modified particle swarm optimizer. 1998 IEEE International Conference on Evolutionary Computation Proceedings. IEEE World Congress on Computational Intelligence (Cat. No.98TH8360). 1998
- Chou et al. 2016 Chou, C.-P.; Nishimura, Y.; Fan, C.-C.; Mazur, G.; Irle, S.; Witek, H. A. Automatized Parameterization of DFTB Using Particle Swarm Optimization. Journal of Chemical Theory and Computation 2016, 12, 53–64
- Engelmann 2018 Engelmann, A. The generation of pairwise interatomic potentials from arbitrary structures - A machine learning approach with application in DFTB. M.Sc. thesis, Technical University Munich, 2018
- Stöhr 2018 Stöhr, M. Simulation of Hybrid-Organic-Inorganic Interfaces with dispersion-inclusive semi-empirical electronic structure methods. M.Sc. thesis, Technische Universität München, Yale University, 2018
- Wahiduzzaman et al. 2013 Wahiduzzaman, M.; Oliveira, A. F.; Philipsen, P.; Zhechkov, L.; van Lenthe, E.; Witek, H. A.; Heine, T. DFTB parameters for the periodic table: Part 1, Electronic structure. Journal of Chemical Theory and Computation 2013, 9, 4006–4017
- Panosetti et al. 2020 Panosetti, C.; Engelmann, A.; Nemec, L.; Reuter, K.; Margraf, J. T. Learning to Use the Force: Fitting Repulsive Potentials in Density-Functional Tight-Binding with Gaussian Process Regression. Journal of Chemical Theory and Computation 2020, 16, 2181–2191, PMID: 32155065
- Rasmussen and Williams 2006 Rasmussen, C. E.; Williams, C. I. Gaussian Processes for Machine Learning; The MIT Press, 2006
- Perdew et al. 1996 Perdew, J. P.; Burke, K.; Ernzerhof, M. Generalized Gradient Approximation Made Simple. Physical Review Letters 1996, 77, 3865–3868
- Tkatchenko et al. 2012 Tkatchenko, A.; DiStasio, R. A.; Car, R.; Scheffler, M. Accurate and Efficient Method for Many-Body van der Waals Interactions. Physical Review Letters 2012, 108, 236402
- Ambrosetti et al. 2014 Ambrosetti, A.; Reilly, A. M.; DiStasio Jr., R. A.; Tkatchenko, A. Long-range correlation energy calculated from coupled atomic response functions. The Journal of Chemical Physics 2014, 140, 18A508
- Zhechkov et al. 2005 Zhechkov, L.; Heine, T.; Patchkovskii, S.; Seifert, G.; Duarte, H. A. An Efficient a Posteriori Treatment for Dispersion Interaction in Density-Functional-Based Tight Binding. Journal of Chemical Theory and Computation 2005, 1, 841–847
- Rappe et al. 1992 Rappe, A. K.; Casewit, C. J.; Colwell, K. S.; Goddard, W. A.; Skiff, W. M. UFF, a full periodic table force field for molecular mechanics and molecular dynamics simulations. Journal of the American Chemical Society 1992, 114, 10024–10035
- Trucano and Chen 1975 Trucano, P.; Chen, R. Structure of graphite by neutron diffraction. Nature 1975, 258, 136–137
- Vadlamani et al. 2014 Vadlamani, B.; An, K.; Jagannathan, M.; Chandran, K. S. R. An In-Situ Electrochemical Cell for Neutron Diffraction Studies of Phase Transitions in Small Volume Electrodes of Li-Ion Batteries. Journal of The Electrochemical Society 2014, 161, A1731–A1741
- Henkelman and Jónsson 2000 Henkelman, G.; Jónsson, H. Improved tangent estimate in the nudged elastic band method for finding minimum energy paths and saddle points. The Journal of Chemical Physics 2000, 113, 9978–9985
- Henkelman et al. 2000 Henkelman, G.; Uberuaga, B. P.; Jónsson, H. A climbing image nudged elastic band method for finding saddle points and minimum energy paths. The Journal of chemical physics 2000, 113, 9901–9904
- Krishnan et al. 2013 Krishnan, S.; Brenet, G.; Machado-Charry, E.; Caliste, D.; Genovese, L.; Deutsch, T.; Pochet, P. Revisiting the domain model for lithium intercalated graphite. Applied Physics Letters 2013, 103, 251904
- Shanno 1985 Shanno, D. F. On Broyden-Fletcher-Goldfarb-Shanno method. Journal of Optimization Theory and Applications 1985, 46, 222–231
- Umegaki et al. 2017 Umegaki, I.; Kawauchi, S.; Sawada, H.; Nozaki, H.; Higuchi, Y.; Miwa, K.; Kondo, Y.; Månsson, M.; Telling, M.; Coomer, F. C. et al. Li-ion diffusion in Li intercalated graphite C 6 Li and C 12 Li probed by + SR. Physical Chemistry Chemical Physics 2017, 19, 19058–19066
- Toyoura et al. 2010 Toyoura, K.; Koyama, Y.; Kuwabara, A.; Tanaka, I. Effects of Off-Stoichiometry of LiC6 on the Lithium Diffusion Mechanism and Diffusivity by First Principles Calculations. The Journal of Physical Chemistry C 2010, 114, 2375–2379