Computational Models for Commercial Advertisements in Social Networks
Abstract
Identifying noteworthy spreaders in a network is essential for understanding the spreading process and controlling the reach of the spread in the network. The nodes that are holding more intrinsic power to extend the reach of the spread are important due to demand for various applications such as viral marketing, controlling rumor spreading or get a better understanding of spreading of the diseases. As an application of the viral marketing, maximization of the reach with a fixed budget is a fundamental requirement in the advertising business. Distributing a fixed number of promotional items for maximizing the viral reach can leverage influencer detection methods. For detecting such “influencer” nodes, there are local metrics such as degree centrality (mostly used as in-degree centrality) or global metrics such as -shell decomposition or eigenvector centrality. All the methods can rank graphs but they all have limitations and there is still no de-facto method for influencer detection in the domain.
In this paper, we propose an extended -shell algorithm which better utilizes the -shell decomposition for identifying viral spreader nodes using the topological features of the network. We use Susceptible-Infected-Recovered model for the simulations of the spreading process in real-life networks and the simulations demonstrates that our approach can reach to up to 36% larger crowds within the same network, with the same number of initial spreaders.
Index Terms:
Influencer detection, computational advertisement models, social networks, social network economics, -shell decomposition, epidemics, spreading ideas.I Introduction
In our economy driven society, competition is the hidden force triggering advertisements. Companies race for selling functionally similar (if not same) products, desiring to reach out each single buyer and advertise their inventory. Conventional commercial advertisement methods generally consist some kind of broadcasting such as ads in newspapers, magazines, radio and TV commercials.
Broadcasting has an advantage of reaching masses with a single advertisement, however, it bears several disadvantages. First of all, there is no targeting. The advertisement reaches to all, even they are not in the target group, which is usually very expensive and it exceeds reasonable budgets. Secondly, since there is no controlling authority, competitors tend to overrating (or even faking) their content. This causes a loss in trust and this leads to an increase in importance of viral marketing: in response to the information pollution of commercials, consumers (or buyers) have lost their trust throughout the advertisement exposition and people start to depend on either their firsthand experience for similar products or they depend on experiences of other people they trust.
Word-of-mouth diffusion is a well-known phenomena by which information can reach to large populations, possibly influencing public opinion, causing adoption of innovations or brand awareness [1]. In a network of people, there are special individuals whom people have a certain trust level. These special people demonstrate desirable attributes such as credibility, expertise, or enthusiasm, or the connections they have in the network allow them to influence a disproportionately large number of others, directly or indirectly via a cascade of the influence [2]. These special individuals are called as influencers. What those special individuals say has a potential to influence the people on their adjacency and may cause a word-of-mouth diffusion effect.
Detection of influencers in a network is a hot topic and there are numerous methods proposed for achieving the same goal. Since networks get larger in scale, finding a single influencer can not be sufficient to diffuse the desired information throughout a large portion of the network. Instead of starting with only one influencer, it is an intuitive action to choose a set of influencers and push the desired information via the set of influencers and maximizing the reach of the information in the network. The proportion of the individuals in the network who are directly or indirectly (via a cascading effect) informed about the information to the whole network is called network coverage of the set of influencers. Now the problem is finding a minimum set of influencers to maximize the network coverage.
Instead of finding all influencers in a network, which may become impractical even in small networks, if we can find a smart way of delivering a limited number of promotional items to the most meaningful people in the network. Then it may become a way of imposing hidden advertisements with much lower costs. A simple approach is using viral marketing strategy, which depends on finding the most influencing set of people in the community and delivering a limited number of promotional items among the influencers. After these promotional deliveries, we expect that the piece of information reaches to the majority of the social network.
II Background
There are several mathematical and computational models to represent networks and influencers [3, 4, 5, 6, 7, 8, 9].
It is a common approach to label each node with a (preferably numeric) metric, then sorting all the nodes according to the given numeric label, and consider the top ones. One assumption is that an influencer should be highly connected. Then, if all nodes have the same importance, “degree” is the most intuitive network metric used for this goal. We can extend degree centrality to the cases where nodes have different importance. If being connected to important nodes become important then we end up with “eigenvalue centrality”. “-shell decomposition” model is another method for dismantling the social network and grouping similar individuals together according to their topological attributes in the network [6].
There are many more other methods such as LeaderRank, VoteRank, InfluenceRank, etc. [7, 8, 9] mostly specialized with a single type of network, such as Twitter social network. Since we try to find a generalized way, we did not use the mentioned specialized models.
II-A Definitions and Approach
Let be a network, where is the set of vertices and is the set of edges. Let and . Let be the degree of node in the network.
Let function assign a number to each node according to criterion . Suppose the number assigned to a node is related to its influence such as degree, eigenvalue and -shell number. Then we rank the nodes according to their influence values and select the top as the most influential nodes.
II-B Metrics
An influencer is opinionated, respected and well-connected. In a social network, individuals who have connections to many others might have more influence, more access to information or more prestige than those who have less connections [10]. There are influencers having a hybrid combination of these three attributes, such as a well-connected and opinionated individual may earn respect in the network and become an influencer. Since well-connectedness is easy to compute, there are several metrics on it. In network science, well-connectedness is commonly associated with centrality. Below given the three centrality metrics we used for benchmarking.
-
•
Degree centrality (Dg). Degree centrality measures connectivity when every node is of the same importance [10]. Degree of a node is defined as the number of nodes that it is directly connected to. Then define number assignment as .
-
•
Eigenvector centrality (Eg). If we extend degree centrality to the cases where connected to an important node is more important, we end up with eigenvalue centrality [10].
-
•
PageRank (Pr). Another node ranking commonly used is PageRanking [10].
II-C -shell Decomposition
-shell decomposition method partitions the network into a layered structure, called shell, which is similar to the structure of an onion. The innermost shell is called core and other shells are called -shells [11].
This way, the method assigns an integer shell index to each node that represents the connectivity patterns of the node in the network.
Nodes located at the periphery of the network will have low values of , while nodes located at the inner shells are assigned higher values of .
-shell decomposition method prunes the network iteratively and in each iteration, it removes nodes according to their degrees.
The pruning process first removes the nodes of degree 1, i.e., . As a result, some nodes with become of degree 1. Pruning repeats until there is no node with . Hence the remaining nodes have degree . Nodes pruned at this stage are labeled with shell index of 1 i.e., . The next stage is pruning of nodes of degree , which results of nodes of shell index of 2. Pruning repeats the process on the remaining network for higher to extract other shells. The process runs until there is no node left. At the end, every node is labeled with its corresponding shell index . Note that all the nodes in the same shell share the same shell index. So shell index by itself is not a very refined ranking since many nodes will be ranked the same.
Kitsak et al. [6] states that the most strongly connected nodes who may have the strongest probability of spreading occupy high -shells. Since nodes laying in same -shell roughly have similar connectivity, they perform similar spreading capabilities.
II-D Infection Spreading Model
Ideas spread like infections spread, using the connections between people in a network of people. We used infection spreading model to compare our approach to other approaches.
A very common way to model the infection spreading mechanics is following compartmental models in epidemiology. In these type of models, the population is divided into compartments and it is assumed that the individuals in same compartment perform same characteristics. Infection Spreading Model [3] is a popular yet simple compartmental model, which is able to represent the spreading process. There are three compartments in foundation: Susceptible (S), Infected (I) and Recovered (R). In principle, a susceptible node becomes infected as a result of getting in touch with an infected node. Various models describe what happens after a node gets infected.
In SIS model, a susceptible node may become susceptible after they got infected. In SIR, a susceptible node may recover after infection. In SI model, an individual lives with the infection till they die. The models have two parameters.
Parameter is the probability of a susceptible contracting the infection in the case of interacting with an infected. Parameter is the rate an infected node recovers and moves into the resistant phase. To simulate infection spreading, the model is started with a set of seed nodes and expecting other nodes to copy the attributes or the behaviours of the seed nodes.
Label propagation model [4] runs over a society with a particular group carrying an attribute, called label. In each social interaction, individuals copy the label with the highest frequency. At the end, each node has a particular label. When the copying behaviour is reversed, e.g., the attribute is not copied but pushed to the individual forcefully, the term “spread” springs. Rumor spreading model [5] roots to infection spreading model [3]. The model proposes three types of individuals: spreaders, who are willingly spread the rumor in the network; ignorant, who does not care about the rumor, and the stifflers who deliberatively stops the spreading.
| Dataset | # shells | # core | ||
|---|---|---|---|---|
| Epinions [12] | 75,879 | 508,837 | 67 | 486 |
| Email-Eu-core [13, 14] | 1,005 | 25,571 | 34 | 79 |
| Wiki-Vote [15] | 7,115 | 103,689 | 53 | 336 |
| CA-Cond-Mat [13] | 23,133 | 93,497 | 25 | 26 |
| DBLP [16] | 317,080 | 1,049,866 | 113 | 114 |
and is the total number of nodes and edges. # shells is the number of shells found with -shell decomposition. # core is the population of the core.
II-E Data Set
We test our approach on real-life networks [12, 14, 15, 13, 16]. We used a trust network [12], an e-mail network [13, 14], a voting network [15], and two co-authorship networks [13, 16]. The sizes of the networks vary between nodes to nodes. See Table I for network metrics.
-
•
Epinions. This is a who-trust-whom online social network of a general consumer review site Epinions.com [12]. Members of the site can decide whether to trust each other. If a member trusts the member , the graph contains an edge between to .
-
•
Email-Eu-core. This is an anonymized directed network generated using e-mail data from a large European research institution [13, 14].
Let and be two nodes in the network. There is an edge in the network if person sent person at least one e-mail. The e-mails only represent communication between institution members, and the dataset does not contain incoming messages from or outgoing messages to the rest of the world.
-
•
Wiki-Vote. This directed network contains all the Wikipedia voting data for choosing administrators from the inception of Wikipedia till January 2008 [15]. Nodes in the network represent wikipedia users and a directed edge from node to node represents that user voted on user .
-
•
CA-Cond-Mat. This is the Condense Matter Physics collaboration network from arXiv.org [13]. If an author co-authored a paper with author , the graph contains an undirected edge from to .
If the paper is co-authored by authors, this generates a clique of nodes.
-
•
DBLP. The DBLP provides a comprehensive list of research papers in computer science [16]. The network contains co-authorship relationships, where two authors are connected if they publish at least one paper together.
III Proposed Method
We speculate that the approach of Kitsak et al. [6] suffers the problem of using seeds that are too close to each other. That is, if two agents are too close, using both as seeds reduces the potential reach capability.
It is better to use one of them as seed and select another agent that is not “close” to the selected one. Delivering all the seed notes among the members of a particular shell performs weakly in terms of exposing the information to other shells, since they will spread the idea to other informed nodes, not the uninformed nodes. Additionally, since the innermost shell of a real-life network contains incomparably more number of nodes than a practically feasible number of seeds that we want to choose, we need to find a smart way to distribute the information we have.
We propose a method for finding a set of influencers who can maximize the spread of the information in the network, which performs better than degree centrality, eigenvector centrality and -shell decomposition itself. To achieve this, we decompose network using -shell decomposition, then we pick a set of influencers in each shell and the size of the selection for each shell is proportional to the shell’s population. Additionally, we modified SIR model and introduce hyper-short infected state, and propose Uninformed/Informed model.
III-A Combining -shell Number Approach with Communities
The innermost shell includes a highly connected group of nodes. Infecting a subset of the innermost shell may be enough to spread the information to the all nodes in the innermost shell. Instead of selecting all nodes in the innermost shell as seed nodes, we select a subset of them, then we select other nodes from different shells to increase the spreading.
We propose two methods, which focus not only the core but also to other shells when choosing the seed nodes.
-
•
-shell proportional (Ks-P). seed nodes are chosen among different shells, proportional to shell population. When choosing nodes within a shell, we sort the nodes by their degree and select the top nodes. Assume shell populations are 100, 60, 40 from outer shell to inner shell. Proportional seed selection from these shells will result 5, 3, 2 seeds from these shells respectively. If number of shells is greater than number of seeds, then we share seeds starting from the core to outer shells proportional to shell population, until we run out of seeds.
-
•
-shell half proportional (Ks-Hp). Nodes are sorted using their -shell index. First nodes are chosen among the most inner shell. If there are more than nodes in the most inner shell, we sort the nodes by their degree and get top nodes. Remaining seeds are chosen using -shell proportional method.
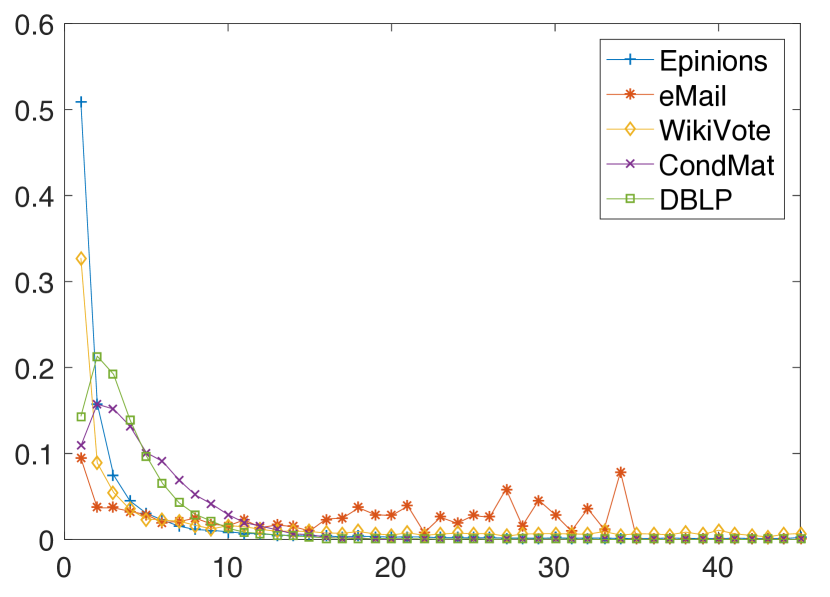
It is expected that the population decreases as one goes to the inner shells. The populations distributions of the shells are given in Fig. 1 for the four networks confirm this. (The first 40 shells are shown only, since the remaining shells are characteristically similar.) But the e-mail data set, is an exception. It behaves similarly in the first 15 shells, but then it follows a different pattern. Populations stop decreasing. This may be due to the fact that e-mail dataset is pruned on creation. It represents an e-mail network among 42 departments in an EU institution and e-mail sent out of the institution were pruned.
IV Method of Comparison
We use slightly modified infection spreading to compare algorithms for influencer detection. Given number of seed nodes , we run two algorithm to identify two sets of influencers. Then we run infection spreading algorithm on the network, where initially the selected influencers are in infected state and the rest of the node in susceptible state. We conclude that the influencer detection algorithm that results higher number of infected nodes is better.
IV-A Uninformed/Informed Model
We modify SIR model of infection spreading to spreading of ideas/opinions. It is clear that once an idea is introduced to a node, there is no way that the node forget the idea. Therefore The model does not have “recovered” state. Hence, we the model has two states: (i) uninformed (U) nodes that are not exposed to the idea and (ii) informed (I) nodes that are already exposed to the idea.
In our era, an individual is exposed to too many ideas every hour, so that they spread the ideas for a very brief time period, to their close acquaintances then stops spreading. Hence in our model, we assume that a node, that is just exposed to the idea, has very short time to share that to its 1-hop neighbors. After that time, they stop sharing.
In this sense, we have “active” informed state that the node is actively sharing and “inactive” informed state, which the node does not share. With this configuration, we start the simulation with a set of “active informed” nodes and the rest of the network is inuninformed state. Representing a social-interaction in real-life, if an active node interacts with an uninformed node, the uninformed node, as in the case of SIR model, gets the idea with probability of and becomes an active informed. Hence ready to propagate the idea even further. When is chosen too large, the information spreads to entire network. When it is chosen too small, no matter how to choose the spreaders, the information cannot be spread over the network at all. To compare the methods clearly, we use , which is a typical value in this domain [8]. Notice that we do not need parameter .
IV-B Comparison
We set the nodes, that are indicated as influencers by an influencer detection algorithm, to informed state. Then let the idea propagate in the network by simulating the uninformed/informed model. We give enough time to simulation to converge, i.e., no further propagation occurs. We define the performance of an influencer detection algorithm by the percentage of the nodes that are in the informed state at the end of the simulation. Clearly, this is a stochastic process, therefore the average of realizations is reported. An influencer detection algorithm with the highest percentage of propagation is the best one.
V Experiments
We run two sets of experiments. In the first set, we picked a fixed number of seed nodes independent of the network size. In the second set, we set the number of seed nodes proportional to the size of the network. In both sets of experiments, we compare Degree (Dg), Eigenvector Centrality (Eg), PageRank (Pr), -shell (-shell) methods with our proposed methods, namely, -shell proportional (Ks-P) and -shell half proportional (Ks-Hp).
Experiment with fixed number of seeds. In many promotional campaigns, the budget has a well-defined limit such as a fixed amount of money or a number of promotional items. To mimic such cases, we assumed that there are a fixed number of seed nodes, which is independent of the target size, i.e., the number of nodes. We choose , which happens to be of the size of the smallest network in our dataset.
Experiment with proportional number of seeds. A more reasonable scenario is to select proportional to the network size. For this case, we arbitrarily select of the network size, i.e., . This enables us to compare results of the two experiments. Note that in the first experiment we used of our smallest network, e-mail network, as the seed. So the results of Email network in both figures are the same.
V-A Discussion
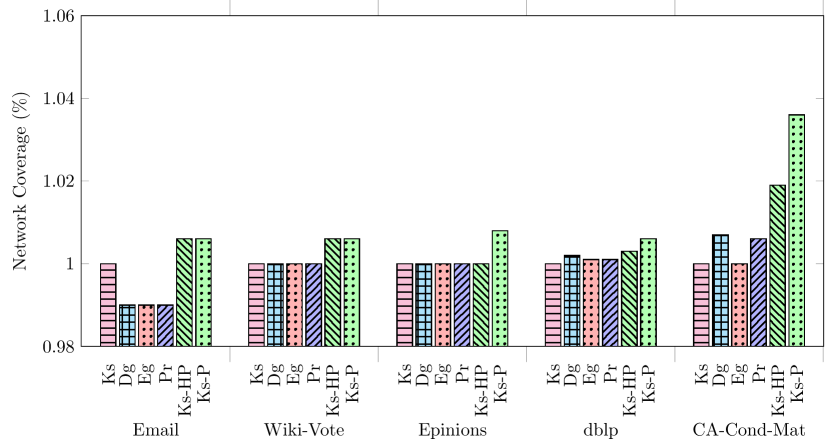
We compare each algorithm by running them on our five data sets and observing their network coverages. One could provide the percentage of coverages but the results are quite close to each other, especially in the small networks such as Email and Wiki-Vote networks. So we prefer another presentation. Since our proposed algorithms are based on -shell algorithm, we use the network coverage of -shell algorithm as the comparison unit. The coverages of other algorithms are presented as relative to that of -shell, which we call it relative coverage. Clearly the relative coverage of -shell would be 1 in this presentation. Any algorithm with better coverage than that of -shell would have a relative coverage that is larger than 1. In Fig. 2 and Fig. 3 relative coverages of the algorithms are grouped for each network for ease of comparison.
The first set of experiments uses 100 seed nodes which is clearly insufficient for the spreading of the ideas in larger networks. In Fig. 2 we observe that all algorithms perform identical for eMail and Wiki-Vote.
Our algorithm, Ks-P performs slightly better () in Epinions DBLP and CA-Cond-Mat. Although Ks-P is slightly better than other algorithms given a fixed number of seed nodes, it can be clearly seen larger networks requires larger set of seeds.
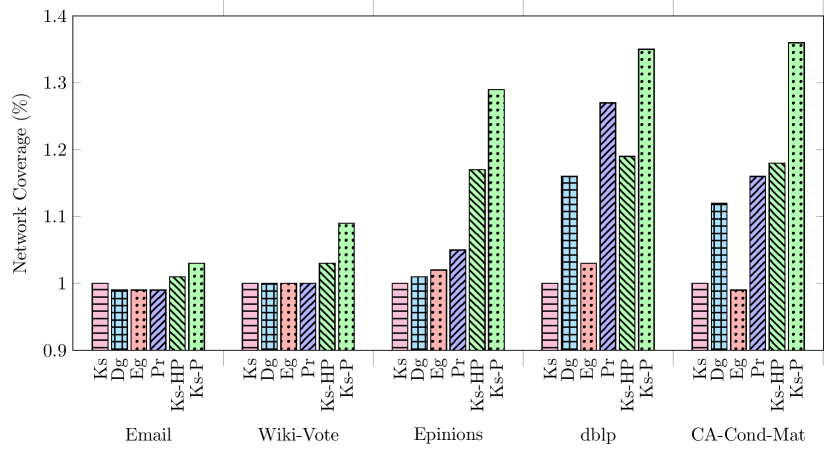
The results of the second experiment are given in Fig. 3.
Our algorithms are slightly better performed. Interestingly, while for the other networks degree and eigenvector centrality outperform -shell, they perform poorly compared to -shell in this network.
This may be because of the pruning of the e-mails that goes to outside of the organization.
For Wiki-Vote network, which is the second smallest network, algorithms degree, eigenvector centrality and -shell have so similar performances that even our presentations cannot visualized the differences. Our algorithms are clearly better performed in this network. Especially our proportional algorithm, Ks-P, has almost better relative coverage. That is, around more nodes in a network of nodes.
Starting Epinions network, degree and eigen vector outperform -shell. Yet our algorithms are clearly much better. Ks-Hp gets almost , and Ks-P close to more relative coverage. That means and more nodes in a network of 75,879.
In DBLP network, all algorithms perform better than -shell while Ks-P manages to reach to relative coverage of more than . That means an impressive additional more nodes in a network of nodes. Note that this time degree becomes the fourth after Pr and Ks-Hp.
In CA-Cond-Mat network Ks-P performs its best with a relative coverage of . Relative to -shell Ks-P can reach to more nodes in a network of nodes.
The results indicates that, our method, Ks-P outperforms existing methods by 3-36%.
VI Conclusion
Since word-of-mouth diffusion is an important model for exposing and information into a network of individuals, finding a set of influencers in the network becomes an important task in viral marketing. In this study, we proposed an extension to -shell decomposition method for maximizing the network coverage with the same size of set of influencers. Our experiments demonstrate that our method outperforms degree centrality, eigenvector centrality and -shell method, which is up to 36% better than the mentioned algorithms in different datasets.
Acknowledgment
We used NepidemiX Python Package to implement the model [17].
References
- [1] E. Bakshy, J. M. Hofman, W. A. Mason, and D. J. Watts, “Everyone’s an influencer: Quantifying influence on twitter,” in Proceedings of the Fourth ACM International Conference on Web Search and Data Mining. ACM, 2011, pp. 65–74.
- [2] M. Gladwell, The Tipping Point: How Little Things Can Make a Big Difference. Little, Brown and Company, 2000.
- [3] R. M. Anderson and R. M. May, Infectious Diseases of Humans: Dynamics and Control. Oxford University Press, 1992.
- [4] U. N. Raghavan, R. Albert, and S. Kumara, “Near linear time algorithm to detect community structures in large-scale networks,” Physical Review E, vol. 76, no. 3, p. 036106, 2007.
- [5] D. J. Daley and D. G. Kendall, “Stochastic rumours,” IMA Journal of Applied Mathematics, vol. 1, no. 1, pp. 42–55, 1965.
- [6] M. Kitsak, L. K. Gallos, S. Havlin, F. Liljeros, L. Muchnik, H. E. Stanley, and H. A. Makse, “Identification of influential spreaders in complex networks,” Nature Physics, vol. 6, no. 11, p. 888, 2010.
- [7] L. Lü, Y.-C. Zhang, C. H. Yeung, and T. Zhou, “Leaders in social networks, the delicious case,” PLOS ONE, vol. 6, no. 6, p. e21202, 2011.
- [8] J.-X. Zhang, D.-B. Chen, Q. Dong, and Z.-D. Zhao, “Identifying a set of influential spreaders in complex networks,” Scientific Reports, vol. 6, p. 27823, 2016.
- [9] B. Hajian and T. White, “Modelling influence in a social network: Metrics and evaluation,” in Privacy, Security, Risk and Trust (PASSAT) and 2011 IEEE Third Inernational Conference on Social Computing (SocialCom), 2011 IEEE Third International Conference on. IEEE, 2011, pp. 497–500.
- [10] M. Newman, Networks. Oxford University Press, 2018.
- [11] A. Garas, F. Schweitzer, and S. Havlin, “A k-shell decomposition method for weighted networks,” New Journal of Physics, vol. 14, no. 8, p. 083030, 2012.
- [12] M. Richardson, R. Agrawal, and P. Domingos, “Trust management for the semantic web,” in International Semantic Web Conference. Springer, 2003, pp. 351–368.
- [13] J. Leskovec, J. Kleinberg, and C. Faloutsos, “Graph evolution: Densification and shrinking diameters,” ACM Transactions on Knowledge Discovery from Data (TKDD), vol. 1, no. 1, p. 2, 2007.
- [14] H. Yin, A. R. Benson, J. Leskovec, and D. F. Gleich, “Local higher-order graph clustering,” in Proceedings of the 23rd ACM SIGKDD International Conference on Knowledge Discovery and Data Mining. ACM, 2017, pp. 555–564.
- [15] J. Leskovec, D. Huttenlocher, and J. Kleinberg, “Signed networks in social media,” in Proceedings of the SIGCHI Conference on Human Factors in Computing Systems. ACM, 2010, pp. 1361–1370.
- [16] J. Yang and J. Leskovec, “Defining and evaluating network communities based on ground-truth,” Knowledge and Information Systems, vol. 42, no. 1, pp. 181–213, 2015.
- [17] (2018) Nepidemix python library. [Online]. Available: http://nepidemix.irmacs.sfu.ca/about.html