Detection of Planetary and Stellar Companions to Neighboring Stars via a Combination of Radial Velocity and Direct Imaging Techniques
Abstract
The sensitivities of radial velocity (RV) surveys for exoplanet detection are extending to increasingly long orbital periods, where companions with periods of several years are now being regularly discovered. Companions with orbital periods that exceed the duration of the survey manifest in the data as an incomplete orbit or linear trend, a feature that can either present as the sole detectable companion to the host star, or as an additional signal overlain on the signatures of previously discovered companion(s). A diagnostic that can confirm or constrain scenarios in which the trend is caused by an unseen stellar, rather than planetary, companion is the use of high-contrast imaging observations. Here, we present RV data from the Anglo-Australian Planet Search (AAPS) for twenty stars that show evidence of orbiting companions. Of these, six companions have resolved orbits, with three that lie in the planetary regime. Two of these (HD 92987b and HD 221420b) are new discoveries. Follow-up observations using the Differential Speckle Survey Instrument (DSSI) on the Gemini South telescope revealed that five of the twenty monitored companions are likely stellar in nature. We use the sensitivity of the AAPS and DSSI data to place constraints on the mass of the companions for the remaining systems. Our analysis shows that a planetary-mass companion provides the most likely self-consistent explanation of the data for many of the remaining systems.
1 Introduction
Radial velocity (RV) surveys for exoplanets have now been operating over sufficiently long temporal baselines that their sensitivity extends out to semi-major axes of several AU around other stars (Wright et al., 2008; Wittenmyer et al., 2011, 2016). This means that the requirement of measuring a complete planetary orbital phase is fulfilled for direct Jupiter analogs. Beyond this orbital regime, the RV data cover a fraction of the total orbital phase, and the sensitivity of experiments to Uranus/Neptune analogs (Kane, 2011) and the occurrence rate of long-period giant planets is more adequately covered by exoplanet surveys using the microlensing (Cassan et al., 2012; Mróz et al., 2017; Penny et al., 2019) and imaging (Meshkat et al., 2017; Kopparapu et al., 2018; Stone et al., 2018) techniques. Long-period planets also present a compelling advantage due to thw synergy between RV and astrometric observations, wherein such planets impart a significant reciprocal astrometric motion on their host star (Eisner & Kulkarni, 2002). With the advent of the extremely high astrometric precision offered by observations carried out by the Gaia spacecraft (Gaia Collaboration et al., 2016, 2018), such motion should be readily detected. As the RV method measures the line-of-sight motion of a star, and the astrometric method measures motion at right angles to the line of sight, combining data from these two methods will allow the orbits and masses of currently unseen companions to be precisely calculated, a result of great interest to the exoplanet community.
Detectable companions to host stars moving on long-period orbits typically manifest in the form of curvatures or linear trends in RV data. Such trends reveal which stars should continue to be monitored, but also present significant challenges to providing a complete characterization of the companion’s orbit as well as limiting constraints on the companion mass (Eisner & Kulkarni, 2002; Wright & Howard, 2009). A major problem with such incomplete orbital coverage is that the observed trends could be the result of a much larger, possibly stellar, mass companion moving on a very long period orbit. There are numerous surveys that aim to resolve the potential presence of stellar companions through the combination of RV data exhibiting linear trends and high-resolution imaging data that should be able to directly detect such companions (Kane et al., 2014; Crepp et al., 2016; Wittrock et al., 2016, 2017; Crepp et al., 2018; Kane et al., 2019). High-resolution imaging has also played an important role in the validation of small transiting exoplanets orbiting relatively faint host stars (Everett et al., 2015), such as those detected by the Kepler mission (Howell et al., 2011; Quintana et al., 2014) and the case of the TRAPPIST-1 system (Howell et al., 2016).
One of the longest running RV surveys is that carried out by the Anglo-Australian Planet Search (AAPS), which detected their first planet (orbiting HD 179949) at the turn of the millennium (Tinney et al., 2001). Since then, the survey has focused on improving their sensitivity to giant planets beyond the snow line through continued observations in order to aid with the development of planet formation theories for solar system analogs (Wittenmyer et al., 2016). As a result of the long temporal baseline and precision achieved by AAPS, the survey is an ideal source of suitable targets for direct imaging surveys (Kane et al., 2018), and for studies investigating the occurrence rate of giant planets in the Habitable Zone (HZ) of their host stars (Hill et al., 2018). However, the parameter space of star–planet separation is exceedingly large, and a full investigation of long-period planets beyond 10 AU using the RV technique would require the ongoing monitoring of target stars for timescales of decades to come, albeit at relatively low cadence.
In this paper we present new results from a survey that aims to study the cause of RV signatures detected for nearby stars. In Section 2 we provide RV data from the AAPS for twenty stars that show evidence of a companion, and present the orbital solutions for 6 companions including two new planet discoveries. In Section 3 we further provide the results of a follow-up observing campaign using the Differential Speckle Survey Instrument (DSSI) operating on the Gemini South telescope. These data reveal that 5 of the 20 target stars have stellar companions that potentially explain the signatures observed in the RV data, described in detail in Section 4. We quantify the mass limits on planetary companions for the remaining 15 stars in Section 5, and provide a description of potential additional observations together with our concluding remarks in Section 6.
2 Radial Velocity Variations
The AAPS is one of the “legacy” RV surveys, having gathered data for 17 years between 1998 and 2015. The AAPS used the UCLES high-resolution spectrograph (Diego et al., 1990) on the 3.9m Anglo-Australian Telescope (AAT) to deliver a consistent velocity precision of 2–3 m s-1. An iodine absorption cell provided wavelength calibration from 5000 to 6200 Å. The spectrograph point-spread function and wavelength calibration were derived from the iodine absorption lines embedded on the spectrum by the cell (Valenti et al., 1995; Butler et al., 1996). The use of the same iodine calibration cell and same target list for 17 years have made the AAPS a pioneer in the detection of long-period planets, in particular “Jupiter analogs”: giant planets with orbital periods years (e.g. Butler et al., 2006; Jones et al., 2010; Wittenmyer et al., 2014, 2016).
| Star | RV (m s-1) | (m s-1 day-1) | (pcs) | () | (K) | [Fe/H] | |||
|---|---|---|---|---|---|---|---|---|---|
| Keplerian orbits | |||||||||
| HD 45701 | 2416.41 | – | 35 | 6.45 | 31.8 | 5886 | 4.28 | 0.16 | |
| HD 92987 | 308.31 | – | 53 | 7.03 | 44.0 | 5774 | 4.06 | 0.03 | |
| HD 145825 | 2180.14 | – | 17 | 6.55 | 21.9 | 5803 | 4.49 | 0.03 | |
| HD 212330 | 5838.34 | – | 33 | 5.31 | 20.5 | 5739 | 4.15 | 0.01 | |
| HD 219077 | 369.95 | – | 72 | 6.12 | 29.2 | 5364 | 4.05 | -0.10 | |
| HD 221420 | 104.69 | – | 88 | 5.82 | 31.8 | 5830 | 4.08 | 0.29 | |
| Trends | |||||||||
| HD 51929 | 494.32 | 16 | 7.39 | 37.6 | 5805 | 4.43 | -0.48 | ||
| HD 52447 | 664.60 | 24 | 8.38 | 78.6 | 6051 | 4.23 | 0.23 | ||
| HD 80913 | 143.61 | 35 | 7.49 | 64.1 | 5983 | 4.05 | -0.60 | ||
| HD 100623 | 39.92 | 104 | 5.96 | 9.5 | 5189 | 4.68 | -0.32 | ||
| HD 108309 | 23.66 | 69 | 6.25 | 26.7 | 5778 | 4.26 | 0.09 | ||
| HD 117939 | 56.31 | 35 | 7.29 | 30.2 | 5671 | 4.46 | -0.17 | ||
| HD 161050 | 1158.85 | 31 | 7.16 | 49.5 | 5980 | 4.14 | -0.06 | ||
| HD 166553 | 205.70 | 43 | 7.30 | 42.4 | 5960 | 4.17 | 0.03 | ||
| HD 191408 | 67.12 | 187 | 5.30 | 6.1 | 4922 | 4.58 | -0.33 | ||
| HD 199509 | 431.16 | 33 | 6.98 | 24.2 | 5770 | 4.55 | -0.27 | ||
| HD 207700 | 60.80 | 36 | 7.43 | 39.8 | 5680 | 4.39 | 0.09 | ||
| HD 212708 | 229.62 | 38 | 7.48 | 35.8 | 5689 | 4.39 | 0.24 | ||
| HD 214953 | 38.15 | 83 | 6.30 | 23.6 | 6049 | 4.29 | 0.03 | ||
| HD 217958 | 112.34 | 37 | 8.05 | 53.7 | 5962 | 4.40 | 0.26 | ||
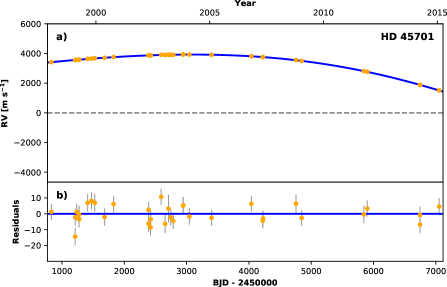
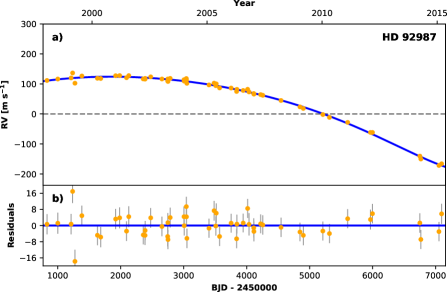
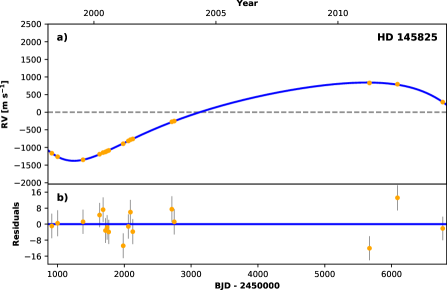
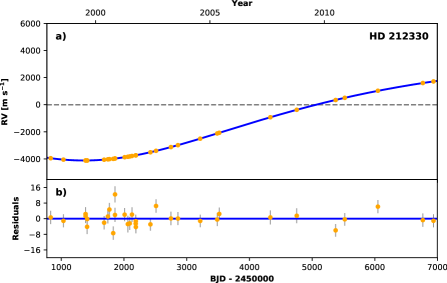
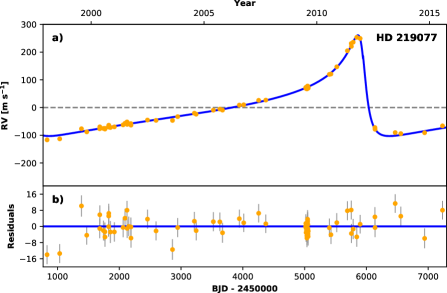
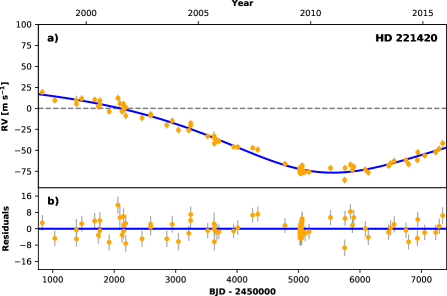
In this work, we considered a total of twenty targets, for which a variety of RV signals had been measured by the AAPS. A summary of the targets, including the host star properties, RV variability (range), and RV trend () is shown in Table 1. The host star properties were all extracted from the same source, namely the Spectroscopic Properties of Cool Stars (SPOCS) catalog compiled by Valenti & Fischer (2005), in order to provide a self-consistent sample of stellar information. As specified by Valenti & Fischer (2005), the uncertainties in the stellar parameters are 44 K in , 0.06 dex in , and 0.03 dex in [Fe/H]. In the majority of cases (fourteen out of twenty), the temporal baseline of the RV datasets is insufficient to reasonably constrain the parameter space Keplerian orbital solutions. We therefore broadly divide our sample into those with Keplerian orbital solutions and those that are best represented with a linear trend, shown at the top and bottom of Table 1 respectively. For the Keplerian orbital solution sample, we require that the data contain evidence of a quadrature (“turn around”) point that will enable a sufficient constraint to the orbital period. For the six companions with sufficient data for a Keplerian orbit fit, the orbital solutions are shown in Table 2, and the data with fits and residuals are shown in the panels of Figure 1. The RV data were fit using the RadVel package (Fulton et al., 2018)111https://radvel.readthedocs.io/en/latest/, modified to allow for massive companions outside of the planetary regime (Kane et al., 2019). For the fourteen companions detected as a roughly linear trend, the trends are quantified in Table 1 in units of m s-1 day-1, and the data for these targets are shown in the panels of Figure 2.
| Parameter | HD 45701 | HD 92987 | HD 145825 | HD 212330 | HD 219077 | HD 221420 |
|---|---|---|---|---|---|---|
| (days) | ||||||
| (years) | ||||||
| (BJD) | ||||||
| (deg) | ||||||
| (m s-1) | ||||||
| () | ||||||
| (AU) | ||||||
| rms (m s-1) | 5.37 | 5.36 | 6.20 | 3.70 | 4.76 | 3.93 |
| 1.26 | 1.25 | 1.71 | 1.34 | 1.13 | 1.12 |
 |
 |
 |
 |
 |
 |
 |
 |
 |
 |
 |
 |
 |
 |
For the six companions described in Table 2, three have minimum masses in the stellar regime and three have minimum masses in the planetary regime. Of those in the stellar category, the companion to HD 145825 was previously published by Jenkins et al. (2010) using a subset of the data presented in this work. Their analysis produced an estimated minimum mass based on an incomplete orbit of , also presenting imaging data that were unable to reveal the suspected stellar companion. Our additional RV data, acquired in the years following that publication, result in a closed orbital solution, and a new minimum mass for the companion of , or , which is comfortably in the stellar regime. Of those in the planetary category, the highly eccentric planet HD 219077b was previously discovered by Marmier et al. (2013). Our Keplerian orbital parameters of the planet presented in Table 2 are in close agreement with those provided by Marmier et al. (2013), and the lower planet mass of 10.39 is attributable to the lower stellar mass 1.05 used by Marmier et al. (2013) in their calculations. The two other planets presented here, HD 92987b and HD 221420b, are new discoveries with masses of 17.9 and 9.7 respectively.
3 Imaging Observations
In order to attempt to confirm or constrain the presence of potential stellar companions to these RV trend stars, we used DSSI whilst it was at the Gemini South Telescope as a visitor instrument. Most of the data were taken during a run that occurred 2017 June 6 through 12, with a few objects added during a second run that occurred 2018 October 26 through 2018 November 5. The instrument itself was originally described in Horch et al. (2009), and a subsequent upgrade to its current configuration, which uses two electron-multiplying CCDs, is detailed in Horch et al. (2011). The instrument magnifies the image received at the telescope focal plane so that individual speckles are critically sampled, and it also sends the light in the collimated beam through a dichroic beamsplitter. Once re-imaged onto the two detectors, this allows for two different speckle patterns to be simultaneously recorded in two filters. For all of the observations discussed here, these were a 692-nm filter with a bandpass of 40 nm, and an 880-nm filter with a bandpass of 50 nm.
Horch et al. (2011) also described the reduction process for companion detection when observing with DSSI, which we review briefly here. A sequence of short-exposure (60 ms) images is taken of the target, resulting in two fits data cubes, one for each filter. The standard file contains 1000 images; for fainter targets, more fits cubes are recorded in sequence, and the results are combined in the analysis phase. To have an estimate of the speckle transfer function at the time of the observation, a bright point source that is close to the science target in the sky position is observed either right before or right after each science target. Beacause these stars are bright, even a single 1000-frame sequence yields a very high signal-to-noise ratio with which to complete a deconvolution in the analysis phase.
The analysis begins with the calculation of autocorrelation functions and image bispectra from the raw data frames. These are then used to generate diffraction-limited reconstructions of each star in the Fourier plane using the method of Lohmann et al. (1983). Upon Fourier-transforming the autocorrelation, the spatial frequency power spectrum is obtained. If a similar calculation is performed on the point-source observation, then its power spectrum can be used to deconvolve the speckle transfer function from the science target’s power spectrum via simple division. By taking the square root of the result, the diffraction-limited modulus of the object’s Fourier transform is obtained. The bispectrum contains within it an estimate of the derivative of the phase of the object’s Fourier transform. Reconstructing the phase from the bispectrum is completed with the relaxation algorithm of Meng et al. (1990). By combining with the modulus, a diffraction-limited estimate of the full, complex-valued transform is obtained. This result is low-pass filtered with a Gaussian function, and inverse-transformed to arrive at the final reconstructed image.
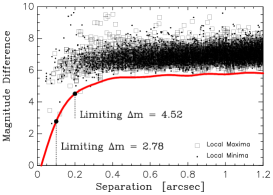
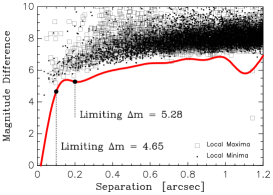
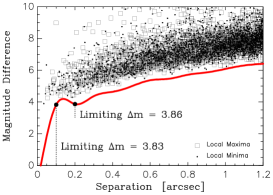
Companion detection is performed by studying the reconstructed image and examining the statistics of local maxima and minima in the image as a function of separation from the primary star (Horch et al., 2011). We draw a sequence of concentric annuli centered on the primary star, and determine the average value of local maxima and local minima, and their standard deviations. This allows us to estimate for each annulus what the 5 value above the noise is as a function of separation. Values are associated with the center radius of each annulus, which is chosen at 0.1-arcsecond intervals. To produce a continuous curve, we make a cubic-spline interpolation between the final values, and assume that, at the diffraction limit, our sensitivity to companions goes to a of 0. If a peak in the image exceeds the 5 value for its separation, then it is studied as a possible companion. Generally, if a similar peak occurs in images of both filters, this is judged to be confirmation of the detection of a stellar component. Occasionally, very red components are only detected in the redder filter; these detections must be viewed as less certain until follow-up observations can confirm the result.
4 Detection of Stellar Companions
 |
 |
 |
 |
 |
 |
 |
 |
 |
 |
 |
 |
 |
 |
 |
 |
 |
 |
 |
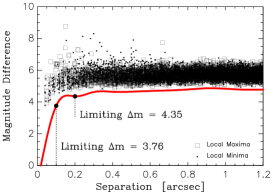 |
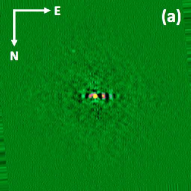
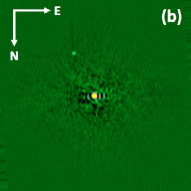
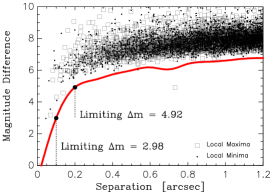
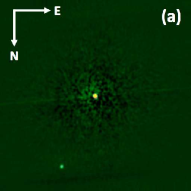
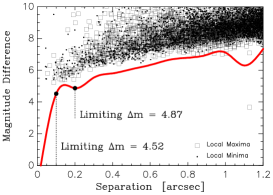
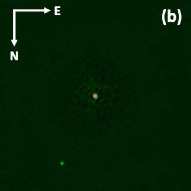
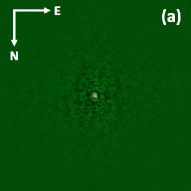
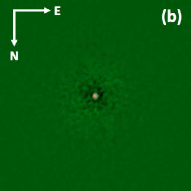
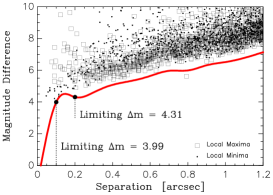
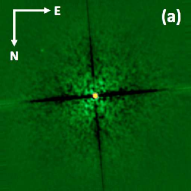
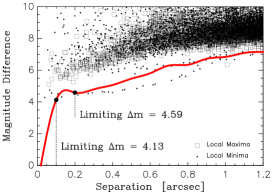
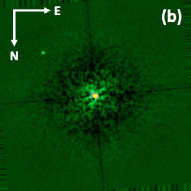
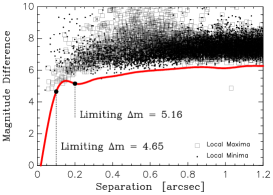
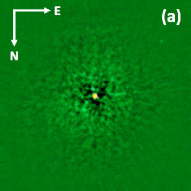
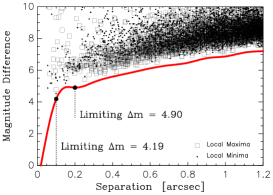
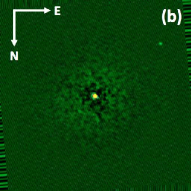
Using the methodology described in Section 3, we examined the DSSI data for all twenty targets. Of those, five showed significant evidence of a possible stellar companion to the host star. Specifically, stellar companion evidence was found for the following targets: HD 51929, HD 166553, HD 212330, HD 212708, and HD 217958. The DSSI images for each of these five targets are shown in Figure 3, for both the 692 nm (a) and 880 nm (b) passbands. Each of the images have a field-of-view of 2.82.8 and are oriented such that north is down and east is to the right. The contrasts of the images were selected to enhance the visibility of the detected companions, though this was challenging for the companion to HD 212330. To the right of each panel are the limiting magnitude plots constructed from each of the images (see Section 3), where the data represent local maxima and minima and the solid curve is a cubic spline interpolation of the 5 detection limit. We derived the properties of the stellar companions using the methodology described by Horch et al. (2004). The details regarding the DSSI derived properties of the stellar companion are shown in Table 3, including the position angle (PA), the separation from the host star (sep), and the difference in magnitude from the host star () in both DSSI bandpasses. We estimated the uncertainty of these properties based on previous similar observations using DSSI (Horch et al., 2012): 0.2, 0.0025, and 0.15 mag for PA, sep, and respectively.
| Host Star | Filter (nm) | PA () | Sep () | |
|---|---|---|---|---|
| HD 51929 | 692 | 205.7 | 0.7221 | 5.83 |
| HD 51929 | 880 | 205.4 | 0.7247 | 4.50 |
| HD 166553 | 692 | 334.7 | 1.1319 | 3.55 |
| HD 166553 | 880 | 334.7 | 1.1354 | 2.91 |
| HD 212330 | 692 | 62.2 | 0.7655 | 6.65 |
| HD 212330 | 880 | 61.7 | 0.7653 | 5.50 |
| HD 212708 | 692 | 229.2 | 1.0103 | 6.48 |
| HD 212708 | 880 | 229.2 | 1.0122 | 5.27 |
| HD 217958 | 692 | 129.5 | 1.2570 | 6.51 |
| HD 217958 | 880 | 129.6 | 1.2509 | 4.20 |
| Host Star | Spectral Type | Color Offset () | Bound Probability (%)† | Comments | |
|---|---|---|---|---|---|
| HD 51929 | M4 | 6.53 | 2.37 | 29 | |
| HD 166553 | M0 | 4.17 | 1.18 | 14 | |
| HD 212330 | M6 | 8.33 | 0.04 | 25 | |
| HD 212708 | M6 | 7.93 | 0.60 | 14 | |
| HD 217958 | M5 | 7.48 | 4.75 | Additional observations needed |
The question remains as to whether the detected companions are gravitationally bound to the host star. Analysis of DSSI data for Kepler exoplanet candidate host stars by Horch et al. (2014) used a statistical approach to demonstrate that most of the detected companions within the DSSI separation range are indeed bound to the host, with similar results found by Matson et al. (2018).
We applied the results of Matson et al. (2018) from the Gemini telescope to approximate the probability that the companions were gravitationally bound based only on angular separation. These estimates are shown in Table 4. For all targets except HD 217958, the Matson et al. (2018) results suggest that there is a relatively low probability of being bound. The angular separation of the companion to HD 217958 fell outside the range of the Matson et al. (2018) investigation, meaning that the angular separation is insufficient as an indicator that the companion is bound.
The color information provided by the two DSSI filters also allows for an isochrone analysis to determine if there are significant differences between the observed and predicted companion properties. The isochrones were extracted from the Dartmouth Stellar Evolution Database (Dotter et al., 2008). We used the values for each filter shown in Table 3 to interpolate down the Dartmouth isochrones from the position of the primary (as determined by the stellar properties shown in Table 1) to the position of a hypothetical bound companion with the measured contrast. We performed this translation down the isochrones for each of the measured values, then defined a companion model from the weighted average of these individual models. This analysis results in a predicted model color for the companion, that we compare against the measured color of the companion, as detailed by Hirsch et al. (2017). A color offset of between the observed and modeled companion color is taken to imply that the object is gravitationally bound.
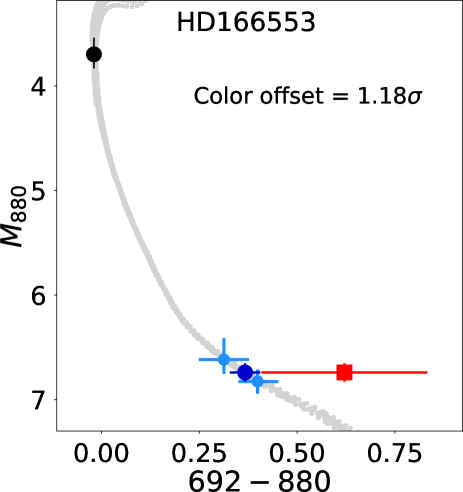
The case of isochrone analysis for HD 166553 is shown as an example in Figure 4. The isochrone track for the primary is shown in light gray and the positions of the secondary for the 692 nm and 880 nm filters are shown in light blue. The weighted average of these positions, shown in dark blue, was compared to the observed color of the secondary, shown in red, and then we calculated the color offset between the model color and observed color in units of the measured uncertainty. As shown in Figure 4, the color offset for the HD 166553 case is 1.18 which is within the 3 criteria adopted by Hirsch et al. (2017). The color offsets for the other four cases are listed in Table 4. Only the companion to HD 217958 does not meet the described criteria, lending credence to most of the companions being bound. Note that these results do not mean that the detected object near HD 217958 is not gravitationally bound; rather they indicate that it does not fulfill the assumptions of similar age and formation location that the Hirsch et al. (2017) criteria apply and will require additional observations to verify its bound state.
The measured information regarding the companions and their host stars may be used to provide a rough estimate of the companion spectral types. To do this, we utilized the Pickles spectral library (Pickles, 1998) combined with the measured values for each of the DSSI filters. Using this methodology, we also infer values between the companions and the primaries (see Table 4). When compared with the magnitudes and distances of the host stars (see Table 1), these are consistent with the possible companions having spectral types in the range M4–6, with the exception of the companion to HD 166553 that is closer to M0. Note that these are only approximate estimates of the spectral types and should be treated with caution.
Given the measured separations of the detected objects from the target stars shown in Table 3, we performed a search of the Gaia second data release (DR2) to check if our detections are also in that catalog (Gaia Collaboration et al., 2018). The only companion present in DR2 is the companion to HD 166553, but the companion does not have a measured parallax, and so a distance could not be established. The for the Gaia passband between the target and companion is 2.92 and the separation is 1.15, both of which are consistent with the DSSI values shown in Table 3. The Gaia detection represents a second epoch and indicates a common proper motion between the target and the companion.
Of further note is that one of the five targets for which a companion was detected, HD 212330, also has a full Keplerian orbital solution (see Table 2). The minimum mass provided by the RV data is consistent with a stellar companion, and the orbital parameters combined with the distance to the host star (see Table 1) result in a maximum angular separation of (Kane, 2013; Kane et al., 2018). Comparison with the angular separation of the detected companion shown in Table 3 indicates that the companion was imaged close to maximum angular separation. This system also has the smallest color offset (0.04) from the isochrone analysis.
5 Combined RV and Imaging Analysis
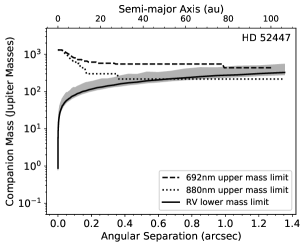
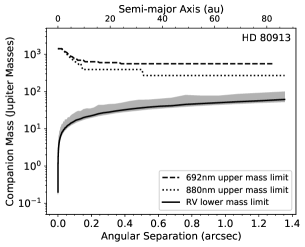
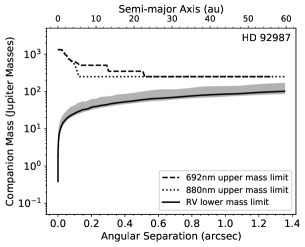
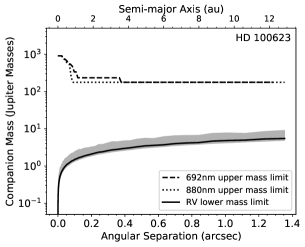
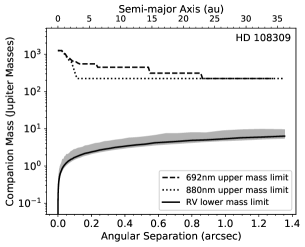
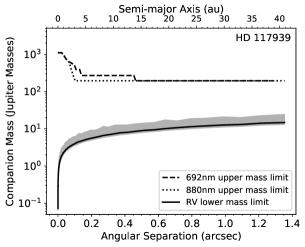
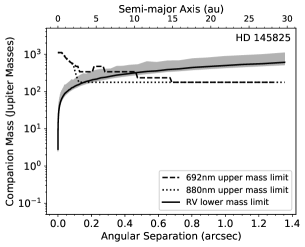
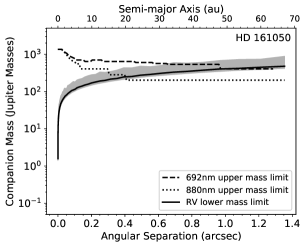
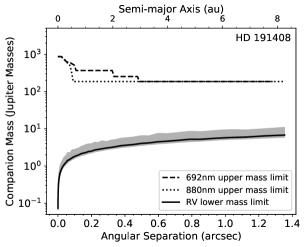
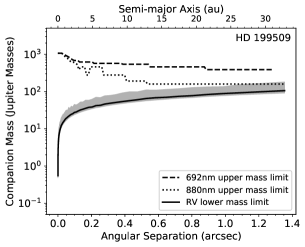
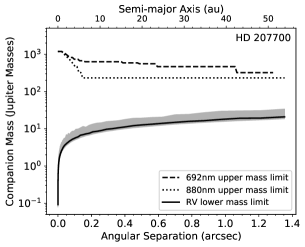
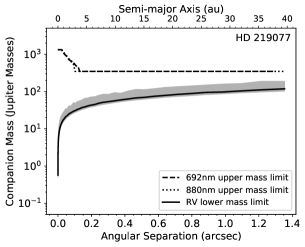
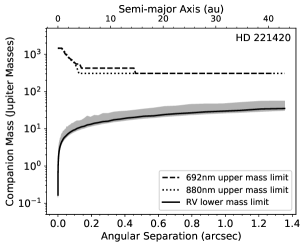
The imaging observations presented in Section 4 yielded upper limits on the masses of potential stellar companions. Here, we define the range of possible planet parameters by combining the imaging and RV observations for the remaining fifteen targets in the survey.
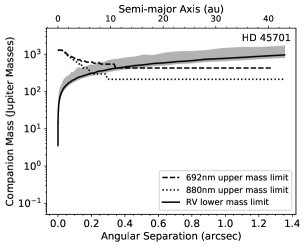
First, we place lower limits on the mass and separation of a companion using the RV observations. Treating the RV range (RV, Table 1) as a lower limit for twice the RV semi-amplitude, we numerically solve the following relation for the minimum mass of a companion () as a function of semi-major axis ():
| (1) |
where is the gravitational constant, is the companion orbital eccentricity, and is the companion orbital inclination. We accounted for the unknown companion eccentricities and inclinations through a Monte Carlo approach. As a function of semi-major axis, we evaluated Equation 1 1,000 times drawing inclination from a uniform distribution in and drawing eccentricity from a Beta distribution with shape parameters and . This Beta distribution is motivated by empirical trends in the eccentricities of RV exoplanets (Kipping, 2013). Note that the use of the Beta distribution assumes that shorter-period RV planets and those presented in this study follow a similar eccentricity distribution.
Second, we place upper limits on the mass and separation of a companion using the imaging observations and following the procedure of Kane et al. (2014). Briefly, we use the known distance to each target system and the mass-luminosity relations of Henry & McCarthy (1993) to estimate the apparent -band magnitude of a possible stellar companion as a function of . Comparison to the known apparent -band magnitude of the host star yields visual values for each target, also as a function of . Then, using the Pickles spectral library (Pickles, 1998) and the transmission curves of each DSSI imaging filter, we transform visual value to speckle values. We compare these to the DSSI limiting magnitude curves of each target to find as a function of angular separation, which we convert to semi-major axis using the distance.
Upper and lower limits for the fifteen targets without directly imaged stellar companions are shown in Figure 5. The lower limits include the 68% confidence region accounting for the unknown inclination and eccentricity. Other than the three cases where stellar companions have been identified from a full Keplerian orbit (see Table 2), the combination of RV and imaging observations generally rules out the presence of stellar companions more massive than several hundred Jupiter masses at most orbital separations.
 |
 |
 |
 |
 |
 |
 |
 |
 |
 |
 |
 |
 |
 |
For several targets, the combination of RV and imaging observations dramatically reduce the size of parameter space where a companion could exist, thereby enabling lower limits on the orbital inclination of a companion. We demonstrate this for HD 45701, HD 145825, and HD 161050, which have RV values of a few km s-1. Using the mass limits from the 880 nm images, we invert Equation 1 to solve for the lower limit on inclination. At small semi-major axes, these limits are weak. However, at wider separations the mass constraints force the inclinations to high values to maintain consistency with the km s-1 RV signals (see Figure 6).
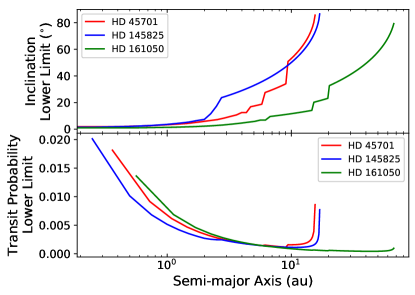
Limits on orbital inclination are highly valuable for considerations of transit probability. Again considering HD 45701, HD 145825, and HD 161050, we approximate the lower limit transit probabilities corresponding to the inclination limits in two steps. First, we approximate the a priori geometric transit probability as , where is the host star’s radius and is the companion radius222We note that the calculation of a posteriori transit probabilities for these RV-detected companions would require a more thorough assessment of underlying mass distribution of giant planet and sub-stellar objects (e.g., Stevens & Gaudi, 2013).. We estimate by applying the known properties of the targets (Table 1) to the relations of Torres et al. (2010). We also assume that all companions have a Jupiter radius. Second, we increase the geometric transit probability by a factor matching the relative decrease in allowed inclination values set by our lower limits. As shown in Figure 6, the inclination limits are strong enough that the transit probability actually begins increasing as a function of for companions at wide separations.
The severe short-orbit bias of the transit method of exoplanet discovery largely prohibits the known sample of transiting exoplanets to those with semi-major axes of several tenths of an AU. For reference, the geometric transit probability of a Jupiter-size companion at 10 AU around a Sun-like star is roughly 0.0005. The detection of a transiting companion to HD 45701 or HD 145825, for which we estimate lower limits on transit probability that are 0.005–0.01 at AU, would be unprecedented. Such a discovery would enable novel characterization efforts, including atmospheric studies via transmission spectroscopy (e.g., Dalba et al., 2015) and dynamical or photometric exomoon searches (e.g., Kipping et al., 2012). Previously, only a small number of known RV exoplanets have been thoroughly observed in search of transits (see Dalba et al., 2019, and references therein) largely due to limitations in photometric follow-up resources. The potentially optimistic transit probabilities of the companions to HD 45701, HD 145825, and HD 161050 make them ideal cases for follow-up transit ephemeris refinement (e.g., Kane & von Braun, 2008). Furthermore, this work demonstrates how combining RV and imaging data to constrain inclination may be used to identify such potentially transiting systems.
6 Conclusions
Over the past few decades, the number of known exoplanets has grown at a dramatic rate. However, the most prolific techniques of RVs and transits contain an intrinsic detection bias toward relatively small star–planet separation that continues to dominate the semi-major axis parameter space that has been explored. It is therefore critical that these and other techniques be pushed toward larger semi-major axis sensitivity to gain deeper insights into overall planetary system architectures.
In this work, we presented the results of an extensive study of twenty stars that show evidence of long-period companions in order to ascertain the possibility that the observed signatures are planetary in origin. As described in Section 1, the technique of pairing RV with high-resolution imaging is widely used to detect potential stellar origins of RV signatures. Of our twenty targets, six have sufficient RV phase coverage to produce Keplerian orbital solutions, of which three are stellar and three are planetary in nature. Five of the twenty targets are revealed via DSSI data to have stellar objects at relatively small angular separations, one of which is amongst those with a Keplerian orbital solution. Thus, half of the sample have either confirmed planetary companions or evidence of bound stellar companions. The remaining ten cases consist of RV linear trends with no directly imaged stellar companion. The analysis of Section 5 utilizes the available data to place constraints on the companion mass, of which the most likely explanation is that a planet with a presently unresolved orbit is the cause of the RV signature. The caveat to the planetary explanation is that the targets may have been observed with DSSI at times when the angular separation between the primary and secondary was too small to detect a stellar signature from the secondary. The ambiguous nature of the orbits in these ten cases make it difficult to plan effective direct imaging observations when the companion would be located at an optimal angular separation from the primary. It is hence important that these targets continue to be monitored with precision RVs to characterize the orbits to enable the confirmation of the planetary hypothesis behind the observed signatures.
Acknowledgements
This work is based on observations obtained at the Gemini South Observatory, which is operated by the Association of Universities for Research in Astronomy, Inc., under a cooperative agreement with the NSF on behalf of the Gemini partnership: the National Science Foundation (United States), National Research Council (Canada), CONICYT (Chile), Ministerio de Ciencia, Tecnología e Innovación Productiva (Argentina), Ministério da Ciência, Tecnologia e Inovação (Brazil), and Korea Astronomy and Space Science Institute (Republic of Korea). We acknowledge the traditional owners of the land on which the AAT stands, the Gamilaraay people, and pay our respects to elders past and present. The results reported herein benefited from collaborations and/or information exchange within NASA’s Nexus for Exoplanet System Science (NExSS) research coordination network sponsored by NASA’s Science Mission Directorate.
References
- Butler et al. (1996) Butler, R. P., Marcy, G. W., Williams, E., et al. 1996, PASP, 108, 500
- Butler et al. (2006) Butler, R. P., Wright, J. T., Marcy, G. W., et al. 2006, ApJ, 646, 505
- Cassan et al. (2012) Cassan, A., Kubas, D., Beaulieu, J.-P., et al. 2012, Nature, 481, 167
- Crepp et al. (2016) Crepp, J. R., Gonzales, E. J., Bechter, E. B., et al. 2016, ApJ, 831, 136
- Crepp et al. (2018) Crepp, J. R., Gonzales, E. J., Bowler, B. P., et al. 2018, ApJ, 864, 42
- Dalba et al. (2019) Dalba, P. A., Kane, S. R., Barclay, T., et al. 2019, PASP, 131, 034401
- Dalba et al. (2015) Dalba, P. A., Muirhead, P. S., Fortney, J. J., et al. 2015, ApJ, 814, 154
- Diego et al. (1990) Diego, F., Charalambous, A., Fish, A. C., & Walker, D. D. 1990, in Proc. SPIE, Vol. 1235, Instrumentation in Astronomy VII, ed. D. L. Crawford, 562–576
- Dotter et al. (2008) Dotter, A., Chaboyer, B., Jevremović, D., et al. 2008, ApJS, 178, 89
- Eisner & Kulkarni (2002) Eisner, J. A., & Kulkarni, S. R. 2002, ApJ, 574, 426
- Everett et al. (2015) Everett, M. E., Barclay, T., Ciardi, D. R., et al. 2015, AJ, 149, 55
- Fulton et al. (2018) Fulton, B. J., Petigura, E. A., Blunt, S., & Sinukoff, E. 2018, PASP, 130, 044504
- Gaia Collaboration et al. (2016) Gaia Collaboration, Prusti, T., de Bruijne, J. H. J., et al. 2016, A&A, 595, A1
- Gaia Collaboration et al. (2018) Gaia Collaboration, Brown, A. G. A., Vallenari, A., et al. 2018, A&A, 616, A1
- Henry & McCarthy (1993) Henry, T. J., & McCarthy, Jr., D. W. 1993, AJ, 106, 773
- Hill et al. (2018) Hill, M. L., Kane, S. R., Seperuelo Duarte, E., et al. 2018, ApJ, 860, 67
- Hirsch et al. (2017) Hirsch, L. A., Ciardi, D. R., Howard, A. W., et al. 2017, AJ, 153, 117
- Horch et al. (2011) Horch, E. P., Gomez, S. C., Sherry, W. H., et al. 2011, AJ, 141, 45
- Horch et al. (2012) Horch, E. P., Howell, S. B., Everett, M. E., & Ciardi, D. R. 2012, AJ, 144, 165
- Horch et al. (2014) —. 2014, ApJ, 795, 60
- Horch et al. (2004) Horch, E. P., Meyer, R. D., & van Altena, W. F. 2004, AJ, 127, 1727
- Horch et al. (2009) Horch, E. P., Veillette, D. R., Baena Gallé, R., et al. 2009, AJ, 137, 5057
- Howell et al. (2016) Howell, S. B., Everett, M. E., Horch, E. P., et al. 2016, ApJ, 829, L2
- Howell et al. (2011) Howell, S. B., Everett, M. E., Sherry, W., Horch, E., & Ciardi, D. R. 2011, AJ, 142, 19
- Jenkins et al. (2010) Jenkins, J. S., Jones, H. R. A., Biller, B., et al. 2010, A&A, 515, A17
- Jones et al. (2010) Jones, H. R. A., Butler, R. P., Tinney, C. G., et al. 2010, MNRAS, 403, 1703
- Kane (2011) Kane, S. R. 2011, Icarus, 214, 327
- Kane (2013) —. 2013, ApJ, 766, 10
- Kane et al. (2019) Kane, S. R., Dalba, P. A., Horner, J., et al. 2019, arXiv e-prints, arXiv:1903.04529
- Kane et al. (2018) Kane, S. R., Meshkat, T., & Turnbull, M. C. 2018, AJ, 156, 267
- Kane & von Braun (2008) Kane, S. R., & von Braun, K. 2008, ApJ, 689, 492
- Kane et al. (2014) Kane, S. R., Howell, S. B., Horch, E. P., et al. 2014, ApJ, 785, 93
- Kipping (2013) Kipping, D. M. 2013, MNRAS, 434, L51
- Kipping et al. (2012) Kipping, D. M., Bakos, G. Á., Buchhave, L., Nesvorný, D., & Schmitt, A. 2012, ApJ, 750, 115
- Kopparapu et al. (2018) Kopparapu, R. K., Hébrard, E., Belikov, R., et al. 2018, ApJ, 856, 122
- Lohmann et al. (1983) Lohmann, A. W., Weigelt, G., & Wirnitzer, B. 1983, Appl. Opt., 22, 4028
- Marmier et al. (2013) Marmier, M., Ségransan, D., Udry, S., et al. 2013, A&A, 551, A90
- Matson et al. (2018) Matson, R. A., Howell, S. B., Horch, E. P., & Everett, M. E. 2018, AJ, 156, 31
- Meng et al. (1990) Meng, J., Aitken, G. J. M., Hege, E. K., & Morgan, J. S. 1990, Journal of the Optical Society of America A, 7, 1243
- Meshkat et al. (2017) Meshkat, T., Mawet, D., Bryan, M. L., et al. 2017, AJ, 154, 245
- Mróz et al. (2017) Mróz, P., Udalski, A., Skowron, J., et al. 2017, Nature, 548, 183
- Penny et al. (2019) Penny, M. T., Gaudi, B. S., Kerins, E., et al. 2019, ApJS, 241, 3
- Pickles (1998) Pickles, A. J. 1998, PASP, 110, 863
- Quintana et al. (2014) Quintana, E. V., Barclay, T., Raymond, S. N., et al. 2014, Science, 344, 277
- Stevens & Gaudi (2013) Stevens, D. J., & Gaudi, B. S. 2013, PASP, 125, 933
- Stone et al. (2018) Stone, J. M., Skemer, A. J., Hinz, P. M., et al. 2018, AJ, 156, 286
- Tinney et al. (2001) Tinney, C. G., Butler, R. P., Marcy, G. W., et al. 2001, ApJ, 551, 507
- Torres et al. (2010) Torres, G., Andersen, J., & Giménez, A. 2010, A&A Rev., 18, 67
- Valenti et al. (1995) Valenti, J. A., Butler, R. P., & Marcy, G. W. 1995, PASP, 107, 966
- Valenti & Fischer (2005) Valenti, J. A., & Fischer, D. A. 2005, ApJS, 159, 141
- Wittenmyer et al. (2011) Wittenmyer, R. A., Tinney, C. G., O’Toole, S. J., et al. 2011, ApJ, 727, 102
- Wittenmyer et al. (2014) Wittenmyer, R. A., Horner, J., Tinney, C. G., et al. 2014, ApJ, 783, 103
- Wittenmyer et al. (2016) Wittenmyer, R. A., Butler, R. P., Tinney, C. G., et al. 2016, ApJ, 819, 28
- Wittrock et al. (2016) Wittrock, J. M., Kane, S. R., Horch, E. P., et al. 2016, AJ, 152, 149
- Wittrock et al. (2017) —. 2017, AJ, 154, 184
- Wright & Howard (2009) Wright, J. T., & Howard, A. W. 2009, ApJS, 182, 205
- Wright et al. (2008) Wright, J. T., Marcy, G. W., Butler, R. P., et al. 2008, ApJ, 683, L63