Morphology and star formation in IllustrisTNG:
the build-up of spheroids and discs
Abstract
Using the IllustrisTNG simulations, we investigate the connection between galaxy morphology and star formation in central galaxies with stellar masses in the range . We quantify galaxy morphology by a kinematical decomposition of the stellar component into a spheroidal and a disc component (spheroid-to-total ratio, S/T) and by the concentration of the stellar mass density profile (). S/T is correlated with stellar mass and star-formation activity, while correlates only with stellar mass. Overall, we find good agreement with observational estimates for both S/T and . Low- and high-mass galaxies are dominated by random stellar motion, while only intermediate-mass galaxies () are dominated by ordered rotation. Whereas higher mass galaxies are typical spheroids with high concentrations, lower-mass galaxies have low concentration, pointing to different formation channels. Although we find a correlation between S/T and star-formation activity, in the TNG model galaxies do not necessarily change their morphology when they transition through the green valley or when they cease their star formation, this depending on galaxy stellar mass and morphological estimator. Instead, the morphology (S/T and ) is generally set during the star-forming phase of galaxies. The apparent correlation between S/T and star formation arises because earlier forming galaxies had, on average, a higher S/T at a given stellar mass. Furthermore, we show that mergers drive in-situ bulge formation in intermediate-mass galaxies and are responsible for the recent spheroidal mass assembly in the massive galaxies with . In particular, these massive galaxies assemble about half of the spheroidal mass while star-forming and the other half through mergers while quiescent.
keywords:
galaxies: evolution – galaxies: formation – galaxies: fundamental parameters – galaxies: high-redshift – galaxies: structure1 Introduction
Today’s galaxy population exhibits a large structural diversity that depends on stellar mass (), star-formation activity, and environment (Strateva et al., 2001; Baldry et al., 2006; Schawinski et al., 2014; Cappellari, 2016). Although tremendous progress has been made by measuring galaxy morphology out to redshift of , it remains elusive how the spheroidal and disc components form and evolve within galaxies. Specifically, the relative contributions of mergers, secular evolution, violent disc instabilities, accretion of gas with low angular momentum, and other mechanisms to the observed structural diversity are unclear.
The Hubble Space Telescope enables us to study the rest-frame optical morphologies of high- galaxies and has revealed that star-forming galaxies at often appear more regular at longer than at shorter wavelengths (e.g., Toft et al., 2007; Elmegreen et al., 2009; Förster Schreiber et al., 2011; Wuyts et al., 2012). Their kinematics are mostly constrained by warm ionized gas as traced by the H emission line, while the stellar kinematics remain elusive. These H-based estimates point to a high fraction () of discs, characterized by high intrinsic local velocity dispersions of (e.g., Förster Schreiber et al., 2006; Genzel et al., 2008; Law et al., 2009; Wisnioski et al., 2015, 2018; Stott et al., 2016; Förster Schreiber et al., 2018; Übler et al., 2018). Combined with the relatively small scatter in the star-formation rates (SFRs) at fixed stellar mass (the star-forming main sequence; Noeske et al. 2007; Elbaz et al. 2007; Whitaker et al. 2012), the regular morphology and disc-like kinematics suggest that galaxies grow in a quasi-steady state of gas inflow, outflow, and consumption, while mergers play a subdominant role (Bouché et al., 2010; Hopkins et al., 2010; Genzel et al., 2010; Lilly et al., 2013; Forbes et al., 2014; Nelson et al., 2016b; Tacchella et al., 2016a).
Nevertheless, there is plenty of evidence that normal, star-forming galaxies on the main sequence have built and are building their bulges: the bulge-to-total ratio smoothly increases with stellar mass in both star-forming and quiescent galaxies (Bruce et al., 2014; Lang et al., 2014; Bluck et al., 2014; Mendel et al., 2015; Dimauro et al., 2019), some star-forming galaxies show signs of a nuclear starburst (Barro et al., 2013, 2014; Nelson et al., 2014; Tadaki et al., 2017), and massive star-forming galaxies have a central stellar mass density comparable to local quiescent systems (van Dokkum et al., 2014; Tacchella et al., 2015a; Barro et al., 2017). Furthermore, there is growing evidence that quiescent galaxies at are disc-like and rotating (e.g., Chang et al., 2013; van de Sande et al., 2013; Newman et al., 2015; Toft et al., 2017). Together with the mature bulges present in massive star-forming galaxies, this indicates that probably no significant bulge growth and change in the kinematics needs to take place when galaxies halt their star formation, i.e. that “discs” do not need to be transformed into spheroids (Tacchella et al., 2015a, 2018). Contrarily, observational studies using abundance matching to connect galaxy populations through cosmic time find that the growth of galaxy bulges in massive galaxies corresponds to a rapid decline in the galaxy gas fractions and SFRs (e.g., van Dokkum et al., 2010; Patel et al., 2013; Papovich et al., 2015).
In the local Universe, observational constraints are much more detailed, including the shape, dynamics, and stellar population of complete samples of galaxies (see review by Cappellari, 2016). The quiescent galaxies can be classified into two main classes using stellar kinematics: slow and fast rotators (e.g., Davis & Peebles, 1983; Kormendy & Bender, 1996; Emsellem et al., 2007; Veale et al., 2017; Smethurst et al., 2018). The slow rotators are rare and dominate only at (Illingworth, 1977; Binney, 1978). These galaxies assemble near the centre of massive haloes (e.g., clusters and massive groups) and bear clear signatures of a gas-poor formation processes (gas-poor mergers; Naab & Burkert, 2003; Cox et al., 2006; Bezanson et al., 2009; Penoyre et al., 2017; Faisst et al., 2017; Schulze et al., 2018; Zahid et al., 2019). The more typical population of quiescent galaxies, at a mass scale of , consists of fast rotators with disc-like isophotes (Bender et al., 1988), steep nuclear light profiles (Faber et al., 1997), and steep metallicity gradients (Carollo et al., 1993): all features that indicate a gas-rich formation process, as seen in the star-forming population at .
Traditionally, stellar spheroids are thought to arise from dissipationless accumulation of previously formed stars in mergers (e.g., Cole et al., 2000), while discs are thought to arise from star formation in the dissipational collapse of high angular momentum gas (e.g., Fall & Efstathiou, 1980). In this picture, the contributions from mass formed in spheroids and in discs could tell us about the balance between the different modes of galaxy formation. However, high- observations and numerical simulations show that the spheroidal component in the centres of galaxies may initially form at high redshifts. This high- bulge formation is driven by a variety of processes that conspire to rapidly fuel gas into the central region (summarily called “gas compaction”; Dekel & Burkert, 2014; Zolotov et al., 2015; Tacchella et al., 2016b). These processes include gas inflow enabled by disc instabilities, counter-rotating streams, clump migration, and mergers (e.g. Hernquist, 1989; Noguchi, 1999; Dekel et al., 2009; Bournaud et al., 2011; Sales et al., 2012; Wellons et al., 2015, 2016). Even when galaxies cease their star formation, their spheroidal component can still be augmented by gas-poor mergers and perturbations such as tidal interactions from neighbouring galaxies (Naab et al., 2009; Bekki & Couch, 2011; Oser et al., 2012). Finally, the time and type of merger also impacts the galaxies’ structure (e.g., Barnes, 1992; Hernquist, 1992, 1993; Naab & Burkert, 2003; Cox et al., 2006; Rodriguez-Gomez et al., 2017). Specifically, mergers can spin galaxies up or down (Naab et al., 2014; Lagos et al., 2017; Penoyre et al., 2017), and can lead to the formation of a diffuse halo (Brook et al., 2011; Pillepich et al., 2015).
Given this rich variety of pathways by which spheroids form, the evolution of galaxy structure provides invaluable constraints on key physical processes (that are uncertain and thus often captured in “sub-grid models”, e.g., for black hole feedback, stellar feedback, and the ISM). For example, past numerical simulations have often struggled to prevent excessive spheroid formation (e.g., Navarro & White, 1994; Navarro & Steinmetz, 2000; van den Bosch, 2001; D’Onghia et al., 2006; Scannapieco et al., 2012). Stellar feedback is required to remove low angular momentum gas, also during merger-induced starbursts (e.g., Governato et al., 2009, 2010; Brook et al., 2011; Brook et al., 2012; Christensen et al., 2014; Zjupa & Springel, 2017). Similarly, black hole feedback might be necessary to further suppress spheroid formation and to prevent disc re-growth at later times (e.g., Genel et al., 2015; Dubois et al., 2016; Sparre & Springel, 2017).
To understand the physics driving the evolution of morphology, a number of studies have used cosmological hydrodynamical simulations (e.g., Dubois et al., 2016; Rodriguez-Gomez et al., 2017; Correa et al., 2017; Martin et al., 2018; Wright et al., 2019; Trayford et al., 2019; Thob et al., 2019). For example, using the EAGLE simulations (Schaye et al., 2015; Crain et al., 2015), Correa et al. (2019) note that the time when galaxies move onto the red sequence depends on their morphology, with only a weak connection between transformations in colour and morphology. Similarly, Clauwens et al. (2018) put forward that the morphology of EAGLE galaxies is primarily set by their stellar mass. They distinguish three phases of galaxy formation, where the low-mass phase is dominated by disorganized growth, the intermediate-mass phase corresponds to disc growth, and the high-mass phase transforms discs into spheroids. This final transformation is driven more by the build-up of spheroids than by the destruction of discs.
In this paper, we investigate the formation of spheroids and discs in the IllustrisTNG simulations (Pillepich et al., 2018b; Nelson et al., 2018; Springel et al., 2018; Naiman et al., 2018; Marinacci et al., 2018). Previously, Pillepich et al. (2019) investigated the structural and kinematical evolution of star-forming galaxies across cosmic time () in the TNG50 simulation. They find that the vast majority of star-forming galaxies are rotationally supported gaseous discs for most cosmic epochs (, ), while the underlying stellar component is much less rotationally supported. We build on their analysis, but focus on how and when the morphology of galaxies is determined, and how this process relates to star-formation activity. We include quiescent galaxies to and thus focus on the larger TNG100 simulation. Specifically, we address the following questions. When and how do spheroidal components form? When are galaxies able to efficiently form a disc? Is there any morphological transformation when galaxies cease their star formation?
The paper is structured as follows. We give an overview of the IllustrisTNG simulations, the galaxy sample, and our morphological indicators in Section 2. In Section 3, we discuss how morphology is correlated with stellar mass and star formation and show how and when spheroids and discs form in IllustrisTNG. Section 4 highlights a few consequences for the galaxy population, in particular concerning the ex-situ stellar mass distribution in the galaxy population and within galaxies. Section 5 discusses the emerging picture and highlights the caveats of this analysis. Finally, we summarize and conclude in Section 6. Additionally, we present an extended appendix in which we discuss the numerical resolution of the simulations (Appendix A), compare different morphological tracers (Appendix B), consider the morphology of galaxies on the star-forming main sequence (Appendix C), and show results for the original Illustris simulation (Appendix D).
2 Simulation Data
| Run | TNG100(-1) | TNG100-2 | TNG100-3 | |
|---|---|---|---|---|
| Volume | [ Mpc3 ] | |||
| [ Mpc/ ] | 75 | 75 | 75 | |
| - | ||||
| - | ||||
| [ M⊙ ] | ||||
| [ M⊙ ] | ||||
| [ pc ] | 185 | 370 | 738 | |
| [ kpc ] | 0.74 | 1.48 | 2.95 |
2.1 Description of the simulations
The IllustrisTNG (The Next Generation; Nelson et al. 2018; Marinacci et al. 2018; Naiman et al. 2018; Pillepich et al. 2018b; Springel et al. 2018)111 http://www.tng-project.org simulations build upon the successes of the Illustris galaxy formation model (Vogelsberger et al., 2014a, b; Genel et al., 2014; Sijacki et al., 2015; Nelson et al., 2015), and include prescriptions for star formation, stellar evolution, chemical enrichment, primordial and metal-line cooling, stellar feedback, galactic outflows, and black-hole formation, growth, and multimode feedback (see Weinberger et al., 2017; Pillepich et al., 2018a, for a complete description).
The TNG project is made up of three simulation volumes: TNG50, TNG100, and TNG300. Here, we focus on TNG100 as a compromise between volume and resolution. The details of TNG100 are given in Table 1. The fiducial TNG100 simulation includes 218203 resolution elements in a Mpc (comoving) box. The baryon mass resolution is , the gravitational softening length of the dark matter and stars is 0.7 kpc at , and the gas component has an adaptive softening with a minimum of 185 comoving parsecs. In order to address resolution effects, we analyse two lower resolution runs, TNG100-2 and TNG100-3 (Table 1), in Appendix A.
The parameters of the TNG model have been chosen to roughly reproduce observations of the SFR density as a function of comic time, the galaxy stellar mass function at , the present-day stellar-to-halo mass relation, galaxy stellar sizes. halo gas fractions, and the black-hole mass to galaxy or halo mass relation. The TNG model fixes two shortcomings of the original Illustris simulation that are critical for our purposes: the stellar sizes of galaxies were larger than observed by a factor of a few for (Pillepich et al., 2018a; Genel et al., 2018), and the colour distribution showed only a weak bimodality between red and blue galaxies (Nelson et al., 2018). These issues were addressed by modifications to galactic winds and to the growth and feedback of supermassive black holes. As a result, galactic winds in IllustrisTNG are generally faster and more effective at preventing star formation at all masses and times. We note, however, that the simulations were not tuned to reproduce the galaxy morphologies we consider in this paper. Thus, they not only represent a test of the TNG physics recipes, but also constitute predictions for and interpretations of observations.
2.2 Galaxy sample
Galaxies and their haloes are identified as gravitationally bound substructures using the Subfind algorithm (Springel et al., 2001) and are then linked over time with the SubLink merger tree algorithm (Rodriguez-Gomez et al., 2015). We investigate only galaxies with a stellar mass () of in order to ensure a resolution of at least stellar particles. Furthermore, we focus on central galaxies in order to minimize the effects of environment (such as stripping), which are beyond the scope of this work (see Joshi et al. in preparation for an analysis of morphological transformations induced by dense environments). Finally, we exclude a few objects with abnormal ratios of stellar to dark matter mass. Specifically we exclude galaxies with less than 5% dark matter mass, thereby removing less than 0.01 % of the galaxies (see also Nelson et al. 2019b). These selections result in -selected samples of 11,579, 10,939, and 8,294 galaxies at , , and , respectively. As we wish to compare galaxy properties to observations, we measure all physical properties within an aperture of 3 times the 3D stellar half-mass radius ().
2.3 Definition of star-forming and quiescent galaxies
We estimate the SFR from the instantaneous gas properties, which we regard as the true SFR of the galaxies. Again, we measure the SFR within . A larger aperture does not change our results since the SFR profiles are usually centrally peaked. The specific star formation rate (sSFR) is the ratio between SFR and . To classify galaxies as star-forming, transitional, and quiescent, we compare their sSFR to the Hubble time, , at the redshift of interest. Specifically, we identify quiescent galaxies as having an sSFR lower than
| (1) |
This criterion implies that the stellar mass of quiescent galaxies effectively does not grow due to star formation, i.e., that the stellar mass grows by less than an -fold (roughly a factor 2) within 6 Hubble times. Furthermore, we define transition galaxies to have , where
| (2) |
Since the star-forming main sequence in IllustrisTNG is roughly linear (Donnari et al., 2019) and the normalization roughly evolves proportional to the Hubble time, these cuts are very similar to cuts relative to the main sequence, as shown in Figure 19.
A commonly used alternative definition of quiescence is based on colour. We use the colour as an additional indicator for star-formation activity, though our main distinction between star-forming and quiescent galaxies is based on sSFR. We compute the colour from all gravitationally bound stellar particles that belong to a galaxy, ignoring the effects of dust. As expected, we find a tight correlation where more quiescent galaxies exhibit redder colours. The key difference between sSFR and colour is that the former is sensitive to shorter timescales. Switching to a colour-based definition of quiescence changes our results quantitatively, but not qualitatively.
2.4 Measurement of morphology
Observationally, the structure of galaxies, meaning their bulge-to-total ratio, size, and concentration, can be quantified in different ways. Most straightforwardly, the light distribution can be described either by non-parametric indicators or by a parametric model fit (e.g., Sérsic profile). Based on these descriptions, size, concentration, and bulge-to-total ratios can be estimated. Similarly, one can correct for the mass-to-light ratio variations and estimate these quantities directly from the stellar mass distribution (e.g., Wuyts et al., 2012; Lang et al., 2014; Cibinel et al., 2015; Tacchella et al., 2015a, 2017; Mosleh et al., 2017). An alternative estimate of the structure of galaxies can be based on kinematics: ordered-to-random motion and the flattening of galaxies are two commonly used proxies for their angular momentum (e.g., Binney, 2005; Cappellari et al., 2007). A more sophisticated approach is to construct orbit-superposition Schwarzschild (1979) models that simultaneously fit the observed surface brightness and stellar kinematics (e.g., Zhu et al., 2018). This makes it possible to determine the fraction of stellar mass in the kinematically cold (disc) and kinematically hot (spheroid) component. At least for massive galaxies at , it has been shown that the photometric bulge-disc decompositions and the kinematical estimates from integral field spectroscopy yield remarkably consistent conclusions (Kormendy & Bender, 2012; Kormendy, 2016).
In numerical simulations, estimating the structure of galaxies from kinematics is simpler than estimating it from the light distribution, since the latter involves forward modelling. Here, we focus on two different morphological indicators that are based on kinematics and the mass distribution, respectively. The first indicator is the spheroid-to-total ratio (S/T). We define the spheroidal component as the mass of all stellar particles with within 3 times . Here, is the total angular momentum of the particle and the component that is aligned with the galaxy’s rotation (as defined by the total angular momentum of all stellar particles bound to the galaxy). This definition slightly underestimates the spheroidal component because a purely isotropic system would contain of orbits with . We correct for this effect by applying a global correction factor of to the spheroidal component. We have also considered definitions such as the fraction of kinetic energy in rotation (Sales et al., 2012), twice the mass of all stellar particles that counter-rotate, and a different definition of the rotation of stellar particles. The different measures of S/T correlate very strongly with each other, indicating that the exact method for calculating S/T is not important for our purposes (Appendix B and Figure 16).
Our second morphological indicator is based on the 3D stellar mass density profile. In particular, we consider the concentration, defined as , where and are the radii enclosing 80% and 20% of the stellar mass, respectively. This parameter is known to strongly correlate with the morphological type of galaxies (Kent, 1985; Bershady et al., 2000; Lotz et al., 2004). As before, we measure and within 3 times . Increasing the aperture leads to an overall increase of values, but the qualitative trends with , SFR, and colour remain unchanged. Similarly, estimating from the 2D instead of 3D stellar mass profile leads to no changes in our results.
Our two indicators correlate weakly for low-mass galaxies, which exhibit a large diversity in S/T but . Towards higher masses, and S/T correlate more tightly (Appendix B and Figure 17). We also present a detailed discussion concerning the effects of numerical resolution in Appendix A and discuss how and S/T are related to light-based measurements in Appendix B.
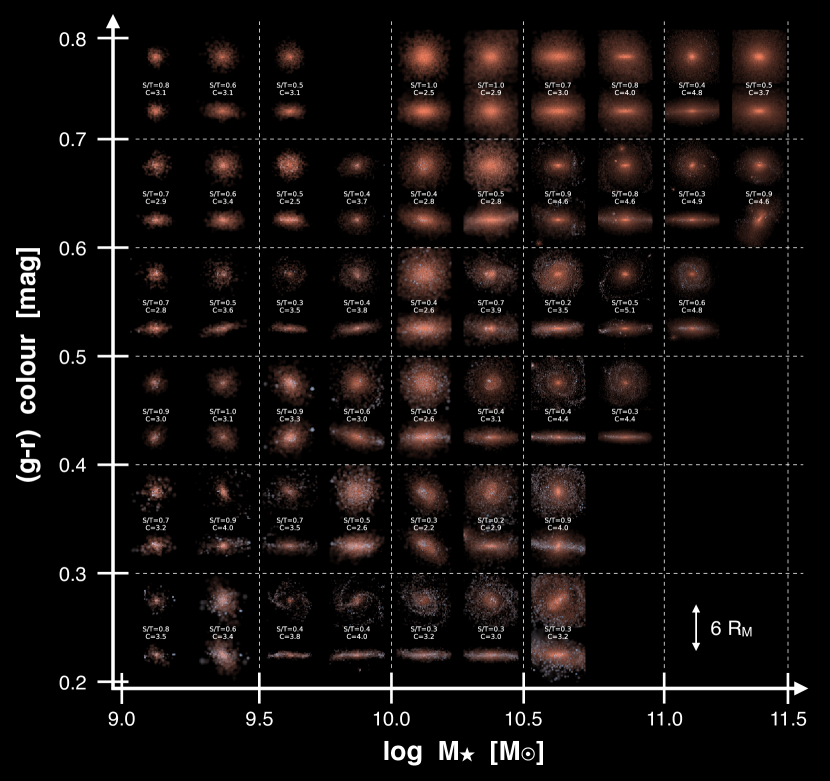
Figure 1 visually demonstrates the large diversity of galaxy morphology in the () colour plane. For each bin in () colour and , we randomly pick a galaxy and plot its face-on (above the label) and edge-on (below the label) projection. Each image shows a colour-composite representing the stellar luminosity in the r-g-B bands (Genel et al., 2018). Massive and redder galaxies are clearly more concentrated and have a more significant spheroidal component. This visual impression is consistent with, and expands upon, the findings of Nelson et al. (2018, their figures 12 and 13). We return to the colourmorphology relation in Section 3.
3 Spheroids and discs: formation and evolution
In this section, we consider the prevalence of spheroids and discs in the IllustrisTNG galaxy population. We first investigate how morphology depends on stellar mass and star formation, finding that TNG galaxies roughly follow the observed correlations. We then focus on the build-up of the spheroidal and disc components in galaxies over time, highlighting that both stellar mass and cosmic time play key roles.
3.1 Dependence of morphology on stellar mass
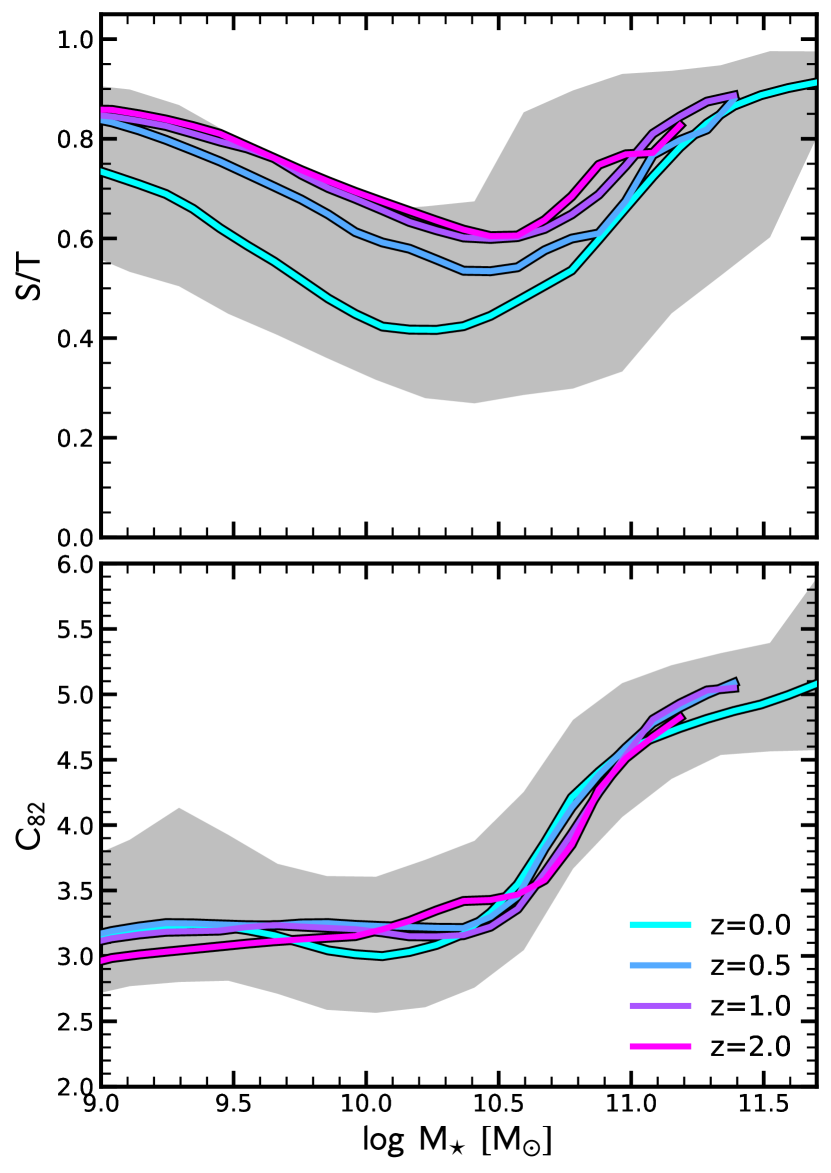
Figure 2 shows S/T and as a function of and redshift. The trends of S/T and are similar at . Typical disc galaxies with low S/T () and low () live in the mass range at . More massive galaxies are typical spheroids with high S/T values of and concentration measurements of , which corresponds to a Sérsic index of . Low-mass galaxies () show a significant difference between S/T and : the kinematics of these galaxies is dominated by random motion, though their stellar mass distribution is well described by a low concentration, , corresponding to a Sérsic (1968) index of . We discuss these low-mass galaxies in detail in Section 5.2.
Figure 2 also demonstrates that there is little redshift evolution in the relation. At all redshifts, high-mass galaxies have high concentration and low-mass galaxies have low concentration. The mass range where the concentration transitions is fixed at at all times. Interestingly, this mass scale is comparable to the mass at which central galaxies in IllustrisTNG typically cease their star formation. Conversely, the S/T relation evolves significantly with redshift: low- and intermediate-mass galaxies have a decreasing S/T with cosmic time, in particular between and . Moreover, the -location of the “minimum” in S/T evolves to lower towards . This trend indicates that, at a given stellar mass, galaxies build up their kinematically cold components over time. This is consistent with the idea of disc assembly as extensively explored in TNG50 in Pillepich et al. (2019) for both the stellar and gaseous structures of star-forming galaxies. This picture is qualitatively consistent with observations (e.g., Zhang et al., 2019; van der Wel et al., 2014), where the overall oblateness (or “disciness”) of galaxies increases with cosmic time.
Previous work by Clauwens et al. (2018) finds negligible redshift evolution of S/T relation in the EAGLE simulations. They define the mass of the spheroidal component as twice the mass of counter-rotating stars, which is the same as our S/Tneg mentioned above and in Appendix B. Using S/Tneg instead of our fiducial S/T measurement does not change our finding significantly: we still find a strong redshift evolution at , while above this mass scale there is less evolution. This difference in the definition of S/T can therefore explain some of the difference between our work and the one by Clauwens et al. (2018), but not all of it. It would be interesting to understand this in more detail in the future, analysing both simulations together in the same way.
3.2 Comparison with observations
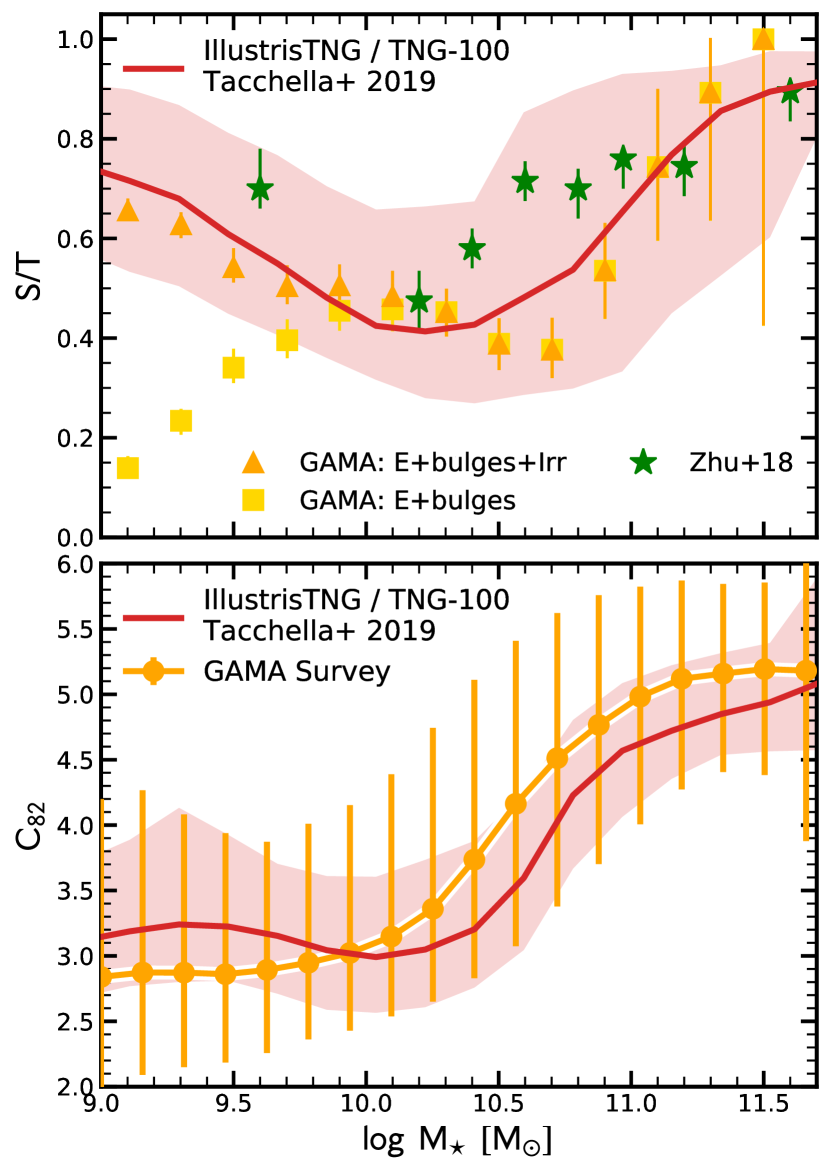
Observationally, the bulge-to-total ratio increases with galaxy mass in both star-forming and quiescent galaxies. Only the most massive (and quiescent) galaxies are dominated by the spheroidal component (e.g., Cappellari, 2016). At lower masses (), it is not clear how well photometric bulge-disc decompositions agree with kinematical approaches. Figure 3 demonstrates that S/T and in IllustrisTNG roughly agree with these trends at .
We begin by considering our kinematic spheroid-disc decompositions, S/T, in the top panel of Figure 3. As shown in Figure 2, S/T has a minimum at intermediate masses and increases towards both low and high masses. We compare this trend to two observational samples. First, Zhu et al. (2018) present stellar orbit distributions for a sample of 300 nearby galaxies from the CALIFA survey (Sánchez et al., 2012). Derived from stellar kinematic maps via orbit-based modelling (Schwarzschild, 1979), these orbits allow them to determine the fraction of stellar mass that is in the kinematically cold, warm, hot and counter-rotating components. We estimate the spheroid component by subtracting from the total mass 1.5 times the cold component in order to take into account the different definitions of the cold/disc component in their and our works. Although their sample represents the largest such analysis to date, the sample is incomplete at low masses towards .
Overall, we find good agreement between the Zhu et al. (2018) observations and IllustrisTNG. They detect a smooth increase in the dynamically hot component with stellar mass above , which matches the stellar-mass trend in IllustrisTNG. At , however, the kinematically hot component also increases towards lower , indicating that these low-mass galaxies are dominated by random motion. Correspondingly, S/T increases to , implying that about 70% of the stellar mass is a kinematically warm/hot component. This trend is in good agreement with IllustrisTNG morphologies. Consistent with this, Xu et al. (2019) find that the TNG100 simulation broadly reproduces the observed fractions of different orbital components and their stellar mass dependencies.
As a second observational dataset, we consider the Galaxy and Mass Assembly (GAMA) survey (Driver et al., 2011), which contains more than 7500 objects at redshift . Moffett et al. (2016) use the Lange et al. (2016) structural decomposition that relies on photometric data alone. They use visual morphology as a prior on whether to model a galaxy with a single or multiple components. For all galaxies where both bulge and disc components are present, they derive bulge and disc colours and -band magnitudes, which they use to estimate component stellar masses. They then present the stellar mass fraction in ellipticals, bulges, and discs from S0–Sa, pure discs, and irregulars. The majority of low-mass objects are single-component galaxies, pure discs as well as irregular galaxies. Based on these photometric observations, we consider two different approaches to determine S/T. First, we assume that elliptical galaxies and bulges are accounting for all of the spheroidal mass. Secondly, in addition to ellipticals and bulges, we also consider irregular galaxies as spheroids. Since irregular galaxies contribute only to the low-mass regime, these two approaches differ significantly at low masses: the latter leads to an increasing S/T towards low masses, while the former leads to a strong decrease.
The top panel of Figure 3 shows that the second method (ellipticals + bulges + irregulars) leads to much better agreement with IllustrisTNG. The overall mass dependence and slope of the relations are similar. At higher masses (), we find that TNG is in good agreement with the GAMA data, with more massive galaxies having a higher S/T (also consistent with findings by, e.g., Thanjavur et al. 2016). The large error-bars at the high-mass end in the observations can be understood by the small volume probed by GAMA, which implies poorer sampling of relatively rare high-mass galaxies (Bernardi et al., 2013). The dip at might have to do with mass-to-light ratio effects, namely with neglecting dust attenuation or outshining of the bulge by a star-forming disc component, which can cause an underestimation of both bulge values and bulge-to-disc ratios (Gadotti et al., 2010; Pastrav et al., 2013; Tacchella et al., 2015b; Carollo et al., 2016).
The bottom panel of Figure 3 compares the relation in IllustrisTNG with observations. The data is again taken from the GAMA survey. Specifically, we use their published Sérsic fits in the band (Kelvin et al., 2012) to derive the relation. We select galaxies at with good Sérsic fits (quality flat ). The error bars indicator the 16th and 84th percentiles. We find good agreement between the TNG simulations and observations.
In summary, we have demonstrated that IllustrisTNG galaxies generally reproduce the observed relation between morphology and stellar mass. At low masses, the estimates for S/T are reasonable, but resolution effects and modelling choices might be an issue. We discuss on this in Section 5.2 and Appendix A. Furthermore, a detailed observational comparison of galaxy morphology in IllustrisTNG at was carried out by Rodriguez-Gomez et al. (2019) and Huertas-Company et al. (2019); we discuss their results in Section 5.3.
3.3 Morphology, star formation, and stellar mass
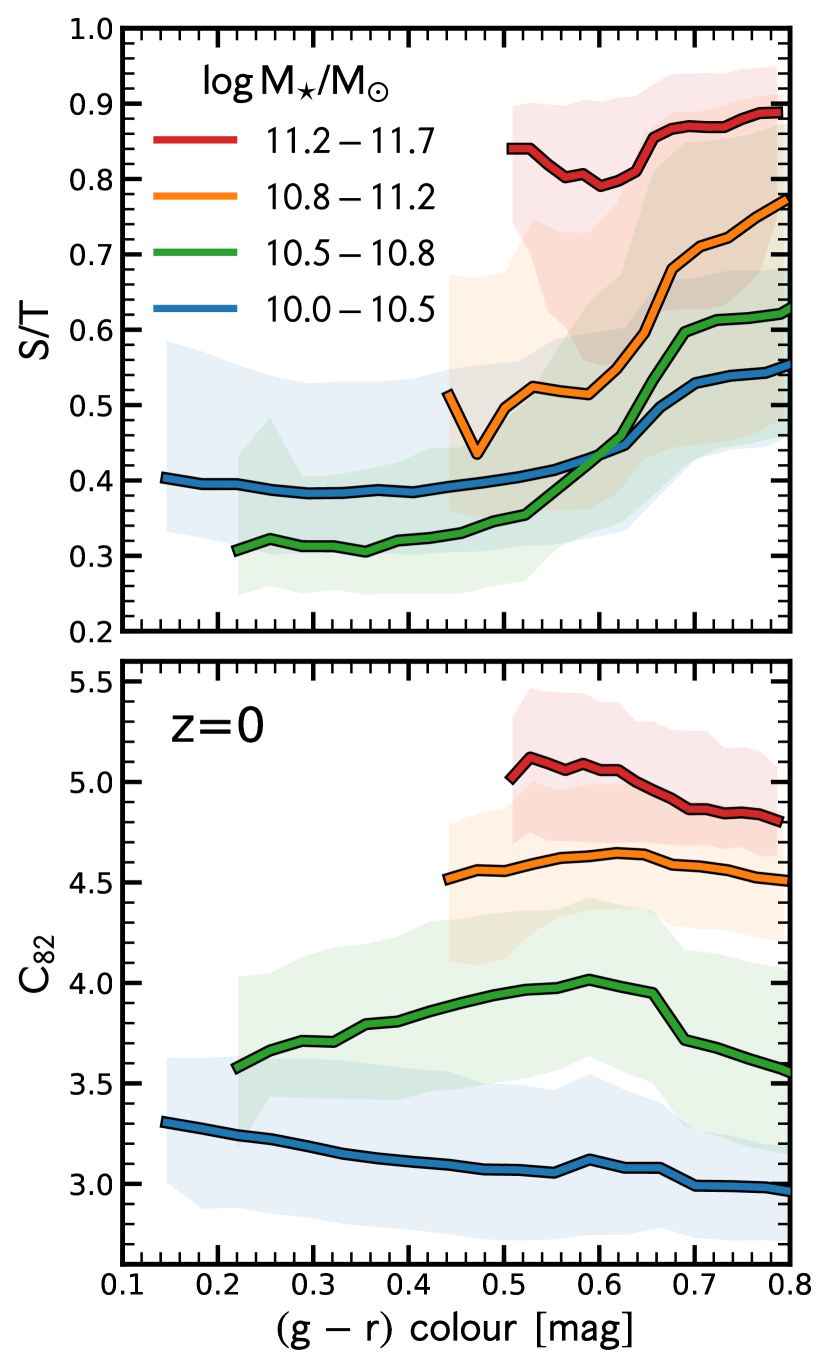
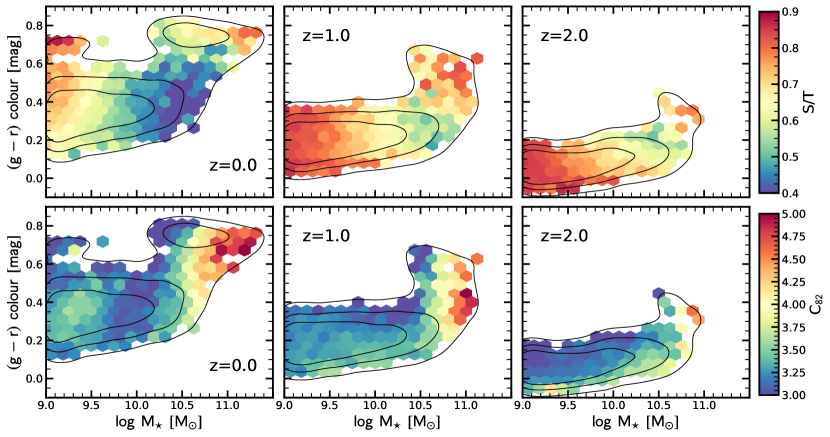
Figure 4 shows the galaxy population in the plane of at redshifts , 1, and 2 (see Appendix C for the same figure in SFR space). The black contours indicate the number density of IllustrisTNG galaxies, which clearly form a blue cloud and a red sequence that gets less populated towards higher redshifts. The overall colour-mass distribution is in good agreement with SDSS data (Nelson et al., 2018). Galaxies in IllustrisTNG typically cease their star formation because of black-hole feedback, which becomes effective above a black-hole mass of , i.e., when the black hole preferentially resides in the low-accretion mode and feedback is momentum-driven (“kinetic mode”; Nelson et al. 2018; Weinberger et al. 2018). Although there is a tight relation between SFR and (see Terrazas et al., in preparation), we find that galaxies transition to quiescence over a wide range in stellar mass, which can be explained, at least in part, by the scatter in the relation.
The colour coding in Figure 4 corresponds to S/T for the upper panels and to for the lower panels. As discussed in the previous two sections and shown in Figure 2, both indicators exhibit a strong trend with stellar mass. However, in Figure 4, it appears that, at fixed , S/T correlates significantly with colour, and more so the lower the redshift and above , while does not. Namely, above , redder galaxies have larger spheroidal mass fractions, by up to 0.3 in S/T values. To clarify this colour-morphology relation, Figure 5 shows the median relation between colour and S/T or for four different mass bins. We confirm that S/T increases significantly with redder colour, meaning that redder galaxies have a larger spheroidal component. This is especially true for galaxies in the transition region with . Conversely, remains roughly constant with colour, in particular at (see Rodriguez-Gomez et al., 2019, for a similar result). At earlier cosmic times ( and ), we find a secondary, weaker trend within the blue cloud: galaxies with bluer colours (higher sSFRs, see Figure 19) have slightly higher concentrations than galaxies with redder colours.
From Figure 5, it is tempting to conclude that quenching galaxies increase their S/T while not changing . However, this conclusion cannot be derived from the figure because it shows the galaxy population at a specific moment in time. Specifically, today’s red galaxies ceased their star formation over a wide range of cosmic times. Their star-forming progenitors also evolved significantly with time, which could lead to an observed correlation between star-forming and quiescent galaxies at a given epoch (e.g., van Dokkum & Franx, 1996; Saglia et al., 2010; Carollo et al., 2013; Lilly & Carollo, 2016; Fagioli et al., 2016; Tacchella et al., 2017).
In the upcoming sections, we will follow galaxies through cosmic time and explicitly show how, and if, their morphological estimators change as they transition through the green valley and after quenching. Given our findings from Figure 2, we can already speculate that a reason for the apparent correlation between S/T and colour in Figure 5 is that galaxies that have ceased their star formation in the past had a higher S/T value on average.
3.4 The build-up of the different stellar components
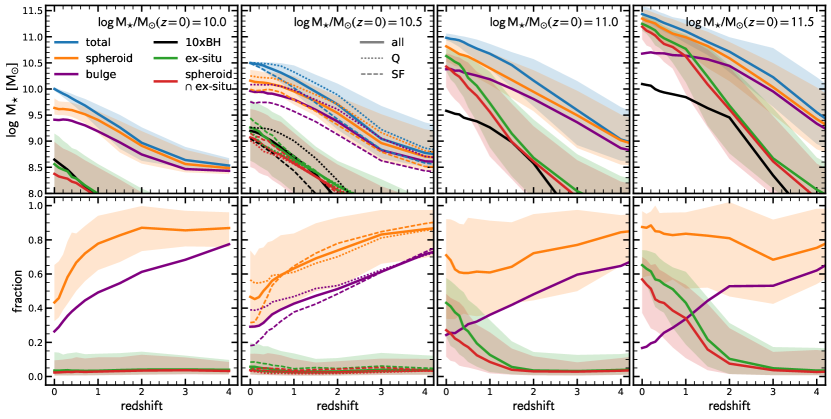
In this section, we investigate how the different components of stellar mass assemble. We select galaxies in four stellar-mass bins at : (with a bin width of ), (), (), and (). Each bin contains roughly galaxies. We now follow the progenitors of each galaxy and track the evolution of their components. Figure 6 shows this evolution in total stellar mass, the spheroidal component, the ex-situ component, the spheroid&ex-situ component (i.e., stars that have formed ex-situ and are part of the spheroidal component), the bulge component (spheroidal component within the inner 3 kpc), and the black hole mass (multiplied by so that it can be shown on the same scale). We separately consider star-forming (dashed) and quiescent (dotted) galaxies for the mass bin, since only this bin has a significant fraction of both star-forming and quiescent galaxies ( in each category). The lower mass bin is dominated by star-forming galaxies, the higher mass bins consist mainly of quiescent galaxies.
Today’s galaxies with are typically dominated by their own star formation, with a negligible ex-situ contribution at all cosmic times (see also Rodriguez-Gomez et al., 2016; Gómez et al., 2017; Qu et al., 2017; Clauwens et al., 2018; Pillepich et al., 2018b). At early times (), the spheroidal component grows hand-in-hand with the total stellar mass while the bulge component grows at a slightly slower pace, resulting in a decreasing bulge fraction. Thus, most of the mass growth of the spheroidal component is associated with growth in the outer regions (). During this early time, the galaxies are dominated by random stellar motions. In recent times (), they evolve towards a disc-dominated morphology: the spheroidal and bulge components grow only weakly (by about 0.2 dex) and their fractional contributions drop to and , respectively. This decrease demonstrates that those galaxies go through a phase of disc formation.
Galaxies with at follow a similar growth pattern: their spheroidal and bulge components grow at a slower pace than the total stellar mass, leading to a decrease in spheroidal and bulge mass fraction. This disc formation phase starts at , earlier than for lower-mass galaxies, where it begins at . The main difference between the quiescent and star-forming galaxies is that quiescent galaxies assemble earlier and have higher black hole and spheroid masses. Interestingly, the mass of the black hole ( at ) tracks the mass of the ex-situ mass fraction quite closely. This points to mergers driving at least part of the black-hole mass growth, either by fuelling the central part of the galaxies with gas or simply via BH-BH mergers. Such an evolution is consistent with the black-hole growth picture of Weinberger et al. (2018, their figure 7). This picture is also consistent with the results of Section 4.1 and Figure 11, where we find that a high concentration of the stellar mass is associated with a high ex-situ fraction.
Galaxies with at assemble rather quickly at . Their spheroidal component grows slightly slower than their total stellar mass, giving rise to a weak decline of S/T from at to at . However, the scatter in the population is large because some galaxies have ceased their star formation earlier than others. In an upcoming paper, we demonstrate that more recently quenched galaxies have a lower S/T value than galaxies that quench at earlier epochs. Here, we understand the weak decline as evidence that galaxies in this mass bin have not been able to efficiently form a disc component (see next section). At late time (), the rise of the spheroidal component (and the negligible growth of the bulge) are driven by ex-situ accretion in the outskirts. The black-hole growth tracks the growth of the ex-situ component until the black hole reaches a mass of . At this mass scale, the galaxy quenches because it enters the more efficient black-hole feedback mode (Section 3.3).
Finally, galaxies in the most massive bin ( at ) show a weakly increasing spheroid fraction with cosmic time. After these galaxies cease their star formation, they grow by ex-situ mass accretion, increasing their ex-situ fraction to more than 60% at . The spheroidal component grows at a similar pace, implying that a large fraction of the ex-situ accreted stars are deposited in the spheroid component.
3.5 When and where do discs form?

We now turn to the efficiency of disc and bulge formation as a function of stellar mass and redshift. Do all galaxies form discs at a certain efficiency, or is there a particular time and mass range where discs form? We define the disc (bulge) formation efficiency as the fraction of added stellar material that enters into ordered rotation (random motion within the inner 3 kpc). Figure 7 presents the disc (left) and bulge (right) formation efficiency, computed by following galaxies back in time and measuring the change of their disc and bulge mass relative to the change of their total mass. Here, the disc is defined as rotationally supported stars with , while the bulge is defined as the spheroidal component within the inner 3 kpc. The black lines in Figure 7 show the median mass growth histories of galaxies in different mass bins.
Figure 7 highlights a key result: the efficiency of disc formation, and thus the build-up of morphology, depends strongly on both and cosmic time. At early times, , the formation efficiency of discs remains low, in particular for galaxies with . With passing cosmic time, the formation efficiency of the disc component increases, in particular for intermediate-mass galaxies with . The lowest mass galaxies with have only very recently entered the region of efficient disc formation, giving rise to their high S/T ratios (Section 3.1). Similarly, massive galaxies with have never been able to efficiently form a disc. At early times, they quickly formed stars but their disc formation efficiency was, at best, intermediate. At late times, their growth is dominated by ex-situ mass accretion that mostly deposits stars in the spheroid component. The ex-situ accretion can also destroy discs, though this mechanism does not dominate. This can be seen from Figure 7, where the median is always positive.
Focusing on the assembly of bulges, i.e. the spheroidal component in the inner 3 kpc, we find to first order that bulges form efficiently when disc growth is inefficient. An exception is the regime of massive galaxies at , where disc and bulge formation are both inefficient. This is because the growth via mergers leads to growth of the spheroid component in the outskirts, and leaves the spheroidal mass within the inner 3 kpc nearly unaffected (second-order effects such as mass-loss and adiabatic expansion can lead to a decrease in the bulge component). The key point to take away is that bulges form efficiently at early cosmic times when galaxies were star forming. We explore this further in the next section.
3.6 Spheroids assemble while galaxies are star forming
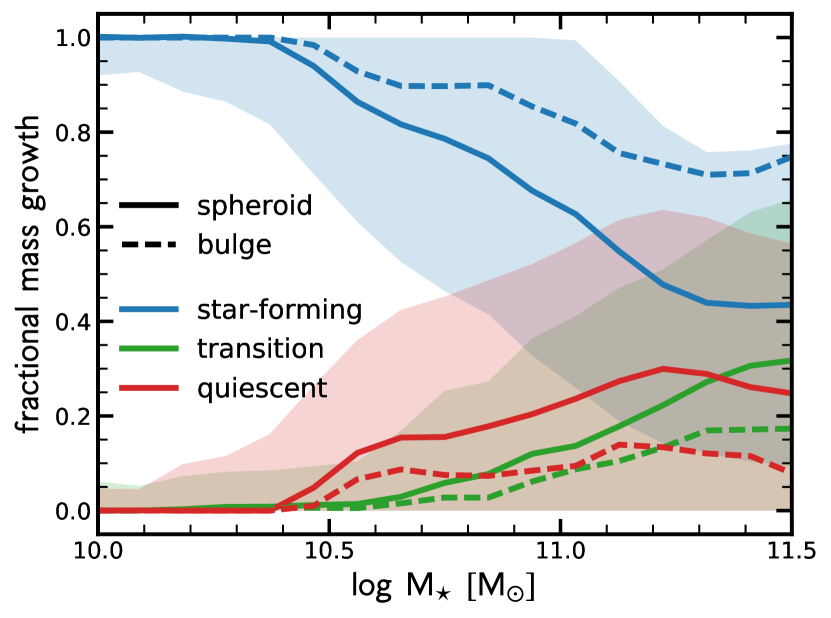
We now turn to the question of when the spheroidal component forms: during the star-forming phase, or after galaxies have ceased their star formation? Figure 8 shows the fraction of spheroid and bulge (spheroidal component in the inner 3 kpc) that was added during the star-forming phase (blue), the transition phase (green), and the quiescent phase (red; see Section 2.3 for the definitions). Here we do not follow backwards in time the stars that are in the spheroidal and bulge components of the galaxies. We rather evaluate the mass fractions in the two components in galaxies at different times in comparison to their mass and assume that stars that are on hot orbits at some point in time do remain in high-dispersion states at subsequent times.
The key result is that, at all masses, a large fraction of the spheroid is added while galaxies are star-forming, albeit with a large scatter highlighting the diversity at a given . At low masses, (), most galaxies are star-forming throughout their lifetimes. Thus, by construction, all of their spheroidal mass growth takes place while star-forming. Towards higher stellar masses, the fractional mass growth while star forming steadily decreases, while the mass growth during the transition and quiescent phases increase at roughly the same pace. However, even at the highest masses (), of the spheroidal mass has been added while the galaxies were star forming, while about 30% and 25% was added in the transition and quiescent phases, respectively.
Focusing on the central ( kpc) bulge component, the fraction of mass assembled during the star-forming phase is even higher and always at least 80%. The bulge growth during the quiescent phase is negligible ( at all masses). This finding highlights that bulges in massive galaxies have already assembled when galaxies stop forming stars, while (dry) mergers play an important role in building the spheroidal component in the outskirts.
Clearly, the fractions shown in Figure 8 depend on the exact definition of the star-forming, transition, and quiescent phases. As outlined in Section 2.3, we adopt a rather conservative cut on star-forming galaxies; a simple colour cut would classify more galaxies as star-forming. Lowering this threshold would increase the star-forming fraction further, and thus strengthen our statement that a large fraction of the spheroid formation takes place while galaxies are star-forming. However, even when switching to a simple colour cut, the trends qualitatively remain the same, highlighting that our main conclusion is robust.
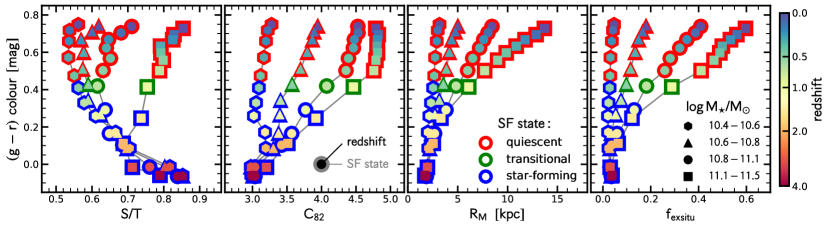
3.7 Evolution with respect to star formation and colour
We now advance the discussion to the relation between morphological changes and colours: how much of the morphological transformation takes place while galaxies are blue and star-forming versus red and quiescent? Figure 9 shows the median evolutionary tracks of the colours of four samples of quiescent galaxies, marked by different symbols. The symbols’ face colours correspond to redshift as indicated on the right. The symbols’ edge colours mark whether the sample of galaxies is classified as star forming (blue), transitioning (green), or quiescent (red), according to their sSFR with respect to the Hubble time (Section 2.3). Although individual galaxies need not follow these median trends, they serve as a rough indication for the typical relation between colour and morphological changes. Specifically, we compare the colour evolution of quiescent galaxies in four stellar mass bins to the evolution of their spheroid-to-total ratio (S/T), concentration (), stellar half-mass size (), and ex-situ stellar mass fraction (). By construction, all median tracks evolve to red colours of by . At early cosmic times (), the colours of all samples are blue, i.e. dominated by young stellar populations and high specific SFRs. The colour of the most massive quiescent galaxies evolves most rapidly, followed by the intermediate-mass objects.
Focusing on the evolution of S/T (left panel of Figure 9), we find that all but the most massive galaxies are rapidly building up their discs during their star-formation phase (moving towards lower S/T). Once star formation has ceased, the median tracks evolve at almost constant S/T for a time. This non-evolution demonstrates that galaxies do not (or at least not coherently) transform their morphology as expressed by S/T during quenching or transitional phase. During the quiescent phase, i.e. when they are already quenched, galaxies’ S/T increases by , typically at and plausibly due to mergers (see previous sections).
The concentration (second panel from the left) increases with time at for all four samples of galaxies while they are star-forming. The increase is slowest for the lowest mass galaxies. For the most massive galaxies, increases significantly just before they halt their star formation, i.e. during the transition phase, while there is little change in during the subsequent quiescent phase. This result demonstrates, once again, that massive galaxies build up their high stellar mass concentration during the star-formation phase.
The third panel in Figure 9 shows the evolution of galaxy size as quantified by the stellar half-mass radius. The size growth of quiescent galaxies depends strongly on mass: while all galaxy samples grow their sizes at all times, that growth is much more pronounced for the most massive galaxies (Genel et al., 2018). The size growth in the transition and quiescent phases resembles the increase in the ex-situ stellar mass fraction (right panel), indicating that the size growth is likely due to the accretion of stellar mass onto the outskirts. However, in particular during the transition phase, star formation in the outskirts could also play an important role in the increase in the sizes of these galaxies, an effect that should be investigated further in future work.
The evolutionary tracks in Figure 9 follow quiescent galaxies back in time. Clearly, we can also investigate different sub-samples at earlier cosmic times and study their subsequent evolution. For example, focusing on quiescent disc galaxies at , we find that most of those galaxies increase their S/T value by 0.2-0.3 by , i.e. they turn into spheroids, while staying quiescent. This is consistent with Figure 9, where we see that S/T increases at late times. We will study this further in a future publication that focuses on those galaxies in particular.
Finally, we would like to stress that Figure 9 shows median tracks. Studying the scatter in the tracks (not shown because of clarity) reveals that there is significant scatter in the S/T-tracks, highlighting the diversity in evolutionary paths. On the other hand, for the concentration, size and ex-situ mass fraction, the scatter in the evolutionary paths are much tighter, implying a more coherent evolution.
4 Observational consequences for galaxies
After discussing how IllustrisTNG galaxy morphologies evolve with cosmic time and stellar mass, we now turn to observational consequences of this model at . We focus on the ex-situ stellar mass fraction and its dependence on morphology, quantify the stellar mass density profiles, and discuss stellar population properties of the disc and spheroidal components.
4.1 Correlation between ex-situ mass fraction and morphology
Many of the results in the previous sections imply that mergers play an important role in shaping galaxies. In this section, we thus investigate the relation between morphology and the in-situ and ex-situ stellar components of simulated galaxies. The ex-situ stellar mass fractions for IllustrisTNG galaxies have already been presented in Pillepich et al. (2018b). For completeness, we show the ex-situ fractions in Figure 10 and compare them to the original Illustris analysis of Rodriguez-Gomez et al. (2016). Here all measurements are within three times the stellar half-mass radius. We then expand on previous analyses by directly connecting the ex-situ fraction to morphology.
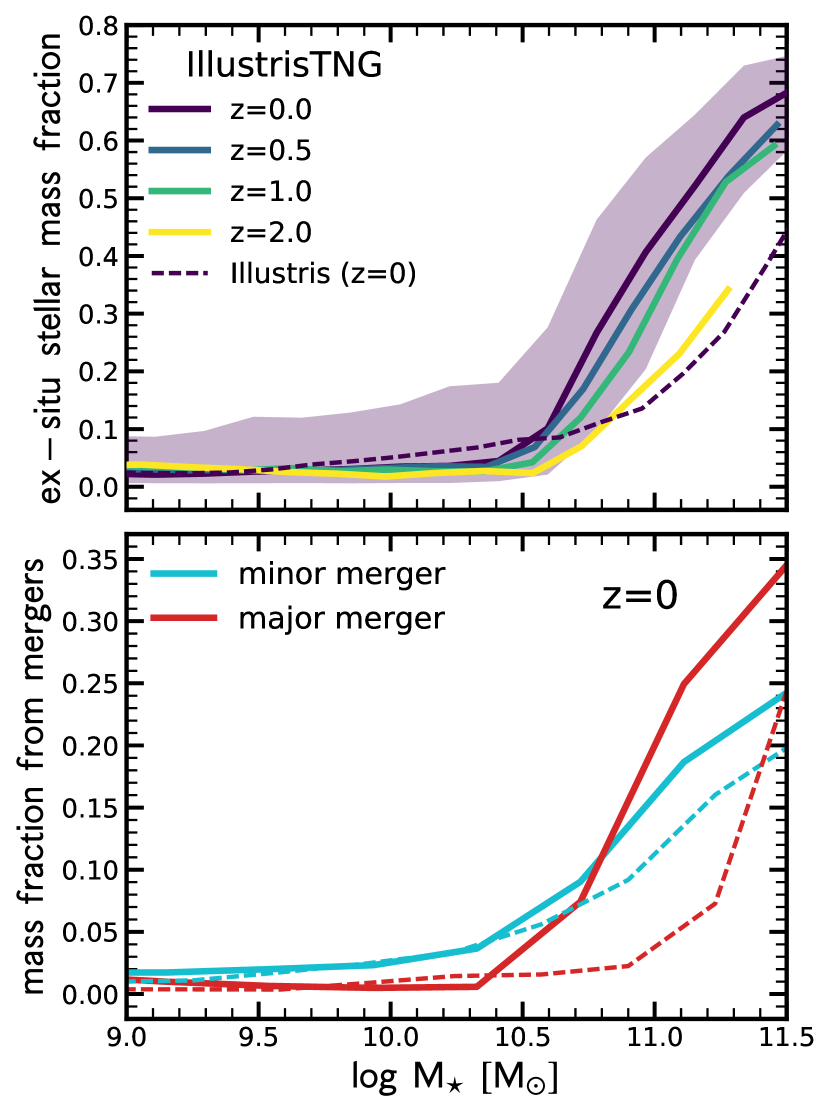
We define and measure the ex-situ stellar mass fraction as in Rodriguez-Gomez et al. (2016) and refer the reader to their paper for details. Briefly, the ex-situ stellar mass fraction is the fraction of the total stellar mass of a galaxy that has been contributed by stars that formed in other galaxies and were subsequently accreted. Hence, the ex-situ fraction is a good tracer of mergers, but not a perfect one: mergers do not only add stellar mass (which would be counted as ex-situ), but they can also bring in gas and enhance the star-formation activity, which would then be counted as in-situ. Therefore, the ex-situ component is a good tracer of gas-poor (dry) mergers (see also Figure 6 in Rodriguez-Gomez et al. 2017). The top panel of Figure 10 shows the median fraction of ex-situ stellar mass as function of stellar mass and redshift. There is a striking mass dependence: up to , the median ex-situ fraction is , while at and above it amounts to more than 50%. This strong increase occurs mainly because galaxies quench efficiently and subsequently grow through ex-situ accretion. In addition, the merger rate increases with mass (Rodriguez-Gomez et al., 2015). Moreover, the majority of stars stems from mergers with a halo mass ratio (Genel et al., 2010), which for galaxies with means mergers with haloes that host very few stars. Figure 10 also shows a weak redshift evolution after while a non negligible one between and 2: at fixed stellar mass, the ex-situ stellar mass fraction increases with cosmic time, for example at where it increases from to from to . This shows that the contribution from mergers and accretion becomes relevant over the last 8 Gyr or so.
The bottom panel of Figure 10 shows the fraction of stellar mass that was accreted from completed minor and major mergers. Major mergers are defined by a mass ratio of . The stellar mass fractions from minor and major mergers do not exactly add up to the ex-situ stellar mass fraction (shown in the top panel), because the latter also includes the stellar mass from on-going mergers, from flybys, and from mass formed outside the galaxies. For the exact definition, see Rodriguez-Gomez et al. (2015) and Rodriguez-Gomez et al. (2016). The key result is that minor mergers dominate up to a stellar mass of , beyond which major mergers start to dominate. As we will show in the next section (Section 4.2), this translates into a different radial distribution of the ex-situ stellar mass fraction within galaxies.
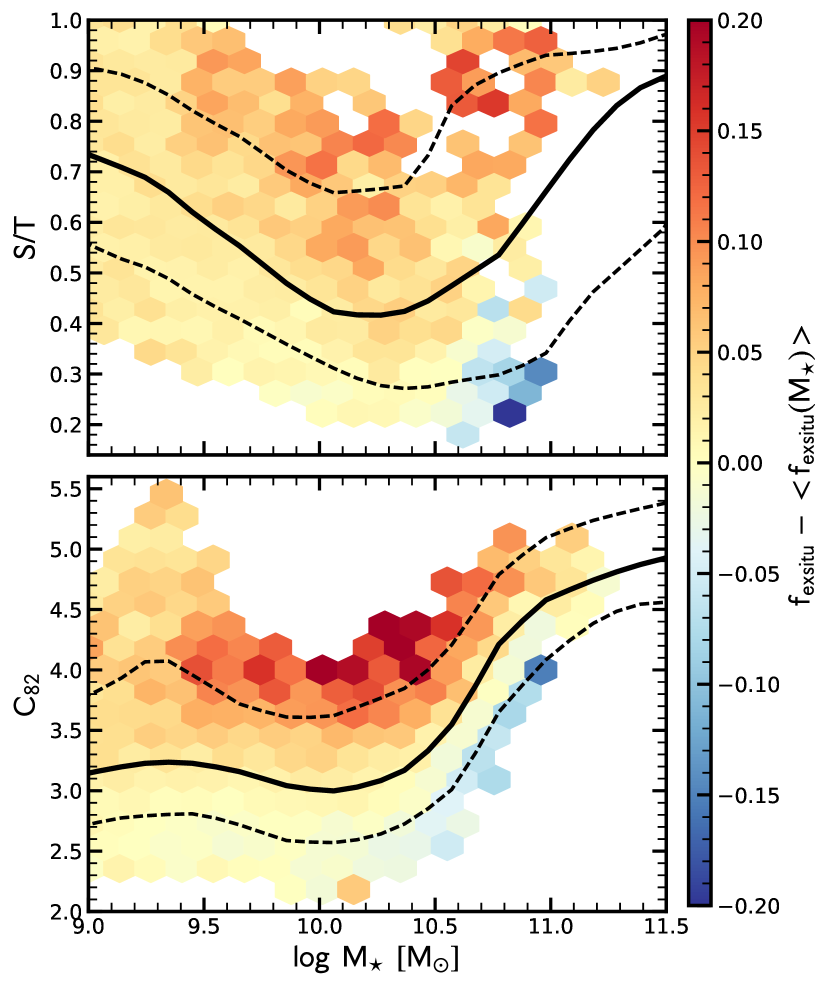
The most striking conclusion from Figure 10 is that the ex-situ fraction steeply increases with stellar mass above about , reminiscent of the increase in S/T and seen in Figure 2. However, this similarity does not prove that a high ex-situ mass fraction implies a high S/T or value; they could be independent of each other but both correlate with . To investigate the connection directly, Figure 11 shows 2D histograms of S/T and as a function of , where each bin is colour-coded by the normalized ex-situ fraction (ex-situ fraction after subtracting the median relation to remove the strong mass dependence). At a given , galaxies with higher S/T and higher also have a higher ex-situ stellar mass fraction. This trend is particularly pronounced in intermediate-mass galaxies around , which are typically star-forming. Physically, this implies that star-forming galaxies that recently experienced a merger have, on average, an increased S/T and . This interpretation is consistent with a picture where mergers fuel gas to the central region to build up a spheroidal component in the core of galaxies (Hernquist, 1989; Barnes & Hernquist, 1991; Mihos & Hernquist, 1994, 1996; Barnes & Hernquist, 1996; Tacchella et al., 2016b). We will investigate this scenario further in an upcoming publication, where we will study the spatially resolved SFR and profiles.
Previously, Rodriguez-Gomez et al. (2017) used the original Illustris simulation to study the relationship between the ex-situ fraction and kinematic morphology at . The latter was quantified using the -parameter (Sales et al., 2012, see also Appendix B), which measures the fraction of kinetic energy invested in ordered rotation. Their main finding was that the correlation between the ex-situ fraction and kinematic morphology is mass-dependent: dry mergers play an important role in shaping the morphology of massive galaxies (), while the role of mergers becomes less clear at lower masses (their Figure 5). This finding is qualitatively consistent with the upper panel from Figure 11, which also compares the ex-situ fraction with kinematic morphology. The only quantitative difference between the results of Rodriguez-Gomez et al. (2017) and this work is that mergers become relevant at a somewhat lower stellar mass ( instead of ) in IllustrisTNG compared to Illustris, as a result of the lower transition mass between in-situ and ex-situ dominated systems in IllustrisTNG (Figure 10). Specifically, in Figure 10, dashed curves denote results from the original Illustris simulation: it predicts a lower ex-situ fraction at fixed galaxy mass towards the high-mass end in comparison to TNG (up to 25-30 percentage points). This difference between TNG and Illustris can be understood based on changes in the feedback and the resulting stellar mass function. However, it is exacerbated by a shift towards larger stellar masses of Illustris galaxies at fixed halo masses. The ex-situ fractions of TNG and Illustris galaxies differ by 10-15 percentage points at most when measured at fixed halo mass.
Similarly, Bignone et al. (2017) and Snyder et al. (2019) studied the relationship between several non-parametric morphological indicators – including the light concentration – and the frequency of galaxy mergers in Illustris, finding a clear correlation between the two. In particular, Snyder et al. (2019) found that the concentration statistic has a high importance as an indicator of very recent mergers (those that happened during the last 250 Myr; see their Figure 11), which could be an indication of highly concentrated starbursts produced by gas-rich mergers. This finding is qualitatively consistent with the lower panel of Figure 11, which shows a particularly strong correlation between the ex-situ fraction and concentration for intermediate-mass galaxies.
4.2 Stellar mass density profiles
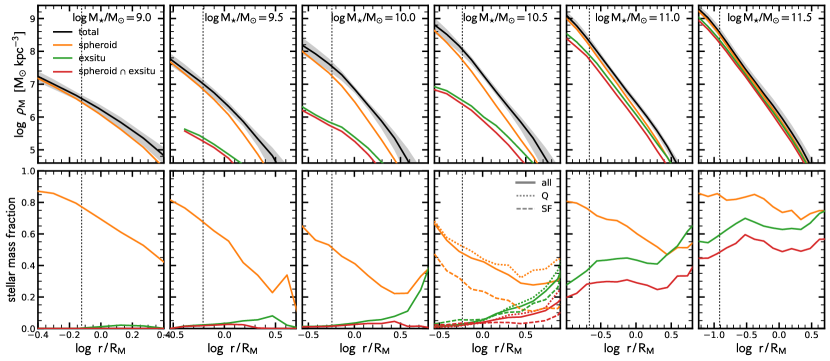
To shed further light on the assembly of the spheroidal and ex-situ stellar mass components on spatially resolved scales, we now investigate the stellar mass distribution within galaxies at . Figure 12 shows the 3D stellar mass density profiles (upper panels) and the radial stellar mass fraction (bottom panels) for galaxies in six different mass bins. We split the total stellar mass profiles into the spheroidal component, the ex-situ component, and the spheroidal&ex-situ component. The radial coordinate of the stellar mass profiles are all normalized by the stellar half-mass radii. The mass bins include both star-forming and quiescent galaxies and increase from to . As in Figure 6, we separate star-forming and quiescent galaxies in the bin with , which contains significant populations of both star-forming and quiescent galaxies.
At low masses (), galaxies have a significant spheroidal component (see also Figure 2), which dominates the mass profile within the stellar half-mass radius and decreases steadily towards the outskirts. The ex-situ mass fraction is negligible at all radii. With increasing stellar mass (), the spheroidal mass fraction steadily decreases within , but still peaks in the central region. In the outskirts of these galaxies, between 3 and , the mass profile of the spheroidal and ex-situ components increases with increasing , while the spheroid&ex-situ component increases to a lesser degree. These trends demonstrate that intermediate-mass galaxies have a stellar envelope (halo component) that has partially been built up by the accretion of stars through minor mergers. This finding is consistent with Figure 10, where we show that the ex-situ fraction within is for galaxies within this mass range, and that most of their mass is contributed by minor mergers. Nevertheless, the central spheroidal component, i.e., the bulge, consists mostly of stars that formed in-situ.
Considering even more massive galaxies, we find that the spheroidal and ex-situ mass fractions increase with stellar mass. The difference between and is surprisingly stark: for galaxies with , the spheroidal mass fraction decreases with radius, while the ex-situ mass fraction increases with radius. Galaxies with , on the other hand, have basically flat spheroidal, ex-situ, and spheroid&ex-situ profiles that contribute significantly at all radii. The natural interpretation of this difference is that the main formation channels of galaxies in the two mass bins differ (see also Figure 4). Minor mergers contribute to the ex-situ fraction in the outskirts of galaxies, but are inefficient at deploying significant amounts of mass in the central region (e.g., Rodriguez-Gomez et al., 2016; Amorisco, 2017). For the most massive galaxies (), however, the ex-situ mass fraction dominates the central region as well, indicating that more violent, major mergers must play a role. This picture is consistent with the stellar mass fraction from minor and major mergers shown in Figure 10, where we show that major mergers start to be significantly more important than minor mergers above .
In Appendix D, we reproduce Figure 12 for the original Illustris simulation. We discover large differences in the shape of the profiles, with less concentrated mass profiles in Illustris. Moreover, the spatial distribution of the spheroidal and ex-situ stellar mass fractions differs as well, highlighting that the details of stellar and black-hole feedback have a large impact on the morphology and assembly of galaxies.
4.3 Stellar population properties of the spheroidal and disc components
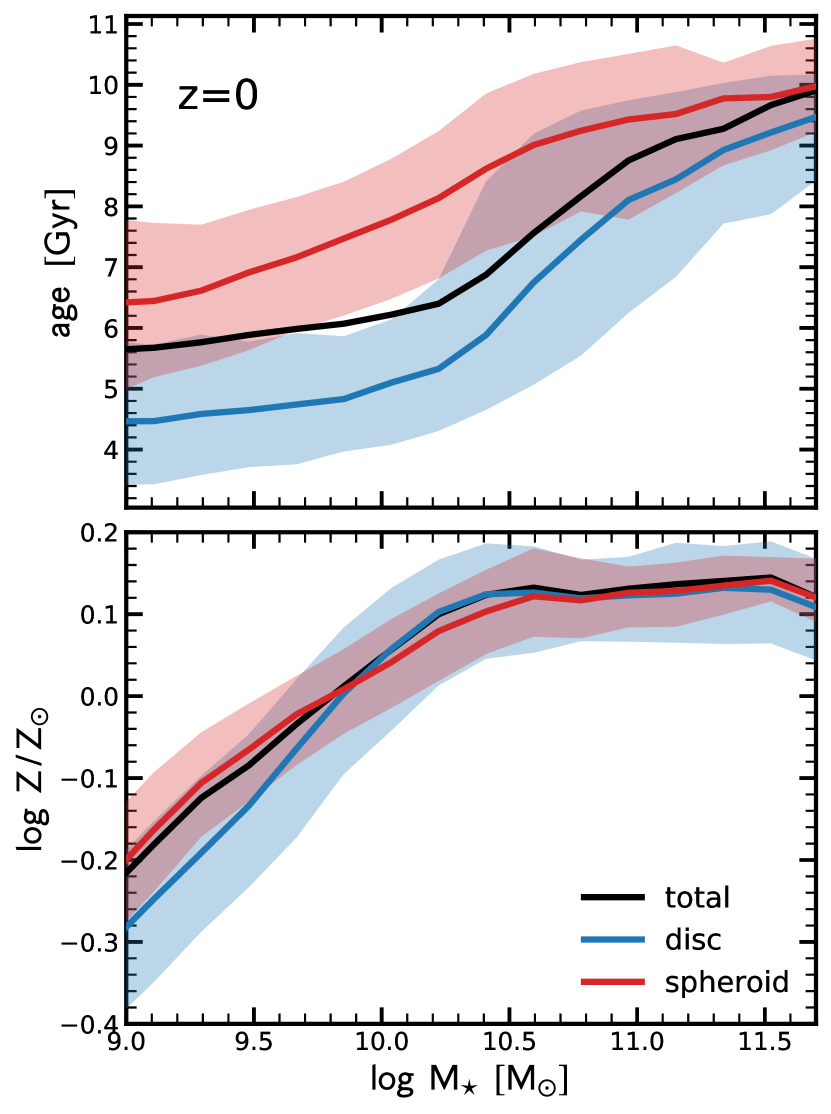
In order to gain further insight into the formation mechanism of the spheroidal and disc components, and to make predictions that can be compared to observations, we investigate the stellar population properties of the kinematic components at . Nelson et al. (2018) presented the mass-weighted stellar age and stellar metallicity of IllustrisTNG galaxies as a function of . In Figure 13, we expand on their analysis by splitting the stellar properties according to the kinematics. In particular, the top and bottom panels show the mass-weighted stellar age and stellar metallicity as a function of , with the black, blue, and red lines indicating the property of stars in the entire galaxy, in the disc component, and in the spheroidal component, respectively.
The mass-weighted stellar age of the entire galaxy increases from 5.5 Gyr for low-mass galaxies to Gyr for high-mass galaxies. Galaxies with have similar ages, consistent with a nearly linear relation between SFR and (i.e., the mass doubling timescale is roughly the same for those galaxies). The average age rapidly increases around the mass-scale where most galaxies quench (). Interestingly, the spheroidal component is older than the disc component at all masses. This difference is especially pronounced in the intermediate-mass regime of . This trend implies that the spheroidal component forms earlier and that the majority of the recently formed stars are in the disc component, which is consistent with disc assembly as outlined in Sections 3.3 and 3.7.
The stellar metallicity (lower panel of Figure 13) increases with up to and then remains constant. Interestingly, the metallicities for the spheroidal and the disc components are practically indistinguishable. We speculate that the rather homogeneous metallicity is driven by efficient feedback, which causes metals to mix effectively. The fact that metallicity seems to correlate with the potential well can be explained by a larger stellar mass that produces more metals and by a larger halo that is able to better retain those metals (Marinacci et al., 2014; Grand et al., 2018).
5 Discussion
We have presented a detailed analysis of how the disc and spheroidal components within galaxies evolve in the framework of the IllustrisTNG simulations. In this section, we examine the role of mergers in shaping galaxy morphology and further discuss the nature of low-mass galaxies. Finally, we highlight some remaining questions raised by our investigations, and discuss how we can improve our analysis in the future.
5.1 The role of mergers and the emerging picture
In our standard cosmological model, dark matter haloes and their galaxies merge with each other to build larger structures. With the IllustrisTNG simulations, we confirm previous results (e.g., Rodriguez-Gomez et al., 2016; Qu et al., 2017; Pillepich et al., 2018b) that the ex-situ stellar mass fraction is a steep function of stellar mass (see Figure 10). We put forward that there are three merger regimes: (i) at , the ex-situ fraction is small and dominated by minor mergers; (ii) at , the ex-situ fraction increases strongly, and minor and major mergers are roughly equally important; and (iii) at , the ex-situ fraction reaches and major mergers dominate. The overall upturn of the ex-situ stellar mass fraction above can be explained by the efficient star-formation quenching in the TNG model (primarily induced by effective black-hole feedback) around that mass scale: the only way to grow more massive is by accretion of lower-mass galaxies.
The mass growth of galaxies with is dominated by in-situ star formation. For these galaxies, mergers are typically gas-rich and a disc can re-form (e.g., Hammer et al., 2005; Hopkins et al., 2009). Nevertheless, mergers play an important role in the assembly of the structure of these galaxies: those with a high spheroid-to-total fraction and a high concentration also have a significantly enhanced ex-situ stellar mass fraction (see Figure 11). The stellar mass density profiles (Figure 12) reveal that the spheroidal mass fraction peaks in the centre, while the ex-situ fraction peaks in the outskirts. Furthermore, the ex-situ stellar mass budget is clearly dominated by minor mergers (Figure 10).
All of these findings are consistent with the picture suggested by Hernquist (1989), where tidal effects during mergers may induce instabilities that can funnel a large amount of gas into the central region of a galaxy, thereby inducing a starburst that creates a spheroidal component. Additionally, based on zoom-in simulations, it has been suggested that misaligned accretion (i.e. counter-rotating gas accretion) can also lead to gas compaction and the formation of a central spheroidal component (Sales et al., 2012; Zolotov et al., 2015; Tacchella et al., 2016b). This channel is especially efficient when gas fractions are high, e.g., for local low-mass galaxies and galaxies at high redshifts. This shows that typical star-forming galaxies on the main sequence can form bulges in-situ, consistent with observations (Nelson et al., 2016a, 2019c; Tacchella et al., 2015a, 2018).
The transition from the minor to major merger regime at is important. First, this transition is directly reflected in the stellar mass density profiles: the ex-situ mass fraction is radially increasing when minor mergers dominate, while it is roughly constant with radius when major mergers dominate (see Figure 12). Secondly, it can have important implications for the size growth of quiescent galaxies: minor mergers lead to the increase of the radius as the square of the mass in contrast to the usual linear rate of increase for major mergers (Naab et al., 2009). Finally, this mass scale is roughly consistent with the critical mass above which slow rotators are abundant (e.g., Cappellari, 2016).
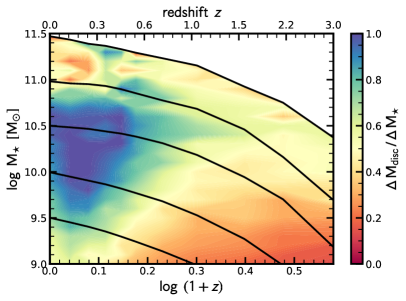
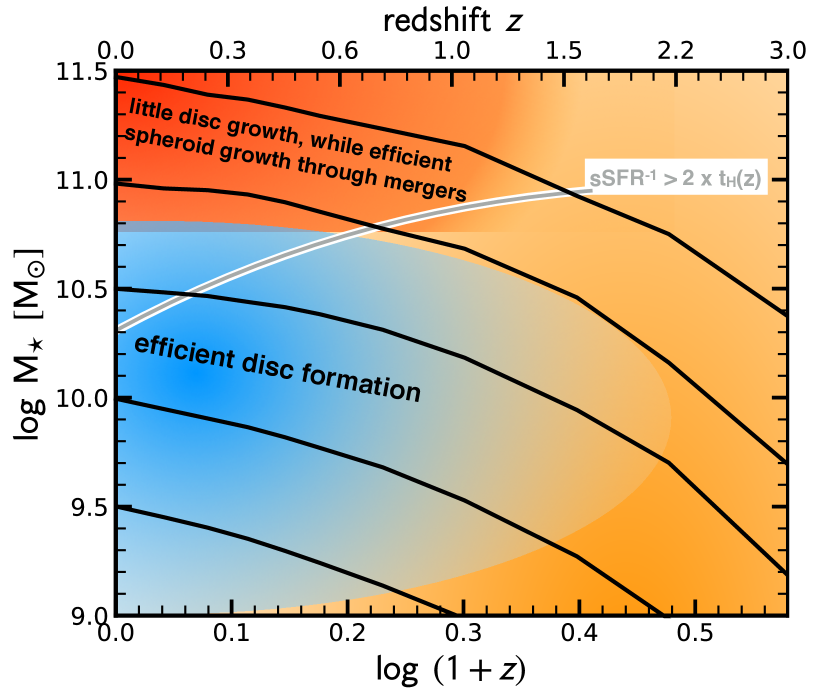
We summarize the emerging picture of spheroid and disc growth in IllustrisTNG in Figure 14. Both and cosmic time play crucial roles in understanding the build-up of morphology. Stellar mass and its correlation with star formation controls whether galaxies grow mainly by in-situ star formation or by ex-situ mergers. Cosmic time sets the gas accretion rate and gas content of the galaxies. As shown in Pillepich et al. (2019), star-forming, H emitting gas of TNG galaxies with stellar masses of at is always colder and in discier configurations than the stars. Hence, the stars that form initially cold are either quickly heated up into kinematically hot configurations, or the different star-formation events are misaligned, leading to an overall hot stellar system.
In any case, significant spheroidal assembly takes place during the star-formation phase of the galaxies at early cosmic times. Galaxies are able to efficiently grow a disc at lower redshifts () and in the mass regime of . The most massive galaxies have moved through this mass range too early and were thus unable to efficiently form a disc (Figure 14). Their stellar component is at all times dominated by random motions. About half of their spheroidal component has assembled while they were star-forming at early times, the other half through mergers after ceasing their star formation nearly 6-10 billion years ago (Figure 8). Those mergers directly build up the spheroid component, but also indirectly contribute by disrupting any pre-existing stellar disc (though this process is subdominant on average).
From these considerations and from Figure 9, it is evident that galaxies do not necessarily need to change their morphology when they cease their star formation in order to explain the colour-morphology relation observed at . Specifically, we show in Figure 5 that, at fixed , S/T depends on the colour, while does not. This difference can be explained by the fact that the S/T evolves with cosmic time, while the relation does not. Galaxies that quench and leave the star-forming main sequence at early times have, at that moment, a higher S/T value than similar-mass galaxies today, though their is comparable (see also Figure 19). The observed colour-S/T correlation is simply a reflection of the fact that galaxies that formed their stars earlier formed them in a more spheroidal-like manner.
This conclusion does not imply that dry mergers are entirely subdominant in spheroid formation. As shown in Figures 8 and 9, there is significant growth of the spheroid component after galaxies cease their star formation. On average, the mass in the spheroid component doubles and S/T slightly increases by up to 0.1.
5.2 Low-mass galaxies in IllustrisTNG
We find in Figure 2 that TNG galaxies with have low concentration (), i.e., that their stellar mass density is discy (Sérisc index of ) while their stellar kinematics are dominated by random orbits ( at , and higher at earlier cosmic times).
Before interpreting these results, one has to worry that resolution effects could play a role in these galaxies. It is possible that S/T of these low-mass galaxies is overestimated in TNG because of the assumed equation of state (Springel & Hernquist, 2003), which might prevent the formation of thin discs at low masses (Benítez-Llambay et al., 2018). We discuss the impact of resolution on our morphology indicators in Appenidx A. We conclude that resolution may have an effect on the exact numbers quoted, but that the overall trends with stellar mass are robust. Consistently, Pillepich et al. (2019) show that TNG50-2 (with a similar resolution of the TNG100 simulation analysed here) returns a qualitatively consistent picture with TNG50, but they also demonstrate that lower resolution generally underestimates the number of discy galaxies. Specifically, the growth of disc fractions of low-mass galaxies is underestimated by up to 20 percent while it is overestimated at the highest mass end. These findings are consistent with lower resolution imposing thicker disc heights.
Additional support for our findings of high S/T for low-mass galaxies comes from observations, which underpin the upturn of S/T towards low-mass galaxies: Zhu et al. (2018) perform statistical modelling of stellar orbits of 300 local galaxies, confirming the increased prevalence of the hot, warm, and counter-rotating component towards low-mass galaxies (see Figure 3). Along similar lines, Wheeler et al. (2017) show that of the local dwarf galaxies have dispersion-supported rather than rotation-supported stellar motions. Finally, Simons et al. (2015) quote as the mass above which all star-forming galaxies form discs based on H kinematics.
What is the physical cause for the rather large S/T values of low-mass galaxies? Works based on higher-resolution simulations, in particular zoom-in simulations, find similarly high S/T values. Using the FIRE-2 simulations, El-Badry et al. (2018) find that 15 out of their 17 galaxies with are dominated by random stellar motion and show no clear sign of the formation of a cold stellar disc. Only more massive galaxies with show a prominent disc component at (Garrison-Kimmel et al., 2018). They argue that the reduced rotational support in their low-mass galaxies is due to stellar feedback driving non-circular motions in the gas, in combination with heating by the UV background which suppresses the accretion of high angular momentum gas. Similarly, works based on the VELA simulations (Ceverino et al., 2014) find that galaxies around at have stellar mass and SFR distributions following roughly exponential disc profiles (Tacchella et al., 2016b), though these galaxies tend to be triaxial, prolate, and dispersion-dominated (Zolotov et al., 2015; Ceverino et al., 2015; Tomassetti et al., 2016). These authors argue that dark matter dominates the gravitational budget, which leads to the reduced rotational support. Rotating discs in these simulations form only after gas compaction events, which lead to a high central stellar mass density (Tacchella et al., 2016b; Tomassetti et al., 2016).
We argue that the formation mechanism of these dispersion-dominated, low-mass systems needs to be investigated in more detail. Since the star-formation histories in IllustrisTNG are less variable on short time scales than the ones in FIRE-2, stellar feedback driving non-circular motions in the gas is probably not their main formation mechanism in TNG. As shown in Pillepich et al. (2019), star formation takes place in cold and discy configuration. Therefore, the initially cold stars are either quickly heated up into kinematically hot configurations, or the different star-formation events are misaligned with respect to each other, leading to an overall hot system (Sales et al., 2012; Danovich et al., 2015).
5.3 Outstanding questions
As highlighted in the previous section, the resolution of our simulation is an important caveat. The TNG100 simulation used in this work is a state-of-the-art simulation that matches many current observational constraints successfully (e.g., Donnari et al., 2019; Diemer et al., 2019, see Nelson et al. 2019b for a summary). We have shown that galaxy morphology, as measured by S/T and , is also reasonably consistent with observed trends. Nevertheless, it is difficult to prove that the structure of galaxies in these simulations is converged. As discussed above and shown in Appendix A, S/T and change when decreasing the resolution. However, the main trends and dependencies on colour and stellar mass, and thus the key conclusions of this paper, are robust.
A related aspect of the simulation is the sub-grid models for star formation and feedback. The ISM model in IllustrisTNG pressurizes the gas and might therefore not be reliable in low-mass galaxies (). The agreement of our morphological measurements for those galaxies with observations and also with zoom-in simulations might arise for the wrong, unphysical reasons. However, Pillepich et al. (2019) tested the impact of the sub-grid pressure term and concluded that the vertical structure of star-forming discs negligibly depends on the parameter choices in the ISM model.
In terms of the feedback implementation, the results for IllustrisTNG and the original Illustris simulations exhibit large differences (e.g., Figures 15 and 20). Thus, quantities such as stellar mass profiles can constrain the feedback models, given a detailed comparison with observations. We compared the S/T and values as a function of from TNG with observational data in Section 3.2 and Figure 3. We find overall good agreement and the main trends from the simulations are confirmed by observations.
A more detailed comparison concerning the morphology of galaxies has been presented in Rodriguez-Gomez et al. (2019) and Huertas-Company et al. (2019), where the simulations have been forward-modeled into the observational space. Rodriguez-Gomez et al. (2019) find that the optical morphologies of IllustrisTNG galaxies are in good agreement with observations. In particular, the median trends with stellar mass of all the morphological, size, and shape parameters considered in that work lie within the scatter of the observational trends, consistent with our findings (Figure 3). This agreement is to be expected because our mass-based concentration measurements are in qualitative agreement with the light-based ones from Rodriguez-Gomez et al. (2019), as shown in Appendix B. Furthermore, they show that IllustrisTNG does not produce a strong morphology-colour relation, i.e., that the red disc fraction is too high. This is consistent with the absence of a trend between and colour that we illustrate in Figure 5, though we also show there that there is a correlation between S/T and colour. As we have discussed above, one key reason for this is that S/T evolves with redshift, while does not. We speculate that this points towards some missing physical mechanism that introduces a -dependent relation. For example, gas might not be efficiently transported to the central region in high- galaxies. Further investigation of the gas mass, stellar mass, and SFR density profiles are needed. Additionally, Bustamante & Springel (2019) showed that by introducing a new sub-grid model for the black-hole spin evolution, they are able to alleviate some of the tension in the galaxy morphology-colour relation. The reason for this is that the kinetic feedback mode is activated predominantly in merging galaxies, in which major morphological changes take place as well. Understanding this link between the black hole sub-grid physics and morphology further is crucial and motivates future studies.
Along similar lines, Huertas-Company et al. (2019) study the morphology in TNG, finding that the majority of high-mass galaxies are discs rather than spheroids, in contrast to our findings. They inferred morphology from the light distribution and classified galaxies with a machine learning algorithm trained on visually classified SDSS galaxies, while our morphological measures are based on kinematics and the mass distribution. Beyond the complications of the machine learning approach, this highlights the importance of kinematical versus photometric morphological measures and comparisons.
While forward modelling the simulations into the observational space is key in order to perform an apples-to-apples comparison, adding another layer of free parameters on top of the galaxy formation model also increases modelling uncertainty. It is therefore important to properly marginalize over those parameters before concluding that the underlying galaxy formation model needs to be modified.
6 Summary and Conclusions
We have studied the relation between morphology, stellar mass, and star-formation activity in the IllustrisTNG galaxy formation model. We focus on TNG100 central galaxies with stellar masses in the range . We quantify galaxy morphology by a kinematical decomposition of the stellar component into a spheroid and a disc component (S/T) and by the concentration of the stellar mass density profile ().
Our conclusions are as follows.
-
•
Both S/T and exhibit a strong dependence. Typical disc galaxies with a low concentration and cold stellar kinematics () have a stellar mass of . More massive galaxies are spheroids with hot kinematics and a high concentration, while low-mass galaxies have hot kinematics but a low concentration. These trends agrees well with observations (Figure 3).
-
•
In addition to stellar mass, the morphology of TNG galaxies correlates with their colour and star-formation activity (Figures 4 and 5). Specifically, S/T increases from the blue cloud to the red sequence at fixed . Contrarily, shows no colour dependence and only depends on stellar mass. Since correlates with light-based morphological indicators (Appendix B), this is consistent with Rodriguez-Gomez et al. (2019), who found the morphology-colour correlation to be too weak in IllustrisTNG.
-
•
A key result of this work is that galaxies do not necessarily change their morphology when they transition through the green valley on to the quiescent sequence (Figure 9), this depending on mass scale and morphological estimator. Galaxies’ morphology (particularly and spheroidal and bulge mass fractions) is largely set before they cease their star formation. The observed correlation between S/T and colour (star formation) is mostly a reflection of the fact that galaxies that formed their stars earlier formed them mostly in a spheroidal-like manner: the S/T relation evolves with cosmic time to lower values (disc assembly). On the other hand, the relation remains constant with cosmic time, leading no correlation between and colour.
-
•
The formation of disc and spheroidal components depends critically on stellar mass and cosmic time. At early times (), the mass growth of all galaxies is dominated by in-situ star formation, usually forming significant spheroidal components. Towards lower redshift (), discs start to form efficiently in the regime of (Figure 7).
-
•
Above this mass scale, galaxies quench efficiently due to black-hole feedback, implying that further mass growth occurs via ex-situ accretion. Minor mergers contribute significantly to the accretion of mass (Figure 10) that is preferentially deposited in the outskirts (Figure 12), especially in galaxies below . For the most massive galaxies, major mergers contribute the majority of ex-situ stellar mass, which dominates at all radii including the central region (Figure 12). Dry mergers can also play a role in spheroid formation: during the quiescent evolution of these massive galaxies, the mass in the spheroid component doubles and S/T slightly increases by up to 0.1 (Figures 8 and 9).
-
•
Intermediate-mass galaxies () exhibit a correlation between the ex-situ stellar mass fraction with S/T and (Figure 11). This trend is consistent with a picture where mergers induce an enhancement of centrally concentrated star-formation that lead to the formation of a spheroidal component and a high concentration. Therefore, the bulge component consists mostly of stars that formed in-situ (Figure 12), though its formation is, to a large degree, induced by mergers. In future work, it would be interesting to decompose the bulge formation contributed by true “in-situ gas” versus “ex-situ gas” brought in by mergers.
The main conclusion of our work is that although we find a correlation between star-formation activity and morphology at a given epoch, we do not find a direct link between the two. In IllustrisTNG, the main mechanism responsible for the cessation of star formation is black-hole feedback, which itself has no direct dependence on morphology (neither on the kinematics of the stars nor on the concentration of the stellar mass profile). Clearly, both the morphology and the black-hole mass are shaped by similar physical processes such as mergers that can funnel gas into the central region. Nevertheless, the main reason for the morphology-star formation correlation is that the quiescent population contains galaxies that have ceased their star formation over a wide range of epochs, during which the star-forming galaxy population has evolved tremendously. Specifically, many of today’s quiescent galaxies stopped their star formation when star-forming galaxies had a larger spheroidal mass fraction.
We have shown how a numerical simulation such as TNG can be used to help to interpret observations and guide future observing endeavours. As highlighted throughout the text, we have left several follow-up studies for future work, including a more detailed comparison with observations. In particular, we will learn more about the low-mass regime from the TNG50 simulation (Nelson et al., 2019a; Pillepich et al., 2019), which has a mass resolution that is about 16 times better than the simulation analysed here.
Acknowledgements
We thank the referee for carefully reading the manuscript and providing constructive feedback. We are grateful to Mauro Giavalisco, Susan Kassin, Rohan Naidu, Erica Nelson, and Paul Torrey for productive discussions. This research made use of NASA’s Astrophysics Data System (ADS), the arXiv.org preprint server, and the python packages Matplotlib (Hunter, 2007), Astropy (Astropy Collaboration et al., 2013), and Colossus (Diemer, 2018). The TNG100 simulations used in this work have been run on the HazelHen Cray XC40-system at the High Performance Computing Center Stuttgart as part of project GCS-ILLU of the Gauss Centres for Supercomputing (GCS). ST is supported by the Smithsonian Astrophysical Observatory through the CfA Fellowship. BD acknowledges support from the program HST-HF2-51406.001-A, which was provided by NASA through a grant from the Space Telescope Science Institute, operated by the Association of Universities for Research in Astronomy, Incorporated, under NASA contract NAS5-26555. FM acknowledges support through the Program “Rita Levi Montalcini” of the Italian MIUR. VRG acknowledges support from the National Science Foundation under Grant No. AST-1517559. MV acknowledges support through an MIT RSC award, a Kavli Research Investment Fund, NASA ATP grant NNX17AG29G, and NSF grants AST-1814053 and AST-1814259.
References
- Amorisco (2017) Amorisco N. C., 2017, MNRAS, 464, 2882
- Astropy Collaboration et al. (2013) Astropy Collaboration et al., 2013, A&A, 558, A33
- Baes et al. (2011) Baes M., Verstappen J., De Looze I., Fritz J., Saftly W., Vidal Pérez E., Stalevski M., Valcke S., 2011, ApJS, 196, 22
- Baldry et al. (2006) Baldry I. K., Balogh M. L., Bower R. G., Glazebrook K., Nichol R. C., Bamford S. P., Budavari T., 2006, MNRAS, 373, 469
- Barnes (1992) Barnes J. E., 1992, ApJ, 393, 484
- Barnes & Hernquist (1991) Barnes J. E., Hernquist L. E., 1991, ApJ, 370, L65
- Barnes & Hernquist (1996) Barnes J. E., Hernquist L., 1996, ApJ, 471, 115
- Barro et al. (2013) Barro G., et al., 2013, ApJ, 765, 104
- Barro et al. (2014) Barro G., et al., 2014, ApJ, 791, 52
- Barro et al. (2017) Barro G., et al., 2017, ApJ, 840, 47
- Bekki & Couch (2011) Bekki K., Couch W. J., 2011, MNRAS, 415, 1783
- Bender et al. (1988) Bender R., Doebereiner S., Moellenhoff C., 1988, A&AS, 74, 385
- Benítez-Llambay et al. (2018) Benítez-Llambay A., Navarro J. F., Frenk C. S., Ludlow A. D., 2018, MNRAS, 473, 1019
- Bernardi et al. (2013) Bernardi M., Meert A., Sheth R. K., Vikram V., Huertas-Company M., Mei S., Shankar F., 2013, MNRAS, 436, 697
- Bershady et al. (2000) Bershady M. A., Jangren A., Conselice C. J., 2000, AJ, 119, 2645
- Bezanson et al. (2009) Bezanson R., van Dokkum P. G., Tal T., Marchesini D., Kriek M., Franx M., Coppi P., 2009, ApJ, 697, 1290
- Bignone et al. (2017) Bignone L. A., Tissera P. B., Sillero E., Pedrosa S. E., Pellizza L. J., Lambas D. G., 2017, MNRAS, 465, 1106
- Binney (1978) Binney J., 1978, MNRAS, 183, 501
- Binney (2005) Binney J., 2005, MNRAS, 363, 937
- Bluck et al. (2014) Bluck A. F. L., Mendel J. T., Ellison S. L., Moreno J., Simard L., Patton D. R., Starkenburg E., 2014, MNRAS, 441, 599
- Bottrell et al. (2017a) Bottrell C., Torrey P., Simard L., Ellison S. L., 2017a, MNRAS, 467, 1033
- Bottrell et al. (2017b) Bottrell C., Torrey P., Simard L., Ellison S. L., 2017b, MNRAS, 467, 2879
- Bouché et al. (2010) Bouché N., et al., 2010, ApJ, 718, 1001
- Bournaud et al. (2011) Bournaud F., et al., 2011, ApJ, 730, 4
- Brook et al. (2011) Brook C. B., et al., 2011, MNRAS, 415, 1051
- Brook et al. (2012) Brook C. B., Stinson G., Gibson B. K., Roškar R., Wadsley J., Quinn T., 2012, MNRAS, 419, 771
- Bruce et al. (2014) Bruce V. A., et al., 2014, MNRAS, 444, 1001
- Bustamante & Springel (2019) Bustamante S., Springel V., 2019, arXiv e-prints,
- Camps & Baes (2015) Camps P., Baes M., 2015, Astronomy and Computing, 9, 20
- Cappellari (2016) Cappellari M., 2016, ARA&A, 54, 597
- Cappellari et al. (2007) Cappellari M., et al., 2007, MNRAS, 379, 418
- Carollo et al. (1993) Carollo C. M., Danziger I. J., Buson L., 1993, MNRAS, 265, 553
- Carollo et al. (2013) Carollo C. M., et al., 2013, ApJ, 773, 112
- Carollo et al. (2016) Carollo C. M., et al., 2016, ApJ, 818, 180
- Ceverino et al. (2014) Ceverino D., Klypin A., Klimek E. S., Trujillo-Gomez S., Churchill C. W., Primack J., Dekel A., 2014, MNRAS, 442, 1545
- Ceverino et al. (2015) Ceverino D., Primack J., Dekel A., 2015, MNRAS, 453, 408
- Chambers et al. (2016) Chambers K. C., et al., 2016, arXiv e-prints,
- Chang et al. (2013) Chang Y.-Y., et al., 2013, ApJ, 773, 149
- Christensen et al. (2014) Christensen C. R., Brooks A. M., Fisher D. B., Governato F., McCleary J., Quinn T. R., Shen S., Wadsley J., 2014, MNRAS, 440, L51
- Cibinel et al. (2015) Cibinel A., et al., 2015, ApJ, 805, 181
- Clauwens et al. (2018) Clauwens B., Schaye J., Franx M., Bower R. G., 2018, MNRAS,
- Cole et al. (2000) Cole S., Lacey C. G., Baugh C. M., Frenk C. S., 2000, MNRAS, 319, 168
- Correa et al. (2017) Correa C. A., Schaye J., Clauwens B., Bower R. G., Crain R. A., Schaller M., Theuns T., Thob A. C. R., 2017, MNRAS, 472, L45
- Correa et al. (2019) Correa C. A., Schaye J., Trayford J. W., 2019, MNRAS, 484, 4401
- Cox et al. (2006) Cox T. J., Dutta S. N., Di Matteo T., Hernquist L., Hopkins P. F., Robertson B., Springel V., 2006, ApJ, 650, 791
- Crain et al. (2015) Crain R. A., et al., 2015, MNRAS, 450, 1937
- D’Onghia et al. (2006) D’Onghia E., Burkert A., Murante G., Khochfar S., 2006, MNRAS, 372, 1525
- Danovich et al. (2015) Danovich M., Dekel A., Hahn O., Ceverino D., Primack J., 2015, MNRAS, 449, 2087
- Davis & Peebles (1983) Davis M., Peebles P. J. E., 1983, ApJ, 267, 465
- Dekel & Burkert (2014) Dekel A., Burkert A., 2014, MNRAS, 438, 1870
- Dekel et al. (2009) Dekel A., Sari R., Ceverino D., 2009, ApJ, 703, 785
- Diemer (2018) Diemer B., 2018, ApJS, 239, 35
- Diemer et al. (2019) Diemer B., et al., 2019, MNRAS, 487, 1529
- Dimauro et al. (2019) Dimauro P., et al., 2019, arXiv e-prints,
- Donnari et al. (2019) Donnari M., et al., 2019, MNRAS, 485, 4817
- Driver et al. (2011) Driver S. P., et al., 2011, MNRAS, 413, 971
- Dubois et al. (2016) Dubois Y., Peirani S., Pichon C., Devriendt J., Gavazzi R., Welker C., Volonteri M., 2016, MNRAS, 463, 3948
- El-Badry et al. (2018) El-Badry K., et al., 2018, MNRAS, 473, 1930
- Elbaz et al. (2007) Elbaz D., et al., 2007, A&A, 468, 33
- Elmegreen et al. (2009) Elmegreen B. G., Elmegreen D. M., Fernandez M. X., Lemonias J. J., 2009, ApJ, 692, 12
- Emsellem et al. (2007) Emsellem E., et al., 2007, MNRAS, 379, 401
- Faber et al. (1997) Faber S. M., et al., 1997, AJ, 114, 1771
- Fagioli et al. (2016) Fagioli M., Carollo C. M., Renzini A., Lilly S. J., Onodera M., Tacchella S., 2016, ApJ, 831, 173
- Faisst et al. (2017) Faisst A. L., Carollo C. M., Capak P. L., Tacchella S., Renzini A., Ilbert O., McCracken H. J., Scoville N. Z., 2017, ApJ, 839, 71
- Fall & Efstathiou (1980) Fall S. M., Efstathiou G., 1980, MNRAS, 193, 189
- Forbes et al. (2014) Forbes J. C., Krumholz M. R., Burkert A., Dekel A., 2014, MNRAS, 438, 1552
- Förster Schreiber et al. (2006) Förster Schreiber N. M., et al., 2006, ApJ, 645, 1062
- Förster Schreiber et al. (2011) Förster Schreiber N. M., et al., 2011, ApJ, 739, 45
- Förster Schreiber et al. (2018) Förster Schreiber N. M., et al., 2018, ApJS, 238, 21
- Gadotti et al. (2010) Gadotti D. A., Baes M., Falony S., 2010, MNRAS, 403, 2053
- Garrison-Kimmel et al. (2018) Garrison-Kimmel S., et al., 2018, MNRAS, 481, 4133
- Genel et al. (2010) Genel S., Bouché N., Naab T., Sternberg A., Genzel R., 2010, ApJ, 719, 229
- Genel et al. (2014) Genel S., et al., 2014, MNRAS, 445, 175
- Genel et al. (2015) Genel S., Fall S. M., Hernquist L., Vogelsberger M., Snyder G. F., Rodriguez-Gomez V., Sijacki D., Springel V., 2015, ApJ, 804, L40
- Genel et al. (2018) Genel S., et al., 2018, MNRAS, 474, 3976
- Genzel et al. (2008) Genzel R., et al., 2008, ApJ, 687, 59
- Genzel et al. (2010) Genzel R., et al., 2010, MNRAS, 407, 2091
- Gómez et al. (2017) Gómez F. A., et al., 2017, MNRAS, 472, 3722
- Governato et al. (2009) Governato F., et al., 2009, MNRAS, 398, 312
- Governato et al. (2010) Governato F., et al., 2010, Nature, 463, 203
- Grand et al. (2018) Grand R. J. J., et al., 2018, MNRAS, 474, 3629
- Hammer et al. (2005) Hammer F., Flores H., Elbaz D., Zheng X. Z., Liang Y. C., Cesarsky C., 2005, A&A, 430, 115
- Hernquist (1989) Hernquist L., 1989, Nature, 340, 687
- Hernquist (1992) Hernquist L., 1992, ApJ, 400, 460
- Hernquist (1993) Hernquist L., 1993, ApJ, 409, 548
- Hopkins et al. (2009) Hopkins P. F., Cox T. J., Younger J. D., Hernquist L., 2009, ApJ, 691, 1168
- Hopkins et al. (2010) Hopkins P. F., et al., 2010, ApJ, 715, 202
- Huertas-Company et al. (2019) Huertas-Company M., et al., 2019, arXiv e-prints,
- Hunter (2007) Hunter J. D., 2007, Computing In Science & Engineering, 9, 90
- Illingworth (1977) Illingworth G., 1977, ApJ, 218, L43
- Jonsson et al. (2010) Jonsson P., Groves B. A., Cox T. J., 2010, MNRAS, 403, 17
- Kelvin et al. (2012) Kelvin L. S., et al., 2012, MNRAS, 421, 1007
- Kent (1985) Kent S. M., 1985, ApJS, 59, 115
- Kormendy (2016) Kormendy J., 2016, in Laurikainen E., Peletier R., Gadotti D., eds, Astrophysics and Space Science Library Vol. 418, Galactic Bulges. p. 431 (arXiv:1504.03330), doi:10.1007/978-3-319-19378-6˙16
- Kormendy & Bender (1996) Kormendy J., Bender R., 1996, ApJ, 464, L119
- Kormendy & Bender (2012) Kormendy J., Bender R., 2012, ApJS, 198, 2
- Lagos et al. (2017) Lagos C. d. P., Theuns T., Stevens A. R. H., Cortese L., Padilla N. D., Davis T. A., Contreras S., Croton D., 2017, MNRAS, 464, 3850
- Lang et al. (2014) Lang P., et al., 2014, ApJ, 788, 11
- Lange et al. (2016) Lange R., et al., 2016, MNRAS, 462, 1470
- Law et al. (2009) Law D. R., Steidel C. C., Erb D. K., Larkin J. E., Pettini M., Shapley A. E., Wright S. A., 2009, ApJ, 697, 2057
- Lilly & Carollo (2016) Lilly S. J., Carollo C. M., 2016, ApJ, 833, 1
- Lilly et al. (2013) Lilly S. J., Carollo C. M., Pipino A., Renzini A., Peng Y., 2013, ApJ, 772, 119
- Lotz et al. (2004) Lotz J. M., Primack J., Madau P., 2004, AJ, 128, 163
- Marinacci et al. (2014) Marinacci F., Pakmor R., Springel V., Simpson C. M., 2014, MNRAS, 442, 3745
- Marinacci et al. (2018) Marinacci F., et al., 2018, MNRAS, 480, 5113
- Martin et al. (2018) Martin G., Kaviraj S., Devriendt J. E. G., Dubois Y., Pichon C., 2018, MNRAS, 480, 2266
- Mendel et al. (2015) Mendel J. T., et al., 2015, ApJ, 804, L4
- Mihos & Hernquist (1994) Mihos J. C., Hernquist L., 1994, ApJ, 437, L47
- Mihos & Hernquist (1996) Mihos J. C., Hernquist L., 1996, ApJ, 464, 641
- Moffett et al. (2016) Moffett A. J., et al., 2016, MNRAS, 462, 4336
- Mosleh et al. (2017) Mosleh M., Tacchella S., Renzini A., Carollo C. M., Molaeinezhad A., Onodera M., Khosroshahi H. G., Lilly S., 2017, ApJ, 837, 2
- Naab & Burkert (2003) Naab T., Burkert A., 2003, ApJ, 597, 893
- Naab et al. (2009) Naab T., Johansson P. H., Ostriker J. P., 2009, ApJ, 699, L178
- Naab et al. (2014) Naab T., et al., 2014, MNRAS, 444, 3357
- Naiman et al. (2018) Naiman J. P., et al., 2018, MNRAS, 477, 1206
- Navarro & Steinmetz (2000) Navarro J. F., Steinmetz M., 2000, ApJ, 538, 477
- Navarro & White (1994) Navarro J. F., White S. D. M., 1994, MNRAS, 267, 401
- Nelson et al. (2014) Nelson E., et al., 2014, Nature, 513, 394
- Nelson et al. (2015) Nelson D., et al., 2015, Astronomy and Computing, 13, 12
- Nelson et al. (2016a) Nelson D., Genel S., Pillepich A., Vogelsberger M., Springel V., Hernquist L., 2016a, MNRAS,
- Nelson et al. (2016b) Nelson E. J., et al., 2016b, ApJ, 828, 27
- Nelson et al. (2018) Nelson D., et al., 2018, MNRAS, 475, 624
- Nelson et al. (2019a) Nelson D., et al., 2019a, arXiv e-prints,
- Nelson et al. (2019b) Nelson D., et al., 2019b, Computational Astrophysics and Cosmology, 6, 2
- Nelson et al. (2019c) Nelson E. J., et al., 2019c, ApJ, 870, 130
- Newman et al. (2015) Newman A. B., Belli S., Ellis R. S., 2015, ApJ, 813, L7
- Noeske et al. (2007) Noeske K. G., et al., 2007, ApJ, 660, L47
- Noguchi (1999) Noguchi M., 1999, ApJ, 514, 77
- Oser et al. (2012) Oser L., Naab T., Ostriker J. P., Johansson P. H., 2012, ApJ, 744, 63
- Papovich et al. (2015) Papovich C., et al., 2015, ApJ, 803, 26
- Pastrav et al. (2013) Pastrav B. A., Popescu C. C., Tuffs R. J., Sansom A. E., 2013, A&A, 553, A80
- Patel et al. (2013) Patel S. G., et al., 2013, ApJ, 766, 15
- Penoyre et al. (2017) Penoyre Z., Moster B. P., Sijacki D., Genel S., 2017, MNRAS, 468, 3883
- Pillepich et al. (2015) Pillepich A., Madau P., Mayer L., 2015, ApJ, 799, 184
- Pillepich et al. (2018a) Pillepich A., et al., 2018a, MNRAS, 473, 4077
- Pillepich et al. (2018b) Pillepich A., et al., 2018b, MNRAS, 475, 648
- Pillepich et al. (2019) Pillepich A., et al., 2019, arXiv e-prints,
- Qu et al. (2017) Qu Y., et al., 2017, MNRAS, 464, 1659
- Rodriguez-Gomez et al. (2015) Rodriguez-Gomez V., et al., 2015, MNRAS, 449, 49
- Rodriguez-Gomez et al. (2016) Rodriguez-Gomez V., et al., 2016, MNRAS, 458, 2371
- Rodriguez-Gomez et al. (2017) Rodriguez-Gomez V., et al., 2017, MNRAS, 467, 3083
- Rodriguez-Gomez et al. (2019) Rodriguez-Gomez V., et al., 2019, MNRAS, 483, 4140
- Saglia et al. (2010) Saglia R. P., et al., 2010, A&A, 524, A6
- Sales et al. (2012) Sales L. V., Navarro J. F., Theuns T., Schaye J., White S. D. M., Frenk C. S., Crain R. A., Dalla Vecchia C., 2012, MNRAS, 423, 1544
- Sánchez et al. (2012) Sánchez S. F., et al., 2012, A&A, 538, A8
- Scannapieco et al. (2010) Scannapieco C., Gadotti D. A., Jonsson P., White S. D. M., 2010, MNRAS, 407, L41
- Scannapieco et al. (2012) Scannapieco C., et al., 2012, MNRAS, 423, 1726
- Schawinski et al. (2014) Schawinski K., et al., 2014, MNRAS, 440, 889
- Schaye et al. (2015) Schaye J., et al., 2015, MNRAS, 446, 521
- Schulze et al. (2018) Schulze F., Remus R.-S., Dolag K., Burkert A., Emsellem E., van de Ven G., 2018, MNRAS, 480, 4636
- Schwarzschild (1979) Schwarzschild M., 1979, ApJ, 232, 236
- Sérsic (1968) Sérsic J. L., 1968, Atlas de galaxias australes. Cordoba, Argentina: Observatorio Astronomico
- Sijacki et al. (2015) Sijacki D., Vogelsberger M., Genel S., Springel V., Torrey P., Snyder G. F., Nelson D., Hernquist L., 2015, MNRAS, 452, 575
- Simons et al. (2015) Simons R. C., Kassin S. A., Weiner B. J., Heckman T. M., Lee J. C., Lotz J. M., Peth M., Tchernyshyov K., 2015, MNRAS, 452, 986
- Smethurst et al. (2018) Smethurst R. J., et al., 2018, MNRAS, 473, 2679
- Snyder et al. (2015a) Snyder G. F., Lotz J., Moody C., Peth M., Freeman P., Ceverino D., Primack J., Dekel A., 2015a, MNRAS, 451, 4290
- Snyder et al. (2015b) Snyder G. F., et al., 2015b, MNRAS, 454, 1886
- Snyder et al. (2019) Snyder G. F., Rodriguez-Gomez V., Lotz J. M., Torrey P., Quirk A. C. N., Hernquist L., Vogelsberger M., Freeman P. E., 2019, MNRAS, 486, 3702
- Sparre & Springel (2017) Sparre M., Springel V., 2017, MNRAS, 470, 3946
- Springel & Hernquist (2003) Springel V., Hernquist L., 2003, MNRAS, 339, 289
- Springel et al. (2001) Springel V., White S. D. M., Tormen G., Kauffmann G., 2001, MNRAS, 328, 726
- Springel et al. (2018) Springel V., et al., 2018, MNRAS, 475, 676
- Stott et al. (2016) Stott J. P., et al., 2016, MNRAS, 457, 1888
- Strateva et al. (2001) Strateva I., et al., 2001, AJ, 122, 1861
- Tacchella et al. (2015a) Tacchella S., et al., 2015a, Science, 348, 314
- Tacchella et al. (2015b) Tacchella S., et al., 2015b, ApJ, 802, 101
- Tacchella et al. (2016a) Tacchella S., Dekel A., Carollo C. M., Ceverino D., DeGraf C., Lapiner S., Mandelker N., Primack Joel R., 2016a, MNRAS, 457, 2790
- Tacchella et al. (2016b) Tacchella S., Dekel A., Carollo C. M., Ceverino D., DeGraf C., Lapiner S., Mandelker N., Primack J. R., 2016b, MNRAS, 458, 242
- Tacchella et al. (2017) Tacchella S., Carollo C. M., Faber S. M., Cibinel A., Dekel A., Koo D. C., Renzini A., Woo J., 2017, ApJ, 844, L1
- Tacchella et al. (2018) Tacchella S., et al., 2018, ApJ, 859, 56
- Tadaki et al. (2017) Tadaki K.-i., et al., 2017, ApJ, 834, 135
- Thanjavur et al. (2016) Thanjavur K., Simard L., Bluck A. F. L., Mendel T., 2016, MNRAS, 459, 44
- Thob et al. (2019) Thob A. C. R., et al., 2019, MNRAS, 485, 972
- Toft et al. (2007) Toft S., et al., 2007, ApJ, 671, 285
- Toft et al. (2017) Toft S., et al., 2017, Nature, 546, 510
- Tomassetti et al. (2016) Tomassetti M., et al., 2016, MNRAS,
- Trayford et al. (2019) Trayford J. W., Frenk C. S., Theuns T., Schaye J., Correa C., 2019, MNRAS, 483, 744
- Übler et al. (2018) Übler H., et al., 2018, ApJ, 854, L24
- Veale et al. (2017) Veale M., Ma C.-P., Greene J. E., Thomas J., Blakeslee J. P., McConnell N., Walsh J. L., Ito J., 2017, MNRAS, 471, 1428
- Vogelsberger et al. (2014a) Vogelsberger M., et al., 2014a, MNRAS, 444, 1518
- Vogelsberger et al. (2014b) Vogelsberger M., et al., 2014b, Nature, 509, 177
- Weinberger et al. (2017) Weinberger R., et al., 2017, MNRAS, 465, 3291
- Weinberger et al. (2018) Weinberger R., et al., 2018, MNRAS, 479, 4056
- Wellons et al. (2015) Wellons S., et al., 2015, MNRAS, 449, 361
- Wellons et al. (2016) Wellons S., et al., 2016, MNRAS, 456, 1030
- Wheeler et al. (2017) Wheeler C., et al., 2017, MNRAS, 465, 2420
- Whitaker et al. (2012) Whitaker K. E., van Dokkum P. G., Brammer G., Franx M., 2012, ApJ, 754, L29
- Wisnioski et al. (2015) Wisnioski E., et al., 2015, ApJ, 799, 209
- Wisnioski et al. (2018) Wisnioski E., et al., 2018, ApJ, 855, 97
- Wright et al. (2019) Wright R. J., Lagos C. d. P., Davies L. J. M., Power C., Trayford J. W., Wong O. I., 2019, MNRAS, 487, 3740
- Wuyts et al. (2012) Wuyts S., et al., 2012, ApJ, 753, 114
- Xu et al. (2019) Xu D., et al., 2019, arXiv e-prints,
- Zahid et al. (2019) Zahid H. J., Geller M. J., Damjanov I., Sohn J., 2019, arXiv e-prints,
- Zhang et al. (2019) Zhang H., et al., 2019, MNRAS, 484, 5170
- Zhu et al. (2018) Zhu L., et al., 2018, Nature Astronomy, 2, 233
- Zjupa & Springel (2017) Zjupa J., Springel V., 2017, MNRAS, 466, 1625
- Zolotov et al. (2015) Zolotov A., et al., 2015, MNRAS, 450, 2327
- van Dokkum & Franx (1996) van Dokkum P. G., Franx M., 1996, MNRAS, 281, 985
- van Dokkum et al. (2010) van Dokkum P. G., et al., 2010, ApJ, 709, 1018
- van Dokkum et al. (2014) van Dokkum P. G., et al., 2014, ApJ, 791, 45
- van de Sande et al. (2013) van de Sande J., et al., 2013, ApJ, 771, 85
- van den Bosch (2001) van den Bosch F. C., 2001, MNRAS, 327, 1334
- van der Wel et al. (2014) van der Wel A., et al., 2014, ApJ, 792, L6
Appendix A Resolution dependence in TNG
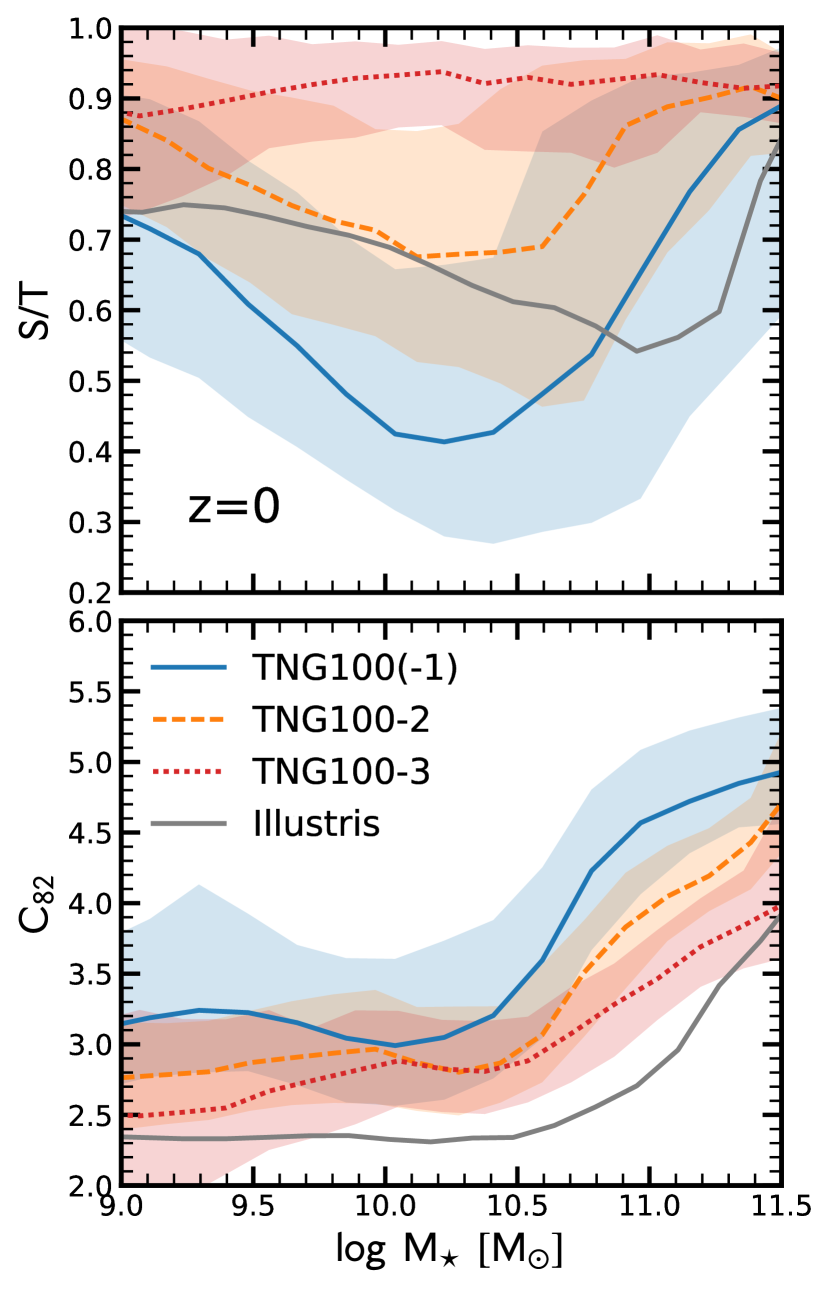
We consider here effects of resolution in the IllustrisTNG simulations. Throughout this paper we have exclusively shown results from our fiducial TNG100-1 volume, whereas here we consider the effects of changing resolution. To do so we analyse TNG100-2 and TNG100-3, realizations with 8 and 64 times lower mass resolution, corresponding to factors of 2 and 4 larger gravitational softening lengths. The numerical parameters of this resolution series are given in Table 1.
Pillepich et al. (2018a) discuss the effects of resolution and numerical convergence in detail. Briefly, using this resolution series, they find higher resolution results in larger galaxy stellar masses at fixed halo mass, leading to a higher normalization of the stellar mass function and cosmic SFR density. Many of the other galaxy population statistics exhibit a similar qualitative trend, i.e. monotonically larger values with increasing numerical resolution. This can be understood by reference to the implementation of star formation in the TNG model. Progressively better spatial resolution leads to the sampling of ever higher gas density regions, allowing more gas mass to become eligible for star formation and to be resolved at higher densities, accelerating the rate at which it is turned into stars.
Using the resolution series of TNG100 (Table 1), in Figure 15 we explore the convergence properties of morphologies in the TNG model. Specifically, we plot the median S/T and versus relations. The solid blue line shows our fiducial model, while the dashed orange and dotted red lines indicate the lower resolution versions. Furthermore, the grey solid line is the original Illustris model.
Reducing the resolution leads to the disappearance of kinematically defined disc galaxies. Since discs are most prominent at intermediate masses (), the median S/T changes most significantly for those galaxies. However, when analysing the scatter in Figure 15, we see that also discs disappear at lower and higher masses when decreasing the resolution. Consistent with this, Pillepich et al. (2019) show that TNG50-2 (comparable resolution of TNG100 analysed here) return a qualitatively consistent picture with TNG50 but demonstrate that lower resolution generally underestimates the number of disc galaxies. Specifically, the growth in time of the disc fractions of low-mass galaxies is underestimated (by up to 20 percent), while it is overestimated at the highest mass end. This is consistent with lower resolution imposing thicker disc heights.
The concentration seems to be less affected by resolution. The largest effect concerns high-mass galaxies, where decreasing the resolution leads to more diffuse galaxies. At lower masses, a similar trend can be seen, but the overall effect is less severe than at higher masses. We have also check the actual values for , the radius that encloses of the stellar mass, and check it they are comparable to the gravitational softening length of the simulation. We find that only of the galaxies below have to be smaller than the gravitational softening. We conclude that this is not the cause of the flattening seen in the relation at low stellar masses.
In Figure 15, we also compare the TNG results with the original Illustris simulations, where we have measured all the properties in exactly the same way. Illustris has practically the same resolution as the TNG100-1 simulation (our fiducial run). Nevertheless, we can find significant differences between these simulations. First, the original Illustris simulation produces much fewer disc-dominated galaxies than TNG, in particular in the mass regime of . This most probably arises because of the improved stellar feedback in TNG. At high masses (), the upturn in S/T is taking place at lower masses in TNG than in the original Illustris simulation, which can be explained by the fact that more galaxies were star forming at those mass scales in Illustris. Through the improved black-hole feedback, galaxies are quenching more effectively at this mass scale in TNG. Similarly, the concentrations are lower in original Illustris and the turnover towards higher concentrations happens at higher stellar masses than in TNG.
We conclude that, using the resolution series of TNG100, these simulations are not converged in an absolute sense, i.e. the physical properties of the galaxies change when increasing or decreasing the resolution. These changes are significant, though the qualitative trends remain. We are therefore confident that we grasp the main evolutionary trends of the galaxy population concerning their morphology and star formation activity.
Appendix B Comparing different morphological indicators
We consider here how different definitions of morphology are correlated with each other. Specifically, in the main text we focus on two morphological indicators: S/T and . In this section, we compare how these indicators change when adopting a different definition of the spheroidal component and when one performs the measurements on the light instead of the mass distribution.
B.1 Different spheroid definitions
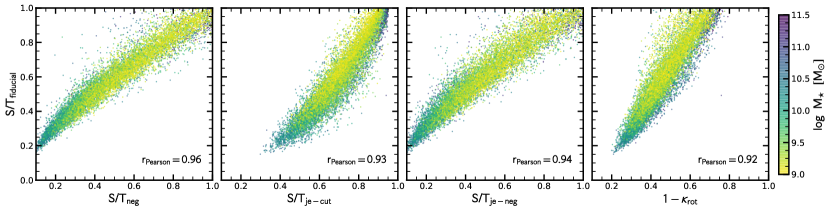
We have tested a number of kinematic spheroid-disc decompositions as well as the fraction of kinetic energy in rotation, , as defined in Sales et al. (2012) and Rodriguez-Gomez et al. (2017). In our fiducial calculation, we compute the spheroidal component as the mass of all stellar particles with plus a 15% correction as discussed in the main text. Here, is the total angular momentum of the particle and the part that is aligned with the galaxy’s rotation (as defined by the total angular momentum of all stellar particles bound to the galaxy). We have also experimented with alternative ways to quantify the spheroidal component: (i) S/Tneg: twice the mass of all stellar population particles that counter-rotate, where rotation is defined as ; (ii) S/Tje-cut: the mass of all stellar particles with , where is the angular momentum of a particle on a circular orbit with the same binding energy (e.g., Marinacci et al., 2014); and (iii) S/Tje-neg: twice the mass of all stellar population particles that counter-rotate, where rotation is defined as .
Another kinematic morphology tracer is (Sales et al., 2012), defined as the fraction of the total kinetic energy contributed by the azimuthal component of the stellar angular momenta, where the -axis coincides with the total angular momentum of the galactic stellar component:
| (3) |
where is the total kinetic energy of the stellar component, represents the mass of a particle, is the projected radius and the sum is carried out over all stellar particles in the galaxy (i.e. not just within ). Following Genel et al. (2015), the calculation frame is centred at the position of the most bound stellar particle, while the velocity of the frame coincides with that of the stellar centre of mass.
We compare these different definitions in Figure 16. All the different definitions for S/T correlate very strongly with each other (Pearson correlation coefficient of ), indicating that the exact method for calculating S/T is not important for our purposes. In addition to scatter, we find small offsets on average between the different S/T estimates. Specifically, the S/Tneg estimates are on average lower than the fiducial S/T estimates. However, the overall change is small and nearly mass independent, leading to a simple overall shift when studying the S/T relation.
B.2 Kinematics versus mass versus light
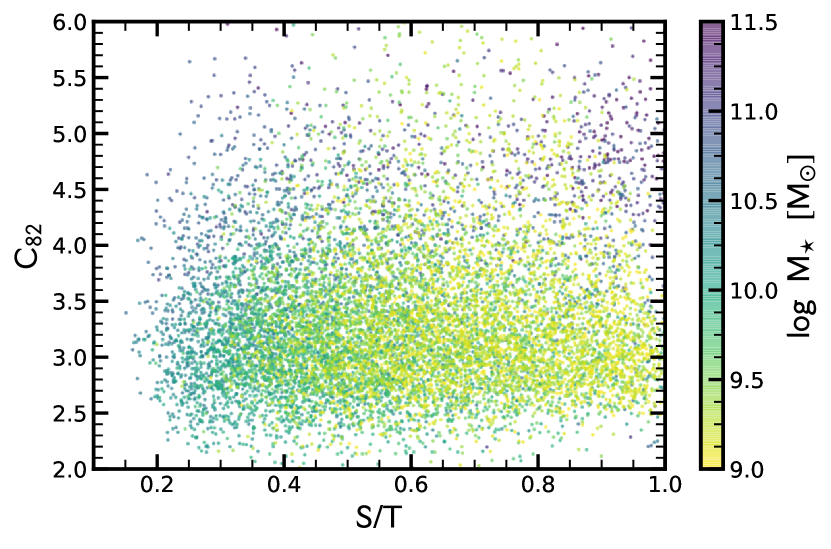

As shown in Figure 4, S/T and depend differently on stellar mass and star formation. Here, we plot in Figure 17 the relation between S/T and . As expected, there is a large amount of scatter and no correlation visible. The major part of the scatter can be attributed to galaxies with low stellar masses (). Those galaxies have typically a low concentration, i.e. are disc-like concerning their stellar mass distribution, but have a significant spheroidal component concerning their kinematics. More massive galaxies () reveal a tighter correlation with a Pearson correlation coefficient of 0.54. Overall, Figure 17 highlights that the morphology according to the mass distribution can be quite different from the kinematic morphology.
The main focus of this paper is the investigation of the assembly and evolution of spheroidal and disc components of TNG galaxies. Hence, we work mainly in theory plane, i.e. quantify the morphology of galaxies based on the stellar mass distribution and kinematics. We only perform a rough comparison to observations in Section 3.2. One way to achieve a more detailed comparison to observations is based on “forward-modelling” of simulation data into the observational plane. In particular, the generation and subsequent analysis of synthetic images from hydrodynamic simulations is a powerful tool to connect theory with observations (e.g., Jonsson et al., 2010; Scannapieco et al., 2010; Snyder et al., 2015b; Snyder et al., 2015a; Bottrell et al., 2017a). However, the generation of realistic synthetic images is challenging such as the aspects of the detailed modelling of dust absorption and scattering.
In Rodriguez-Gomez et al. (2019), we created realistic synthetic images from the IllustrisTNG simulations using the radiative transfer code SKIRT (Baes et al., 2011; Camps & Baes, 2015). Specifically, we designed them to match observations of low-redshift galaxies from the Pan-STARRS Survey (Chambers et al., 2016). We then quantified various structural parameters of both the simulated and observed galaxies using the same morphology code, which allows us to make a fair comparison. We find that the optical morphologies of IllustrisTNG galaxies are in good agreement with Pan-STARRS observations: the locus of the Gini diagram is consistent with that inferred from observations, while the median trends with stellar mass of all the morphological, size and shape parameters lie within the 1 scatter of the observational trends. However, the TNG model has some difficulty with more stringent tests, such as producing a strong morphology-colour relation. This results in a somewhat higher fraction of red discs and blue spheroids compared to observations.
We compare the mass-based and kinematic morphology indicators to light-based indicators in Figure 18 in order to assess how similar they are. In particular, we compare our mass-based concentration and S/T estimates with the light-based concentration and the “bulge statistic” for individual galaxies at . The bulge statistic is based on a combination of the Gini and estimates and quantifies the strength of the bulge component, and hence is tightly correlated with the light-based concentration (Snyder et al., 2015a).
We find that the mass-based concentration is correlated with both the light-based concentration and the bulge statistic (Figure 18). The correlation is quite strong with a Pearson correlation coefficient of . We speculate that the scatter is primarily caused by the effects of (spatially resolved) dust attenuation and scattering, which typically reduces the concentration, though also radial variation in the mass-to-light and spherical versus elliptical apertures could play a role. On the other hand, there is no correlation between these light-based indicators and the kinematic morphological tracer S/T. We find that the light-based concentration and bulge statistic are systematically lower than the kinematic fractions at low masses, but with increasingly good agreement as the stellar mass increases. This is similar to the findings presented in Scannapieco et al. (2010) and Bottrell et al. (2017b). We conclude that the absence of the strong morphology-colour relation seen in Rodriguez-Gomez et al. (2019) is a direct reflection of our finding that there is no -colour relation in Figure 5.
Appendix C Morphology on the star-forming main sequence
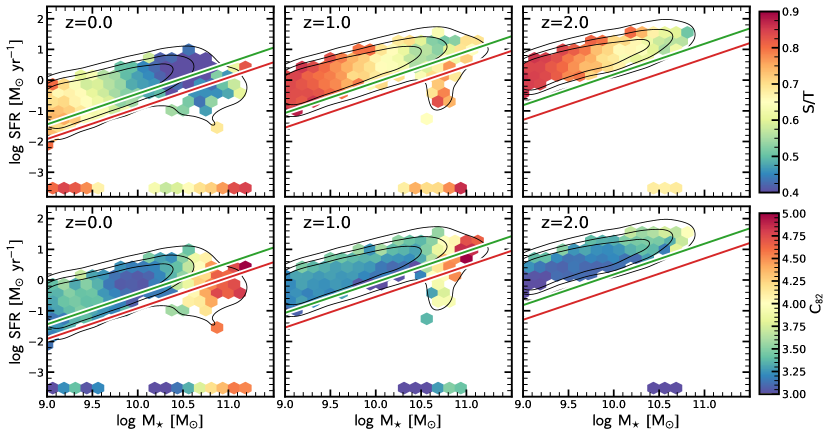
Figure 19 shows the distribution of morphology (S/T and ) in the plane of SFR and , i.e. on the star-forming main sequence. Since SFR and colour are closely related, this figure is consistent with the conclusions drawn from Figure 4. The green and red lines mark the transition and quiescent regions according to the Hubble time as detailed in Equations 1 and 2. Since the normalization of star-forming main sequence roughly evolves proportional to the Hubble time, these cuts are similar to cuts relative to the star-forming main sequence.
As discussed in the main text, there are significant differences between S/T and . First, while mainly depends on , S/T shows an and SFR dependence. Secondly, the dependence of S/T and are different, in particular for low-mass galaxies. Finally, there is a much stronger trend with redshift for S/T than for . In particular, we see that disc galaxies with low S/T only appear in significant numbers at . This is important since it directly translates into a correlation between S/T and colour, while there is no correlation between and colour: quiescent galaxies today were star-forming in the past when S/T were overall higher.
Appendix D Stellar mass profiles in original Illustris

Figure 20 plots the stellar mass density profiles as measured in the original Illustris simulation. The figure follows the exact same layout as Figure 12 in the main text, where we show the profiles for the TNG simulation. Comparing the new TNG profiles with the ones from the original Illustris reveals several differences. First and foremost, the profile shapes are very different: the galaxies in TNG are significantly more concentrated at all stellar masses. This is consistent with the findings of Figure 15. Secondly, the spheroidal component is more dominant in the central region in the original Illustris-1 simulation than in the TNG simulation, in particular in intermediate galaxies (). Finally, the ex-situ fraction for massive galaxies is showing a steep gradient with radius in Illustris-1, while the this trend is much weaker in TNG: at , the ex-situ stellar mass fraction dominates only in the outskirts (outside of ) in Illustris-1, while it dominates at all radii in TNG.
These trends can be explained by the fact that the galaxies in Illustris-1 are more diffuse and have larger sizes than the galaxies in TNG. By construction, the galaxy sizes in TNG are in much better agreement with observations than the ones in the original Illustris-1 (Genel et al., 2018; Pillepich et al., 2018a). Since more diffuse galaxies disperse more efficiently in a galaxy-galaxy merger, mergers in Illustris-1 are not able to bring significant amounts of stellar mass to the centre, which leads to a high ex-situ stellar mass fraction in the outskirts, but a low fraction in the centre. This highlights that there is a direct link between the morphology of galaxies and merger products.