Origin of the DAMPE 1.4 TeV peak
Abstract
Recent accurate measurements of cosmic ray electron flux by the Dark Matter Particle Explorer (DAMPE) reveal a sharp peak structure near 1.4 TeV, which is difficult to explain by standard astrophysical processes. In this letter, we propose a simple model that the enhanced dark matter annihilation via the channel and with the thermal relic annihilation cross section around the current nearest black hole (A0620-00) can satisfactorily account for the sharp peak structure. The predicted dark matter mass is TeV.
keywords:
Dark matter1 Introduction
Observations of galaxies and galaxy clusters reveal the existence of dark matter. Many theoretical models suggest that dark matter particles can self-annihilate to give electrons, positrons, neutrinos, etc. If dark matter particles are thermal relic particles, the predicted thermal relic annihilation cross section is cm3 s-1 for dark matter mass GeV (Steigman, Dasgupta & Beacom, 2012).
In the past decade, observations of HEAT (Beatty et al., 2004), PAMELA (Adriani et al., 2013) and AMS-02 (Aguilar et al., 2013, 2014) reported some excess positron emissions in our Milky Way. These excess positrons can be explained by dark matter annihilation (Boudaud et al., 2015; Mauro et al., 2016). However, recent analyses of gamma-ray and radio observations put some stringent constraints for annihilating dark matter (Ackermann et al., 2015; Albert et al., 2017; Chan & Leung, 2017; Egorov & Pierpaoli, 2013; Chan, 2017a, b; Chan et al., 2019), which give strong tensions for the dark matter interpretation of the positron excess. Besides, many studies start to point out that pulsars’ emission can satisfactorily account for the positron excess in our galaxy (Linden & Profumo, 2013; Delahaye, Kotera & Silk, 2014).
Recently, accurate measurements of electron/positron flux by the Dark Matter Particle Explorer (DAMPE) have been published (Ambrosi et al., 2017). Surprisingly, a sharp peak structure near 1.4 TeV is discovered. This sharp peak likely originates from nearby source because the energy of electrons and positrons would cool down severely after their propagation (Pan, Zhang & Feng, 2018). Various studies have been performed to explain this sharp peak structure, including dark matter annihilation and dark matter decay from nearby dark matter subhalo or ultra-compact micro halos (Pan, Zhang & Feng, 2018; Jin et al., 2018; Anthron et al., 2018; Huang et al., 2018; Gao & Ma, 2017; Niu et al., 2018; Yang, Su & Zhao, 2017; Ding et al., 2018; Ge, He & Wang, 2018). However, the required annihilation cross section obtained is much larger than the thermal relic annihilation cross section and the decay rate obtained is difficult to verify independently. Moreover, the details of the nearby dark matter subhalo are quite uncertain. We still do not have any strong evidence showing the existence of dark matter subhalos in our galaxy.
In this letter, we propose a new simple model which can satisfactorily explain the sharp peak structure. Standard gravitational theory suggests that dark matter distribution would be influenced by the black holes nearby (Gondolo & Silk, 1999). The dark matter density profile would form a mini-spike which can enhance dark matter annihilation rate (Zhao & Silk, 2005; Bertone, Zentner & Silk, 2005; Bertone et al., 2009; Lacroix & Silk, 2018; Chan, 2018). We find that the electrons and positrons emitted from the current nearest black hole (A0620-00) due to the enhanced dark matter annihilation can account for the sharp peak in the energy spectrum.
2 The density spike model
The nearest black hole from us (A0620-00) has been discovered for a long time (Cantrell, 2010). Based on the latest data, the mass of the black hole is and the distance is kpc (Cantrell, 2010). If the black hole grew adiabatically, the dark matter density would be enhanced in a region corresponding to the sphere of influence of the black hole (Lacroix, 2018). A dark matter spike would be produced and the dark matter density would go like with (Gnedin & Primack, 2004). The dark matter density is given by (Lacroix & Silk, 2018)
| (1) |
where is the saturation density with is the age of the black hole, and . The normalization density can be usually determined by assuming the mass inside the spike (Lacroix & Silk, 2018). This gives . In the following, we assume that it is an adiabatic mini-spike, i.e. (Gnedin & Primack, 2004).
The total integrated electron emission rate (in GeV-1 s-1) for the mini-spike is
| (2) |
where is the electron spectrum per dark matter annihilation, which can be obtained in Cirelli et al. (2011). By combining Eqs. (1) and (2), the electron plus positron flux detected is given by (Lacroix & Silk, 2018)
| (3) | ||||
where is the dark matter mass in TeV and is the energy spectrum of electrons or positrons after propagation.
By taking and extrapolating the relation of black hole mass and velocity dispersion ( relation) (Tremaine et al., 2002), we can get pc. Since the black hole is located in the thin disk of our galaxy, the age of the black hole should be smaller than the age of the thin disk Gyr (del Peloso et al., 2005). In the following, we assume a reasonable value Gyr. Using the thermal relic annihilation cross section cm3 s-1 and the distance of the black hole kpc, we get
| (4) |
During propagation, the electrons and positrons produced from dark matter annihilation would mainly cool down by synchrotron radiation and inverse Compton scattering. The cooling rate is , where is a constant which depends on the energy density of the environment and is the energy of the electrons or positrons in GeV. Taking the magnetic field strength G at solar location (Cirelli et al., 2011) (magnetic energy density eV/cm3), the cosmic microwave background radiation energy density eV/cm3 and the optical-infrared radiation energy density eV/cm3 (Atoyan, Aharonian & Völk, 1995), the total energy density is eV/cm3, which corresponds to GeV s-1.
The diffusion length of an electron with initial energy and final energy is given by (Fornengo et al., 2012)
| (5) |
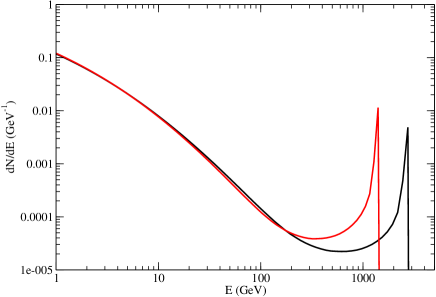
where is the diffusion coefficient and is the diffusion index. Recent studies obtain and for three different benchmark propagation models (MIN, MED and MAX) (see Table 1) (Fornengo et al., 2012; Delahaye et al., 2008). Putting kpc and using the energy spectrum of dark matter annihilation for the initial energy , we can obtain the energy spectrum for the final energy after propagation (see Fig. 1).
3 Fitting with the DAMPE data
The spectra of cosmic ray electrons and positrons were measured by DAMPE with great accuracy (Ambrosi et al., 2017). The DAMPE data are dominated by the background emission, which includes three different sources: primary electrons generated by astrophysical sources, secondary electrons/positrons and pulsars. The empirical fitted spectrum (in GeV-1 m-2 s-1 sr-1) for primary electrons/positrons, secondary electron/positrons and pulsars are respectively modeled by (Pan, Zhang & Feng, 2018)
| (6) |
| (7) |
and
| (8) |
The total flux spectrum of the background cosmic ray electrons and positrons can be described by (Pan, Zhang & Feng, 2018)
| (9) |
Here, the factor 1.6 corresponds to the extra positrons produced due to proton-proton collision (Kamae et al., 2006).
Therefore, the total flux spectrum is . Dark matter annihilation via the channel can give a very narrow electron/positron energy spectrum which peaks at . For kpc and the spectral peak TeV, we get TeV with the MED model parameters (see Fig. 1). In other words, a large amount of electrons and positrons produced from dark matter annihilation around the black hole with initial energy 2.75 TeV cool down to 1.4 TeV after travelling by a distance of 1.06 kpc.
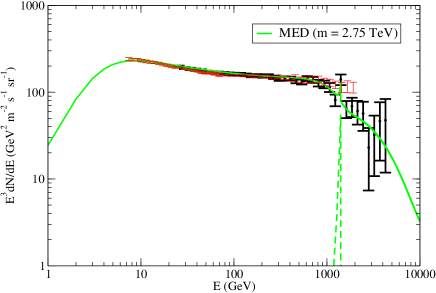
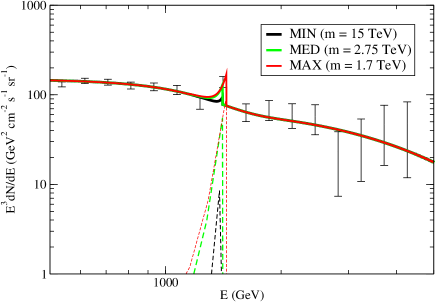
In Fig. 2, we fit the DAMPE data with our model (MED model parameters with TeV) and we find that it gives an excellent agreement with the data. We also test for the MIN and MAX model parameters (see Fig. 3). The dark matter mass predicted for these two models are 15 TeV and 1.7 TeV respectively. However, only the MAX model can produce a good agreement with the data as the flux for the MIN model is too small. In Fig. 2, we also compare our MED model fit with the Fermi-LAT electron/positron spectrum obtained in Abdollahi et al. (2017). Our result generally agrees with the Fermi-LAT spectrum, only except for the data points at 1.7 TeV and 1.9 TeV. Nevertheless, if we consider the systematic uncertainty on the energy reconstruction (see the discussion in Abdollahi et al. (2017)), the uncertainties of these two data points would be much larger and they would agree with the DAMPE data and our result.
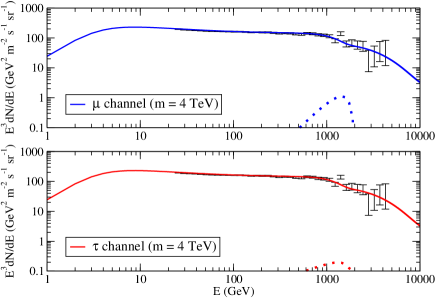
For dark matter annihilating via the and channels, we can see that these two channels are difficult to produce the required flux (see Fig. 4). For the other quark channels (e.g. ) and channel, the maximum flux position is near 1-10 GeV, which are not able to match the 1.4 TeV peak. Therefore, only the channel can produce the required peak.
4 Discussion
We propose a new simple model to account for the 1.4 TeV peak in the DAMPE data. The enhanced dark matter annihilation via the channel surrounding our closest black hole (A0620-00) can give the right amount of electron and positron flux to account for the 1.4 TeV peak. The predicted dark matter mass is 2.75 TeV (with MED model parameters) and we have assumed the thermal relic annihilation cross section. Generally speaking, TeV can give very good agreement with the DAMPE data, with the uncertainty of the diffusion parameters. Only one free parameter, , is involved in the calculations. It is difficult to determine the actual age of the black hole. Here, we have assumed Gyr, which is a reasonable estimation and matches the age of the disk in our Milky Way. If we take Gyr, the resulting flux is still within the uncertainty of the data point. Therefore, our simple model can give a satisfactorily explanation to the observed peak in the DAMPE data.
Some previous observations and analyses have provided stringent constraints of for annihilating dark matter. For instance, the positron and electron detections from AMS-02 have excluded GeV for thermal relic dark matter annihilating via channel (Bergstrom et al., 2013). Besides, the upper limit of annihilation cross section for TeV annihilating via channel is cm3 s-1 based on the H.E.S.S. gamma-ray observations (Abdallah et al., 2016). This upper limit also approximately applies for the channel as the total amount of gamma-ray emitted from the channel is close to that from the channel. Therefore, our result on the mass range TeV with the thermal relic annihilation cross section cm3 s-1 can evade the current stringent limits on and .
In fact, there is one known black hole (in Cygnus X-1) with mass located at kpc from us (the second nearest known black hole) (Orosz et al., 2011). However, since the diffusion distance is longer, the required dark matter mass would be much larger. In order to produce the 1.4 TeV peak, the required dark matter mass is 21 TeV, which would largely suppress the electron/positron flux (). Therefore, if there exists some unknown black holes which are located at distance smaller than 1 kpc, they can significantly contribute to the resultant electron/positron flux. However, these potential flux contributions depend on the black hole mass and the actual distance, which are difficult to model and predict. Based on the fact that we have not yet discovered any black hole within 1 kpc from us, we have omitted these potential flux contributions.
Previous studies mainly focus on assuming that the 1.4 TeV peak originates from dark matter decay or annihilation from a nearby dark matter subhalo or ultra-compact micro halos (Pan, Zhang & Feng, 2018; Jin et al., 2018; Anthron et al., 2018; Huang et al., 2018; Yang, Su & Zhao, 2017; Ding et al., 2018). However, there is no strong evidence showing the existence of dark matter subhalos or compact halos in our galaxy and the results obtained from these studies are very uncertain. In our model, we rely on the fact of the existence of a nearby black hole and the standard physics of the dark matter spike formation. We use the thermal relic annihilation cross section in standard cosmology and follow the standard diffusion scenario in high-energy astrophysics to calculate the predicted dark matter mass. Using a reasonable value of , the predicted electron and positron flux gives an excellent agreement with the DAMPE data. Therefore, compared with the previous studies, our model is an outstanding one (with the fewest assumptions) to explain the 1.4 TeV peak.
There are three important implications based on this result. First, we can obtain the mass of dark matter, which is about 1.5-3 TeV. This mass range can be severely tested in future collider experiments. Second, dark matter would annihilate via channel with a very large branch ratio. Similar signals can also be detected in dark matter dominated galaxies (e.g. Milky Way dwarf spheroidal satellite galaxies), which can be verified by future high-energy observations (e.g. radio observations). Third, the signal of dark matter annihilation can be greatly enhanced by black holes. This has been discussed extensively about the emission near a supermassive black hole (Fields, Shapiro & Shelton, 2014; Lacroix, 2018). More studies in this direction can verify our model and disclose the mystery of dark matter.
| Model | (kpc2/Myr) | |
|---|---|---|
| MIN | 0.00595 | 0.55 |
| MED | 0.0112 | 0.70 |
| MAX | 0.0765 | 0.46 |
5 acknowledgements
This work was supported by a grant from the Research Grants Council of the Hong Kong Special Administrative Region, China (Project No. EdUHK 28300518).
References
- Abdallah et al. (2016) Abdallah H. et al. 2016, Phys. Rev. Lett. 117, 111301.
- Abdollahi et al. (2017) Abdollahi S. et al., 2017, Phys. Rev. D 95, 082007.
- Ackermann et al. (2015) Ackermann M. et al., 2015, Phys. Rev. Lett. 115, 231301.
- Adriani et al. (2013) Adriani O. et al., 2013, Phys. Rev. Lett. 111, 081102.
- Aguilar et al. (2013) Aguilar M. et al., 2013, Phys. Rev. Lett. 110, 141102.
- Aguilar et al. (2014) Aguilar M. et al., 2014, Phys. Rev. Lett. 113, 121102.
- Albert et al. (2017) Albert A. et al., 2017, Astrophys. J. 834, 110.
- Ambrosi et al. (2017) Ambrosi G. et al., 2017, Nature 552, 63.
- Anthron et al. (2018) Anthron P., Balazs C., Fowlie A., Zhang Y., 2018, J. High Energy Phys. 2018, 121.
- Atoyan, Aharonian & Völk (1995) Atoyan A. M., Aharonian F. A., Völk H. J., 1995, Phys. Rev. D 52, 3265.
- Beatty et al. (2004) Beatty J. J. et al., 2004, Phys. Rev. Lett. 93, 241102.
- Bergstrom et al. (2013) Bergstrom L., Bringmann T., Cholis I., Hooper D., Weniger C., 2013, Phys. Rev. Lett. 111, 171101.
- Bertone, Zentner & Silk (2005) Bertone G., Zentner A. R., Silk J., 2005, Phys. Rev. D 72, 103517.
- Bertone et al. (2009) Bertone G., Fornasa M., Taoso M., Zentner A. R., 2009, New J. Phys. 11, 105016.
- Boudaud et al. (2015) Boudaud M. et al., 2015, Astron. Astrophys. 575, A67.
- Cantrell (2010) Cantrell, A. G., 2010, Astrophys. J. 710, 1127.
- Chan (2017a) Chan M. H., 2017a, Phys. Rev. D 96, 043009.
- Chan (2017b) Chan M. H., 2017b, Astrophys. J. 844, 9.
- Chan & Leung (2017) Chan M. H., Leung C. H., 2017, Sci. Rept. 7, 14895.
- Chan (2018) Chan M. H., 2018, Mon. Not. R. Astron. Soc. 481, 3618.
- Chan et al. (2019) Chan M. H., Cui L., Liu J., Leung C. S., 2019, Astrophys. J. 872, 177.
- Cirelli et al. (2011) Cirelli M. et al., 2011, J. Cosmol. Astropart. Phys. 03, 051.
- del Peloso et al. (2005) del Peloso E. F., da Silva L., Porto de Mello G. F., Arany-Prado L. I., 2005, Astron. Astrophys. 440, 1153.
- Delahaye et al. (2008) Delahaye T., Lineros R., Donato F., Fornengo N., Salati P., 2008, Phys. Rev. D 77, 063527.
- Delahaye, Kotera & Silk (2014) Delahaye T., Kotera K., Silk J., 2014, Astrophys. J. 794, 168.
- Ding et al. (2018) Ding R., Han Z.-L., Feng L., Zhu B., 2018, Chin. Phys. C 42, 083104.
- Egorov & Pierpaoli (2013) Egorov A. E., Pierpaoli E., 2013, Phys. Rev. D 88, 023504.
- Fields, Shapiro & Shelton (2014) Fields B. D., Shapiro S. L., Shelton J., 2014, Phys. Rev. Lett. 113, 151302.
- Fornengo et al. (2012) Fornengo N., Lineros R. A., Regis M., Taoso M., 2012, J. Cosmol. Astropart. Phys. 01, 005.
- Gao & Ma (2017) Gao Y., Ma Y.-Z., 2017, arXiv:1712.00370.
- Ge, He & Wang (2018) Ge S.-F., He H.-J., Wang Y.-C., 2018, Phys. Lett. B 781, 88.
- Gnedin & Primack (2004) Gnedin O. Y., Primack J. R., 2004, Phys. Rev. Lett. 93, 061302.
- Gondolo & Silk (1999) Gondolo P., Silk J., 1999, Phys. Rev. Lett. 83, 1719.
- Huang et al. (2018) Huang X.-J., Wu Y.-L., Zhang W.-H., Zhou Y.-F., 2018, Phys. Rev. D 97, 091701.
- Jin et al. (2018) Jin H.-B., Yue B., Zhang X., Chen X., 2018, Phys. Rev. D 98, 123008.
- Kamae et al. (2006) Kamae T., Karlsson N., Mizuno T., Abe T., Koi T., 2006, Astrophys. J. 647, 692.
- Lacroix (2018) Lacroix T., 2018, Astron. Astrophys. 619, A46.
- Lacroix & Silk (2018) Lacroix T., Silk J., 2018, Astrophys. J. 853, L16.
- Linden & Profumo (2013) Linden T., Profumo S., 2013, Astrophys. J. 772, 18.
- Mauro et al. (2016) Di Mauro M., Donato F., Fornengo N., Vittino A., 2016, J. Cosmol. Astropart. Phys. 05, 031.
- Niu et al. (2018) Niu J. S., Li T., Ding R., Zhu B., Xue H. F., Wang Y., 2018, Phys. Rev. D 97, 083012.
- Orosz et al. (2011) Orosz J. A., McClintock J. E., Aufdenberg J. P., Remillard R. A., Reid M. J., Narayan R., Gou L., 2011, Astrophys. J. 742, 84.
- Pan, Zhang & Feng (2018) Pan X., Zhang C., Feng L., 2018, Sci. China-Phys. Mech. Astron. 61, 101006.
- Steigman, Dasgupta & Beacom (2012) Steigman G., Dasgupta B., Beacom J. F., 2012, Phys. Rev. D 86, 023506.
- Tremaine et al. (2002) Tremaine S. et al., 2002, Astrophys. J. 574, 740.
- Yang, Su & Zhao (2017) Yang F., Su M., Zhao Y., 2017, arXiv:1712.01724.
- Zhao & Silk (2005) Zhao H.-S., Silk J., 2005, Phys. Rev. Lett. 95, 011301.