Spectrum of the Yellow Symbiotic Star LT Delphini before, during, and after the 2017 Outburst
LT Del is a yellow symbiotic system that consists of a bright K3-type giant and a hot subdwarf with a temperature K. We present the results of our spectroscopic observations of LT Del over the period 2010-2018. In 2017 the star experienced a second low-amplitude () outburst in the history of its studies. The emission spectrum of the star represented in the optical range by hydrogen, neutral and ionized helium lines underwent significant changes in the outburst. The fluxes in the HI and HeI emission lines increased by a factor of 5-6, the HeII 4686 line grew by a factor of 10. According to our estimates, in the 2017 outburst the temperature of the exciting star rose to 130 000 K, while during the first 1994 outburst the change in temperature was insignificant. This suggests cool and hot outbursts of LT Del by analogy with similar events of another yellow symbiotic star, AG Dra.
Keywords: symbiotic stars, binary systems, spectroscopic observations.
Introduction
The variable LT Del (Hen 2-467) belongs to a small group of yellow symbiotic stars whose prototype is generally believed to be AG Dra. The system LT Del consists of a bright late-G or early-K giant and a compact hot star with a temperature 100 000 K. Allen (1984) classified LT Del as an S-type symbiotic star, a binary system without a circumstellar dust envelope. The orbital period of the system is (Arkhipova et al. 2011). Over the entire history of its observations LT Del has experienced two low-amplitude outbursts, in 1994 and 2017, the photometric behavior in which was described by Arkhipova et al. (1995a) and Ikonnikova et al. (2019), respectively.
The spectroscopic observations of LT Del have been carried out for more than 40 years, beginning with Lutz (1975). The cool component of the system LT Del has been classified repeatedly. Initially, Lutz et al. (1976) assigned the spectral type G to the star based on the presence of the G band and the CaI 4226 absorption line in the spectrum. Subsequently, Munari and Buson (1992) obtained an estimate of G6III from the infrared (IR) CaII triplet. Arkhipova et al. (1995a) took the spectral type of the cool component as G8 II based on photometric data. Yet another estimate, K3-4, was obtained by 3500–7000 Å.
Pereira et al. (1998) analyzed a high-resolution optical spectrum for the yellow component of LT Del and found it to be a metal-poor K giant with K, and [Fe/H]=–1.1. The atmosphere of the cool star is enriched in the s-process elements formed as a result of the evolution of the system’s hot component on the asymptotic giant branch (AGB). The high radial velocity ( km s-1) together with the low metallicity suggest that LT Del belongs to the Galactic halo population.
A study of the ultraviolet (UV) spectrum for LT Del based on IUE data allowed Munari and Buson (1992) to estimate the temperature of the hot star, K, from the energy distribution in the range 1300–1900 Å and to obtain a considerably lower value, K, by the Zanstra method from the HeII 1640.
The emission spectrum of the gas component represented mostly by hydrogen, neutral and ionized helium lines is superimposed on the spectrum of the cool component in the optical range. Lutz et al. (1976) were the first to measure the relative intensities of the HI, HeI, HeII 4686 and CII 4267. Subsequently, Lutz (1977) detected a change in the intensity ratio of the HeII 4686 and H, lines, while Kaler and Lutz (1980) found variations of the fluxes in the continuum and H, H and HeII 4686 emission lines. Navarro et al. (1987) derived the relative emission line intensities in the optical spectral range and compared their results with the data of Lutz et al. (1976) and Lutz (1977). Munari and Buson (1992) measured the absolute emission line fluxes in the range from 3835 to 7065 Å, studied the emission line variability based on previously published and their own data, and concluded that the emission sources in the HI and HeII lines are localized in different regions. Arkhipova et al. (1995b) analyzed the emission spectrum of the star in the 1994 outburst. Subsequently, based on their 1995–2009 observations, Arkhipova et al. (2011) confirmed that the intensities of the Balmer hydrogen and neutral helium lines trace the pattern of the system’s brightness variations related to the orbital motion, while the flux in the HeII 4686 line does not change within the measurement error limits.
In this paper we report the results of our spectroscopic observations over the period from 2010 to 2018. We were able to trace the development of the emission spectrum for LT Del before, during, and after the 2017 outburst and to reveal differences in the spectrum in the 1994 and 2017 outbursts.
Spectroscopic Observations
Systematic spectroscopic observations of LT Del have been carried out with a 1.25-m telescope at the Crimean Astronomical Station of the Sternberg Astronomical Institute of the Moscow State University since 1984. The results of the observations in 1984–2009 were reported previously in Arkhipova et al. (1995b, 2011).
The spectra from 2010 to 2018 were taken at the same telescope with an ST-402 CCD array and a 600 lines mm-1 diffraction grating, which gave a resolution (FWHM) of about 7.5 Å. The investigated spectral range was from 4200 to 7200 Å and, at some dates, to 9000 Å. Data on the observational material are contained in Table 1, while Fig. 1 shows the times of spectroscopic observations together with the light curve from Ikonnikova et al. (2019). Table 1 lists the orbital phases calculated with the following linear elements: JD(Min) = 2445930 + 476.d0 (Arkhipova et al. 2011). The stars 50 Boo, 18 Vul, 29 Vul, 40 Cyg, 57 Cyg were used as standards. The absolute spectral energy distributions for the standards in the range 4000–7650 Å were taken from the spectrophotometric catalogue by Glushneva et al. (1998) and were extended to 9000 Å using data from the atlas of standard stellar spectra by Pickles (1998). The spectra were reduced using the standard CCDOPS and MAXIM packages and the SPE code developed by Sergeev and Heisberger (1993).
| Date | JD | Phase | Range, Å |
|---|---|---|---|
| July 7, 2010 | 2455385 | 0.86 | 4000-7200 |
| July 31, 2011 | 2455774 | 0.68 | 4000-7200 |
| Aug. 27, 2011 | 2455801 | 0.74 | 4000-7200 |
| July 26, 2012 | 2456135 | 0.44 | 4000-7200 |
| Oct. 16, 2012 | 2456217 | 0.61 | 4000-7200 |
| Aug. 30, 2014 | 2456900 | 0.05 | 4000-7200 |
| Aug. 10, 2015 | 2457245 | 0.77 | 4000-7200 |
| Aug. 5, 2016 | 2457606 | 0.53 | 4000-9000 |
| June 21, 2017 | 2457926 | 0.20 | 4000-9000 |
| June 30, 2017 | 2457935 | 0.22 | 4000-9000 |
| July 25, 2017 | 2457960 | 0.27 | 4000-9000 |
| Sep. 15, 2017 | 2458012 | 0.38 | 4000-9000 |
| Sep. 22, 2017 | 2458019 | 0.40 | 4000-9000 |
| Oct. 23, 2017 | 2458050 | 0.46 | 4000-7200 |
| July 11, 2018 | 2458311 | 0.01 | 4000-9000 |
| Aug. 6, 2018 | 2458337 | 0.06 | 4000-9000 |
| Sep. 12, 2018 | 2458374 | 0.14 | 4000-9000 |
| Sep. 17, 2018 | 2458379 | 0.15 | 4000-9000 |
| Oct. 8, 2018 | 2458400 | 0.20 | 4000-9000 |
| Oct. 16, 2018 | 2458408 | 0.21 | 4000-9000 |

Analysis of the Emission Spectrum for LT Del
In comparison with the spectra of classical symbiotic stars with red cool components, the optical emission spectrum of LT Del is quite poor and is represented only by hydrogen, neutral and ionized helium lines. There are no forbidden lines, in particular, [OIII] and [NII] emissions, and no feature characteristic for the spectra of symbiotic stars, the Raman OVI 6825. Absorption features are clearly seen in the spectrum of LT Del in quiescence: the MgI 5167, DNaI, BaII 6496 and the IR CaII triplet. However, the low spectral resolution does not allow us to quantitatively analyze the absorption spectrum of the system s cool component.
We measured the absolute fluxes and equivalent widths of the H, H, H, HeI 4388, 4713, 4921, 5016, 5048, 5876, 6678, 7065, 7281, HeII 4686, 5412 emission lines in the 2010–2018 spectra and give them in Tables 2 and 3, respectively. We estimate the accuracy of measuring the fluxes and equivalent widths to be within the range from 5% strong lines to 10 % for weaker ones.
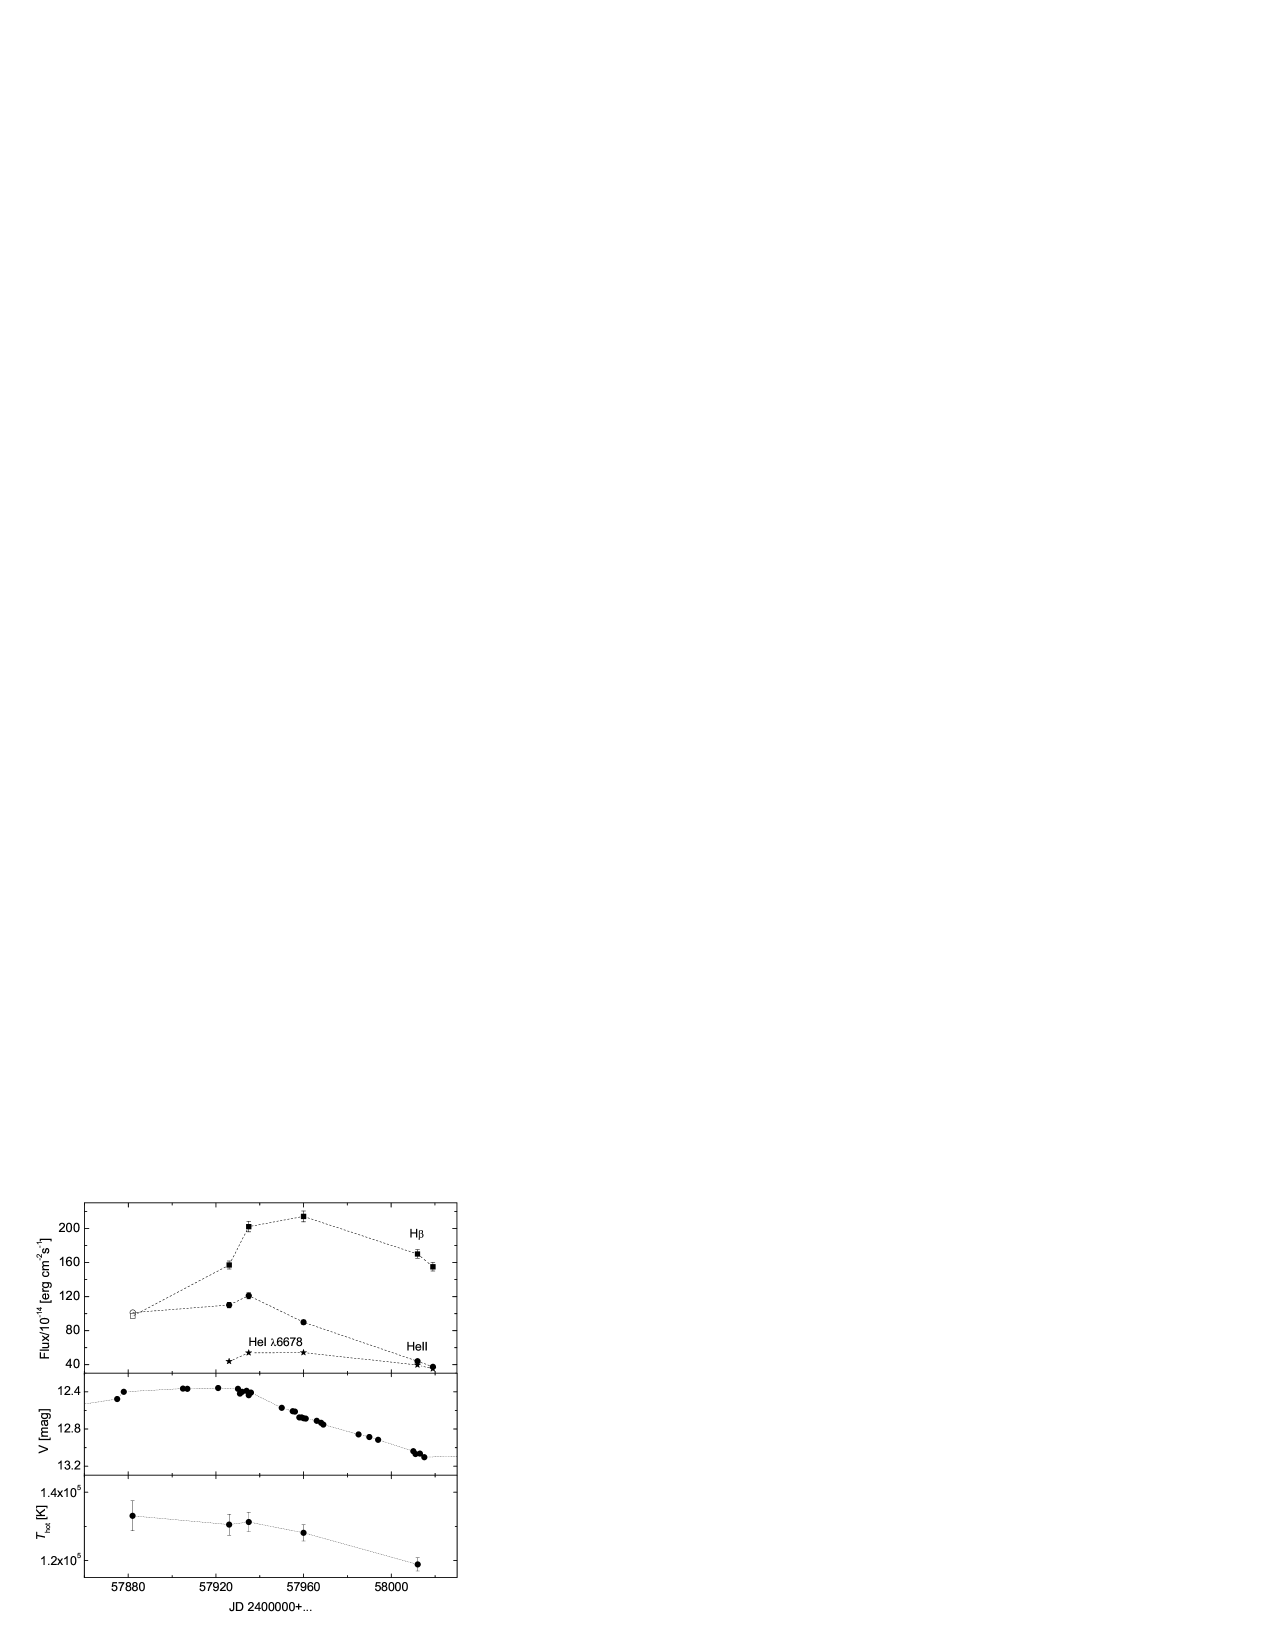
The emission line fluxes and equivalent widths change noticeably with time. The variations in the fluxes of the strongest lines, H, HeI 6678 and HeII 4686, over the period from 1984 to 2018 according to the data from Munari and Buson (1992), Arkhipova et al. (1995b, 2011), Munari et al. (2017), and our new observations, along with the band light curve from Arkhipova et al. (1995a, 2011) and Ikonnikova et al. (2019), are shown in Fig. 2.

Outside the outbursts the variability of the HI and HeI emission lines is synchronized with the magnitude variations and reflects a change in the visibility conditions for the line formation region during the orbital motion. In contrast to low-excitation lines, the flux in the HeII 4686 line does not depend on the orbital phase, as was shown previously (Munari and Buson 1992; Arkhipova et al. 2011) and is confirmed by our new observations. This is direct evidence that no eclipse of the compact HeII emission line formation region and the hot star occurs in the system. Figure 3 shows the variations in the equivalent widths of the H, HeI 6678 and HeII 4686 lines with orbital phase, along with the -band phase light curve, from the observations in quiescence from 2010 to 2015 and in 2018.

In 2016, when the star was in its pre-outburst state, we took a spectrum near the orbital maximum (). At this time the fluxes in the lines, including HeII 4686, were appreciably higher than they were at close phases in preceding years, as shown in Fig. 4, where, in particular, fragments of the 2016 () and 2012 () spectra are presented.
In 1994 the first low-amplitude () outburst of LT Del in the history of its studies occurred at orbital phases 0.57–0.90 and lasted 160 days (Arkhipova et al. 1995a). The absorption features belonging to the cool component remained visible in the outburst. The fluxes in the HI, HeI, and HeII emission lines were enhanced by a factor of 2–3 compared to their mean values for these orbital phases. The temperature of the hot star in the outburst was estimated by the Zanstra method from the HeII 4686, line to be K. This value is lower than that obtained for the quiescent state of the star, K (Arkhipova et al. 1995b).
Munari et al. (2017) reported a new outburst of LT Del in 2017. According to the spectroscopic data obtained by them on May 8, 2017, with the Asiago 1.22-m telescope (Italy) (the range 3200–7900 Å, a dispersion of 2.31 Å/pixel), the nebular continuum became stronger and veiled the continuum features of the cool star. The HeII 4686 emission line in this spectrum was slightly stronger than H ( vs erg cm-2 s-1), the high-excitation OIII 3444 and 3429, OIV 3411, [Ne V] 3345 and 3427 lines were visible. The flux ratio of Balmer lines H:H:H:H was 3.53:1.00:0.46:0.36.
In 2017, from June 21 to October 23, we took six spectrograms for LT Del. It can be seen from Table 2 that all the emission lines in the outburst strengthened considerably. The fluxes increased by a factor of 5–6 in the HI and HeI lines and by a factor of 10 in HeII 4686 compared to the quiescent state of the system at the same orbital phases. The HeI 4388, 4713, 5048, 7281 emission lines, which were not detected previously in the spectrum of LT Del, appeared. Figure 5 shows the variations of the fluxes in the H, HeI 6678 and HeII 4686 lines in 2017 and the band light curve. In the spectrum taken on May 8, 2017, (Munari et al. 2017) HeII 4686 was slightly stronger than H, while in our later spectra (on June 21, 2017, and later) H is much more intense than HeII 4686. According to our data, the peak flux in the HeII 4686 line was observed near maximum light (JD=2457935), while the fluxes in the hydrogen and neutral helium lines reached their peak values 30 days later, when the brightness of the star decreased by , which may be related to different localizations of the formation regions of the ionized helium lines (close to the hot subdwarf) and the hydrogen and neutral helium emissions (a region in the wind and near the surface of the cool component). In the outburst the absorption features belonging to the cool star became undetectable, because the contribution of the gas continuum and the hot star increased.
In 2018 the star returned to quiescence. From July 11 to October 16 we took six spectrograms while the system was at orbital phases from 0.01 to 0.21. As expected, during the egress from the orbital minimum the fluxes in the HI and HeI lines rose. The HeII 4686 line in 2018 was stronger than before the 2017 outburst, except for the date JD=2458311 referring to orbital phase 0.01. In 2018 absorptions of the cool star clearly manifested themselves in the spectrum of LT Del.

The Ratio of the Fluxes in the HeII ?4686 and H Lines and the Temperature of the Hot Star
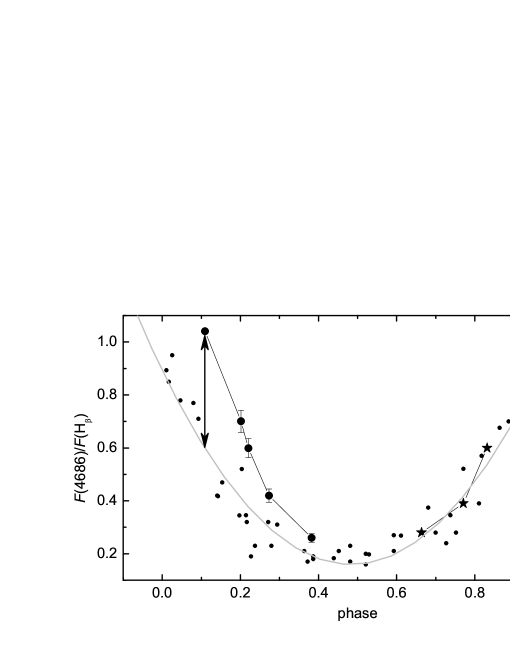
The ratio of the absolute fluxes in the HeII 4686 and H lines in the spectrum of LT Del changes with orbital phase; these changes concern H, while the intensity of HeII 4686 remains approximately constant. Figure 6 shows the phase dependence of according to the data from Lutz et al. (1976), Lutz (1977), Allen (1984), Navarro et al. (1987), Munari and Buson (1992), Arkhipova et al. (1995b, 2011), Munari et al. (2017), and our new observations. In quiescence the ratio varies from 0.16 at maximum to 0.95 at minimum light. At phase 0.5 the HeII and HI emission line formation regions are completely visible, while at phase 0.0 much of the hydrogen line emission zone is hidden from the observer by the cool component.
In the active state the ratio also varies with the phase, as can be seen from Fig. 6. However, there is a significant difference between the 1994 and 2017 outbursts: whereas in 1994 the values of were virtually indistinguishable from those for the quiescent state of the system at the same orbital phases, in 2017 they were noticeably higher, which may be indicative of an increase in the temperature of the hot star.
Iijima (1981) proposed a modified method of Ambartsumyan (1932) to estimate the temperature of the central stars of planetary nebulae and the hot components of symbiotic binaries in the form of an equation:
| (1) |
where – is the temperature of the hot star, , and are the fluxes in the 4686, H and HeI 4471 lines corrected for interstellar extinction.
In the spectrum of LT Del in quiescence HeI 4471 HeI is distinguished with difficulty against the continuum background, in the outburst it is extremely weak and its measurement is unreliable. The other lines of the HeI triplet series, 5876 and 7065, are fairly strong and, therefore, we decided to use HeI 5876 to take into account the fraction of photons from the hot star absorbed by helium atoms. The effective recombination coefficient for HeI 5876 was calculated with the PyNeb package (Luridiana et al. 2015), which uses the results of Porter et al. (2012, 2013) to compute the HeI atom. Given what has been said above, we transformed (1) to the following equation:
| (2) |
where , and are the fluxes in HeII 4686, H and HeI 5876, and used it to estimate the temperature of the exciting star in LT Del. The line fluxes were corrected for interstellar reddening with (Skopal 1995).
The most reliable value of for LT Del can be obtained for orbital phase 0.5, when the region of ionized hydrogen is most open to the observer. For other configurations of the system part of the HII region is covered by the cool component, which increases the ratio . Using Eq. 2 we found that in quiescence at maximum light K, which is in agreement with the estimate of = 100 000 K from Skopal (2005) and considerably higher than the temperature of the hot star K inferred by the Zanstra method from HeII 1640 (Munari and Buson 1992).
We also estimated the temperature of the exciting star in the 2017 outburst. Our spectroscopic observations in 2017 refer to the times when part of the HI and HeI emission region was covered by the disk of the cool star. We assumed that in the outburst the sizes of the HII and HeII regions did not change and they were obscured by the disk of the cool star during the orbital motion in the same way as in quiescence, while the HeIII region was always visible.
According to our estimates, the temperature of the hot star in the 2017 outburst increased to130 000 K, remaining at this level until JD2457935, after which it began to decrease together with the fading of the system. Figure 5 shows a plot of the variations from the 2017 observations.
The Optical Spectral Energy Distribution for LT Del
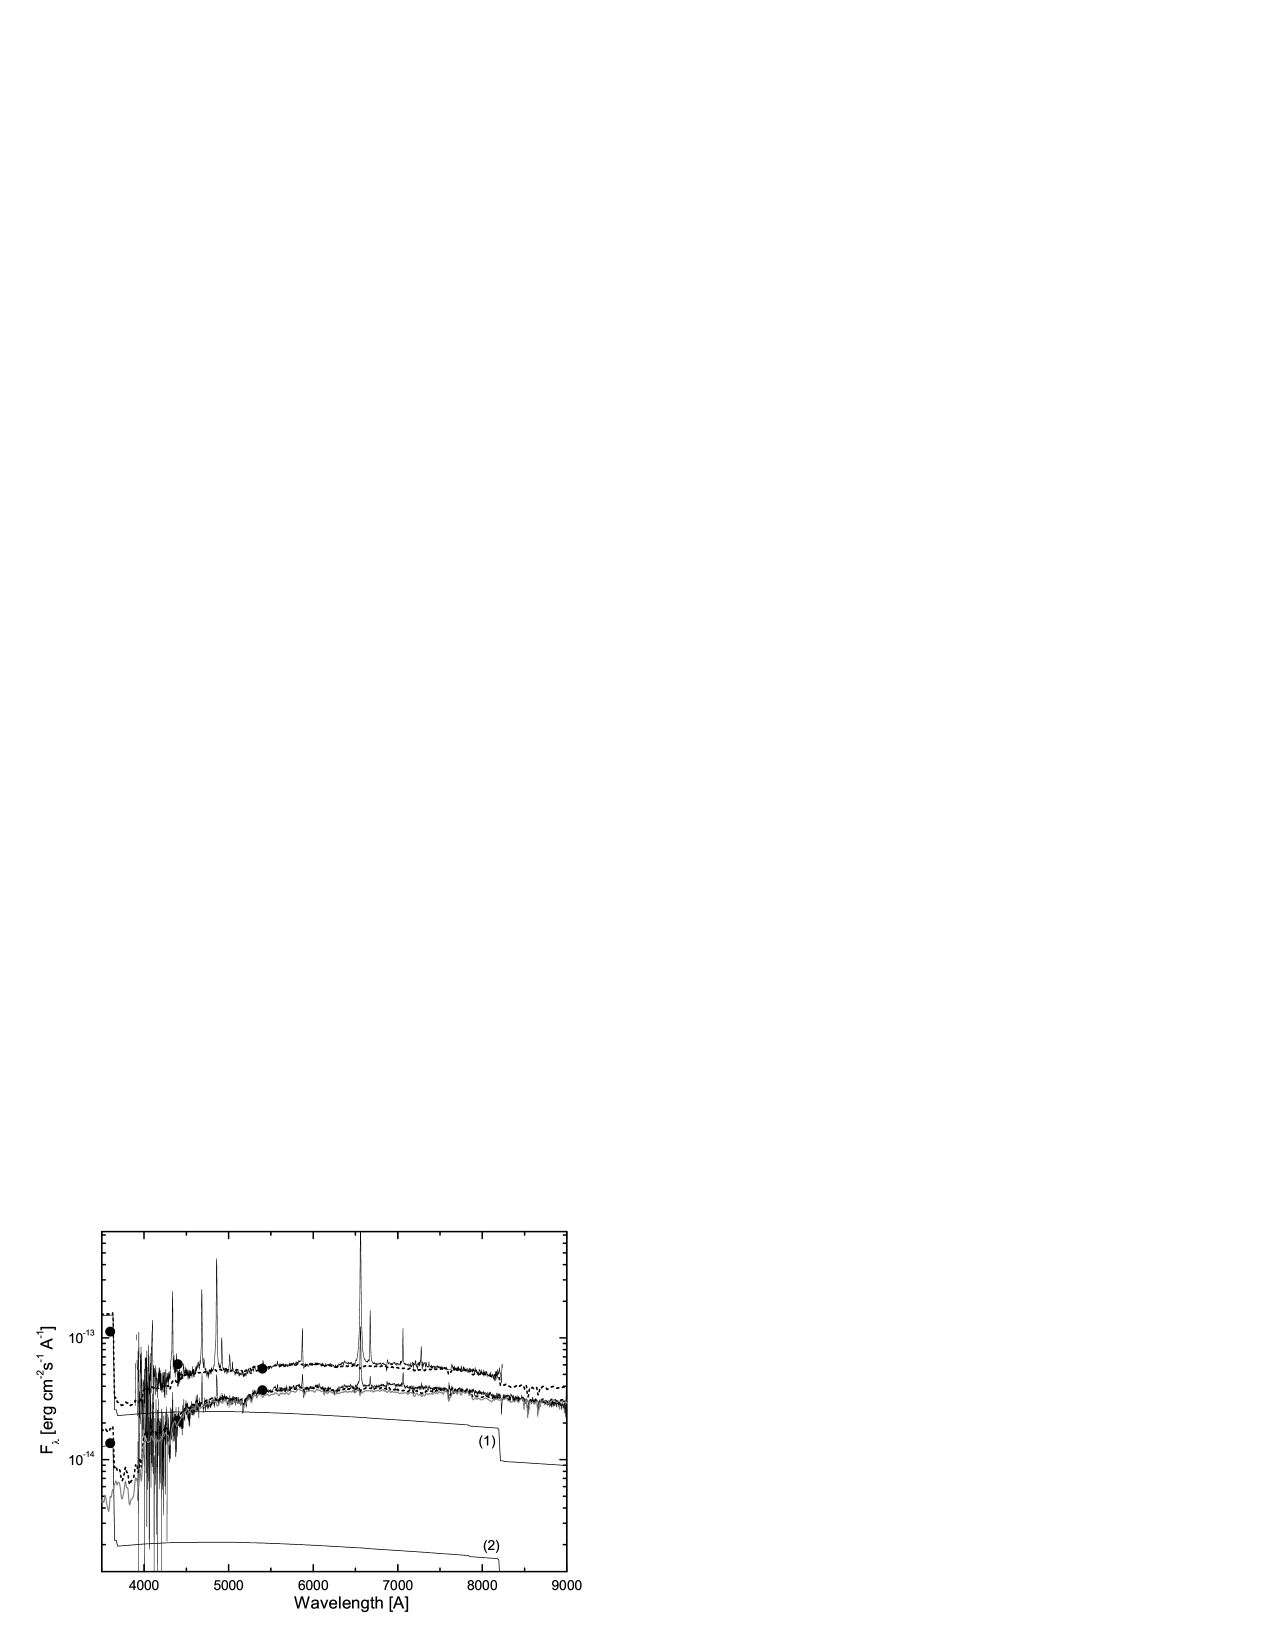
Figure 7 presents the spectra corrected for reddening with (Skopal 2005) in the 2017 outburst and in quiescence at minimum light, along with the model spectra and photometry.
The model curves are the sums of the emissions from the cool component and the photoionized nebula absorbing all Lc photons. The K3 III spectrum was taken from the library of stellar spectra by Pickles (1998).
The gas continuum was obtained as a sum of the hydrogen and helium continua with an electron temperature K. The helium abundance was assumed to be He/H=0.12.
The spectrum taken on July 11, 2018, at an orbital phase close to minimum light(), in the wavelength range 4000–9000 Å is well represented by the emission from a K3-type giant with the addition of a gas continuum with K (curve (2) in Fig. 7). The contribution of the emission from the red giant at 5500 exceeds the fraction of the gas continuum emission by a factor of 16.
In the 2017 outburst the optical continuum level for LT Del rose significantly due to an increase in the fraction of the emission from the gas component. In the wavelength range 4000–9000 Å the spectrum of LT Del taken on July 27, 2017, can be represented by a sum of the emissions from a K3 giant and a gas continuum (curve (1) in Fig. 7) with at =5500 Å.
Thus, the gas continuum level in the outburst rose by a factor of 10 compared to the quiescent state at an orbital phase close to 0.0.
Unfortunately, the spectral range accessible to us for analysis does not allow information about the emission from the hot star to be obtained.
LT Del AG Dra
LT Del belongs to a small group of yellow symbiotic systems whose cool components have a spectra type no later than K5. AG Dra is generally believed to be the prototype of this group.
AG Dra and LT Del a similar set of optical emission lines (HI, HeI, HeII). The main difference is the presence of the Raman OVI 6825 line in the spectrum of AG Dra, which is absent in the spectrum of LT Del. A study of the spectrum for AG Dra showed that this star, just as LT Del, in quiescence exhibits variations in the equivalent widths of low excitation (HI and HeI) emission lines with orbital phase and there is no such dependence for the high excitation HeII 4686 (Leedjärv et al., 2016). It was concluded that the HI and HeI lines originate in an extended gaseous volume together with the continuum emission in the near-UV and optical spectral ranges, while the HeII lines arise in a considerably smaller region near the hot star, which is also true for LT Del.
In outbursts the emission lines in the spectrum of AG Dra strengthen, but there is no unambiguous relation between their equivalent widths and and the brightness of the star. For example, during the active state of AG Dra in 2007 (event F1), when the brightness of the star rose by in the band, the H, H, HeI 6678 and HeII 4686 emission lines did not change, while the Raman OVI 6825 line weakened compared to the quiescent state. At the same time, in the 2005 outburst (event E10) with a lower amplitude all the emission lines in the spectrum of AG Dra strengthened considerably (Leedjärv et al., 2016). This points to a difference between the outbursts: the temperature of the exciting star rises in some outbursts and apparently decreases in other ones. Something of this kind is also observed in LT Del, in which the emission spectrum changed differently in its outbursts with an approximately equal amplitude in the band. In 1994 the emission line fluxes rose insignificantly, the ratio of HeII 4686 and H did not change compared to the quiescent state and, therefore, it can be assumed that the temperature of the hot star did not increase. In 2017 a more significant change in the emission spectrum was observed: a considerable strengthening of the emission lines, an increase in the intensity ratio of the HeII 4686 and H emission lines, and a rise of the nebular continuum level, suggesting an increase in the temperature of the hot source.
Conclusions
We presented the results of our spectroscopic observations of the yellow symbiotic star LT Del.
(1) An analysis of our new data, along with the previously published ones, showed that in quiescence, between the 1994 and 2017 outbursts, the change in the HI and HeI emission lines was related to the visibility conditions for the line formation regions in the binary system consisting of a hot subdwarf and a cool bright giant and is synchronized with the photometric variability of the star in the band. The intensity of HeII 4686 does not depend on the orbital phase, but it showed amonotonic change: a slight strengthening from 1995 to 2003 and then a weakening until 2015.
(2) In the pre-outburst state in 2016, at orbital phase 0.53, we took one spectrum in which all lines strengthened compared to the observations at close phases in quiescence.
(3) In 2017, during the second outburst of LT Del in the history of its studies, the emission line fluxes rose significantly. The HeI 4388, 4713, 5048 and 7281 emission lines, which have not been observed previously, have been detected for the first time in the spectrum. The intensity of HeII 4686 increased by a factor of 10, while the HI and HeI emission lines strengthened by a factor of 5–6. In the optical range the contribution of the gas continuum increased, which led to a weakening of the absorption features in the spectrum of the cool component.
(4) We estimated the temperature of the hot subdwarf by an analytical method using the intensities of HeII 4686, H and HeI 5876. We showed that, in comparison with the quiescent state with K the temperature in the 2017 outburst rose to K, while in the 1994 outburst the change in temperature was insignificant. Therefore, it can be concluded that LT Del experiences cool and hot outbursts, as does the prototype of the subclass of yellow symbiotic stars AG Dra.
(5) In 2018 the star returned to quiescence, but the emission line fluxes remained higher than those before the 2017 outburst.
(6) We modeled the optical spectrum of LT Del at minimum light and in the 2017 outburst. The optical spectral energy distribution for the system was shown to be satisfactorily fitted by a sum of the emissions from two components: a cool K3 III giant and a gas continuum with K. The gas continuum level in the outburst was found to have increased by a factor of 10 compared to the quiescent state at an orbital phase close to 0.0.
REFERENCES
-
1.
D.A. Allen, Proc. Astron. Soc. Austral. 5, 369 (1984).
-
2.
V.A. Ambartsumyan, Circ. Glav. Astron. Obs., 4, 8 (1932).
-
3.
V.P. Arkhipova, N.P. Ikonnikova, and R.I. Noskova, Astron. Lett. , 379 (1995a).
-
4.
V.P. Arkhipova, V.F. Esipov, and N.P. Ikonnikova, Astron. Lett. 21, 439 (1995b).
-
5.
V.P. Arkhipova, V.F. Esipov, N.P. Ikonnikova, G.V. Komissarova, and R.I. Noskova, Astron. Lett. 37, 377 (2011).
-
6.
I.N. Glushneva, V.T. Doroshenko, T.S. Fetisova, T.S. Khruzina, E.A. Kolotilov, L.V. Mossakovskaya, S.L. Ovchinnikov, I.B.Voloshina, VizieR Online Data Catalog III/208 (1998).
-
7.
T. Iijima, 1981, in Carling E. B., Kopal Z., eds, Photometric and Spectroscopic Binary Systems. Kluwer, Dordrecht, p. 517
-
8.
N. P. Ikonnikova, G. V. Komissarova, and V. P. Arkhipova, Astron. Lett. (2019, in press).
-
9.
J.B. Kaler, J.H. Lutz, PASP 92, 81 (1980).
-
10.
L. Leedjärv, R. Gális, L. Hric, J. Merc and M. Burmeister, MNRAS 456, 2558 (2016).
-
11.
V. Luridiana, C. Morisset, R.A. Shaw, Astron. Astrophys. 573, 42 (2015).
-
12.
J.H. Lutz, Bulletin of the American Astronomical Society, 7, 243 (1975).
-
13.
J.H. Lutz, T.E. Lutz, J.B. Kaler, D.E. Osterbrock, S.A. Gregory, Astrophys. J. 203, 481 (1976).
-
14.
J.H. Lutz, Astron. and Astrophys., 60, 93 (1977).
-
15.
U. Munari, L.M. Buson, Astron. Astrophys. 255, 158 (1992).
-
16.
U. Munari, P. Ochner, S. Dallaporta and R. Belligoli, Astronomer’s Telegram, 10361 (2017).
-
17.
S. Navarro, R. ostero, P.G. Serrano, L. Carrasco, Rev. Mex. Astrofis. 14, 339 (1987).
-
18.
C.B. Pereira, V.V. Smith, K. Cunha, Astron. J. 116, 1997, (1998).
-
19.
A.J. Pickles, PASP 110, 863 (1998).
-
20.
R.L. Porter, G.J. Ferland, P.J. Storey, M.J. Detisch, Mon. Not. Royal Astron. Soc. 425, L28 (2012).
-
21.
R.L. Porter, G.J. Ferland, P.J. Storey, M.J. Detisch, Mon. Not. Royal Astron. Soc. 433, L89 (2013).
-
22.
S.G. Sergeev and F. Heisberger, A Users Manual for SPE. Wien (1993).
-
23.
A. Skopal, Astron. and Astrophys. 440, 995 (2005).
| JD | H | HeI | HeII | HeI | H | HeI | HeI | |
|---|---|---|---|---|---|---|---|---|
| 4340 | 4388 | 4686 | 4713 | 4861 | 4921 | 5016 | ||
| 2455385 | 0.86 | 3.7 | – | 7.2 | – | 10.2 | – | – |
| 2455774 | 0.68 | 16 | – | 11.3 | – | 50.5 | 4.3 | – |
| 2455801 | 0.74 | 7.5 | – | 6.3 | – | 16.8 | 1.3 | – |
| 2456217 | 0.61 | 10.8 | – | 7.0 | – | 28.1 | 4.7 | – |
| 2456900 | 0.05 | 3.8 | – | 5.2 | – | 6.4 | – | – |
| 2457245 | 0.77 | 5.4 | – | 7.3 | – | 14.6 | – | – |
| 2457606 | 0.53 | 28.1 | 3.9 | 18.1 | 1.9 | 91.7 | 14.1 | 5.2 |
| 2457926 | 0.20 | 60.1 | 5.8 | 110.0 | 4.3 | 157.0 | 18.0 | 10.7 |
| 2457935 | 0.22 | 82.5 | 8.1 | 121.0 | 7.1 | 202.0 | 26.1 | 13.3 |
| 2457960 | 0.27 | 74.1 | 7.3 | 89.8 | 4.6 | 214.0 | 20.5 | 9.6 |
| 2458012 | 0.38 | 65.6 | – | 44.2 | 4.1 | 170.0 | 12.5 | 5.2 |
| 2458019 | 0.40 | 51.5 | – | 37.6 | 3.1 | 155.0 | 9.7 | 4.7 |
| 2458311 | 0.01 | – | – | 7.2 | – | 8.1 | – | – |
| 2458374 | 0.14 | – | – | 12.6 | – | 30.2 | 4.7 | – |
| 2458379 | 0.15 | – | – | 18.5 | – | 39.4 | 5.3 | – |
| 2458400 | 0.20 | 21.0 | – | 13.0 | – | 38.0 | 4.8 | 2.1 |
| 2458408 | 0.21 | – | – | 10.2 | – | 29.5 | 4.2 | 2.1 |
| JD | HeI | HeII | HeI | H | HeI | HeI | HeI | |
| 5048 | 5411 | 5876 | 6563 | 6678 | 7065 | 7281 | ||
| 2455385 | 0.86 | – | – | 4.5 | 84.3 | 4.5 | 5.3 | – |
| 2455774 | 0.68 | – | – | 6.7 | 150 | 9.7 | 5.8 | – |
| 2455801 | 0.74 | – | – | 2.3 | 89.3 | 5.5 | 3.1 | – |
| 2456217 | 0.61 | – | – | 7.2 | 154 | 13.8 | 6.2 | – |
| 2456900 | 0.05 | – | – | 2.6 | 47.8 | 4.3 | 3.3 | – |
| 2457245 | 0.77 | – | – | 3.7 | 77.0 | – | 3.4 | – |
| 2457606 | 0.53 | – | – | 18.8 | 376.0 | 37.6 | 20.0 | 12.1 |
| 2457926 | 0.20 | – | 4.2 | 27.1 | 567.0 | 43.9 | 23.6 | 10.0 |
| 2457935 | 0.22 | 6.4 | 7.7 | 31.4 | 676.0 | 53.9 | 28.3 | 12.5 |
| 2457960 | 0.27 | 3.4 | 4.4 | 34.8 | 786.0 | 54.2 | 31.4 | 11.8 |
| 2458012 | 0.38 | 1.8 | 2.9 | 31.8 | 681.0 | 39.6 | 32.5 | 11.6 |
| 2458019 | 0.40 | – | 2.4 | – | 662.0 | 35.2 | 30.1 | 8.4 |
| 2458311 | 0.01 | – | – | 4.7 | 56.1 | 4.0 | 5.9 | – |
| 2458374 | 0.14 | – | – | 5.1 | 109.8 | 7.2 | 3.3 | – |
| 2458379 | 0.15 | – | – | 7.2 | 150.0 | 10.0 | 4.7 | – |
| 2458400 | 0.20 | – | – | 6.7 | 181.0 | 13.2 | 7.2 | 3.2 |
| 2458408 | 0.21 | – | – | 7.1 | 160.7 | 10.6 | 6.6 | – |
| JD | H | HeI | HeII | HeI | H | HeI | HeI | |
|---|---|---|---|---|---|---|---|---|
| 4340 | 4388 | 4686 | 4713 | 4861 | 4921 | 5016 | ||
| 2455385 | 0.86 | 4.4 | – | 6.4 | – | 7.4 | – | – |
| 2455774 | 0.68 | 8.7 | – | 5.5 | – | 15. | 2. | – |
| 2455801 | 0.74 | 7.8 | – | 5.2 | – | 12. | 1.2 | – |
| 2456135 | 0.44 | 15.9 | - | 5.8 | – | 25.6 | 4.8 | 2.5 |
| 2456217 | 0.61 | 9.9 | – | 5.3 | – | 18.2 | 3.1 | 1.9 |
| 2456900 | 0.05 | 3.6 | – | 4.3 | – | 5.5 | – | – |
| 2457245 | 0.77 | 6.9 | – | 5.0 | – | 9.2 | 0.8 | – |
| 2457606 | 0.53 | 27.7 | 1.6 | 13.2 | 1.2 | 62.2 | 9.7 | 3.4 |
| 2457926 | 0.20 | 19.9 | 0.8 | 34.0 | 1.3 | 46.1 | 5.2 | 3.3 |
| 2457935 | 0.22 | 24.8 | 0.4 | 30.0 | 1.1 | 52.3 | 6.7 | 3.2 |
| 2457960 | 0.27 | 27.5 | 1.1 | 30.0 | 1.8 | 71.3 | 7.1 | 4.1 |
| 2458012 | 0.38 | 47.3 | – | 25.5 | 2.6 | 90.3 | 7.1 | 3.1 |
| 2458019 | 0.40 | 32.4 | – | 20.8 | 1.6 | 71.4 | 5.2 | 2.3 |
| 2458050 | 0.46 | 28.4 | – | 13.1 | – | 62.3 | 5.7 | 3.0 |
| 2458311 | 0.01 | – | – | 6.9 | – | 6.7 | – | – |
| 2458337 | 0.07 | – | – | 5.9 | – | 8.4 | – | – |
| 2458374 | 0.14 | – | – | 7.8 | – | 14.9 | – | – |
| 2458379 | 0.15 | 7.7 | – | 7.7 | – | 15.1 | 1.9 | – |
| 2458400 | 0.20 | 11.2 | – | 6.6 | – | 16.8 | 1.8 | 0.9 |
| 2458408 | 0.21 | – | – | 7.8 | – | 19.9 | 2.9 | 1.1 |
| JD | HeI | HeII | HeI | H | HeI | HeI | HeI | |
| 5048 | 5411 | 5876 | 6563 | 6678 | 7065 | 7281 | ||
| 2455385 | 0.86 | – | – | 2.1 | 28.5 | 1.6 | 1.6 | – |
| 2455774 | 0.68 | – | – | 2.0 | 49.2 | 2.9 | 1.8 | – |
| 2455801 | 0.74 | – | – | 1.8 | 41.0 | 2.4 | 1.2 | – |
| 2456135 | 0.44 | – | – | 5.1 | 73.4 | 7.7 | 3.9 | – |
| 2456217 | 0.61 | – | – | 1.8 | 47.4 | 4.3 | 2.2 | – |
| 2456900 | 0.05 | – | – | 1.1 | 19.2 | 1.5 | 1.2 | – |
| 2457245 | 0.77 | – | – | 1.4 | 29.0 | 1.8 | 1.2 | – |
| 2457606 | 0.53 | – | – | 8.6 | 164.0 | 11.7 | 7.6 | 3.0 |
| 2457926 | 0.20 | 1.6 | 1.7 | 6.1 | 124.0 | 10.4 | 4.4 | 1.0 |
| 2457935 | 0.22 | 1.5 | 2.2 | 6.8 | 134.0 | 11.6 | 5.6 | 2.6 |
| 2457960 | 0.27 | 1.5 | 1.3 | 8.8 | 176.0 | 12.3 | 7.1 | 2.7 |
| 2458012 | 0.38 | 0.9 | 1.5 | 11.4 | 249.0 | 14.1 | 11.2 | 3.2 |
| 2458019 | 0.40 | – | 1.0 | – | 226.0 | 12.7 | 10.5 | 2.8 |
| 2458050 | 0.46 | – | – | 6.7 | 173.0 | 10.3 | 7.8 | 2.2 |
| 2458311 | 0.01 | – | – | 2.3 | 24.0 | 1.6 | 2.2 | – |
| 2458337 | 0.07 | – | – | 0.8 | 25.6 | 1.6 | 1.0 | – |
| 2458374 | 0.14 | – | – | 1.6 | 40.9 | 2.6 | 1.2 | – |
| 2458379 | 0.15 | – | – | 1.6 | 45.4 | 3.0 | 1.5 | – |
| 2458400 | 0.20 | – | – | 2.4 | 56.4 | 4.4 | 2.3 | 0.7 |
| 2458408 | 0.21 | – | – | 2.7 | 56.5 | 3.6 | 2.92 | – |