AGB dust and gas ejecta in extremely metal-poor environments
Abstract
We present asymptotic giant branch (AGB) models of metallicity and , with the aim of understanding how the gas enrichment and the dust production change in very metal-poor environments and to assess the general contribution of AGB stars to the cosmic dust yield. The stellar yields and the dust produced are determined by the change in the surface chemical composition, with a transition occurring at . Stars of mass reach the carbon stage and produce carbon dust, whereas their higher mass counterparts produce mainly silicates and alumina dust; in both cases the amount of dust manufactured decreases towards lower metallicities. The models show a complex and interesting behaviour on this side, because the efficient destruction of the surface oxygen favours the achievement of the C-star stage, independently of the initial mass. The present results might indicate that the contribution from this class of stars to the overall dust enrichment in metal-poor environments is negligible at redshifts .
keywords:
Stars: abundances – Stars: AGB and post-AGB1 Introduction
The stars with initial mass in the range after the core He-burning phase evolve through the asymptotic giant branch (the thermally-pulsing phase, hereafter mentioned as AGB, Iben 1981). Despite this evolutionary phase being only a few percent of the whole stellar life, it is of great importance, because it is during the AGB evolution that the stars lose the majority of their mass, thus contributing to the pollution of the interstellar medium.
Among others, understanding the gas pollution from AGB stars is crucial to investigate the chemical evolution of the Milky Way (e.g. Romano et al. 2010, Kobayashi et al. 2011, Ginolfi et al. 2018), Local Group galaxies (e.g. Schneider et al. 2014, Vincenzo et al. 2016), the interstellar medium of galaxies (e.g. Romano et al. 2017), up to very high redshift (e.g. Mancini et al. 2015), the formation of multiple populations in globular clusters (e.g. D’Ercole et al. 2008). For example, the importance of studying the yields of the CNO elements from AGB stars has been recently outlined by Vincenzo & Kobayashi (2018a), in a paper focused on the reconstruction of the star formation history (SFH) of galaxies, based on the CNO trends observed in the interstellar medium. On the other hand, Vincenzo & Kobayashi (2018b) showed the importance of taking into account all the stellar sites of CNO nucleosynthesis, including AGB stars, to perform detailed chemo-dynamical simulations on cosmological scales, in which the NO vs OH trends are used to reconstruct the evolution of galaxies with redshift.
A further reason for the interest towards AGB stars is that they have been proposed as important dust manufacturers, owing to the thermodynamic conditions in their wind, which are extremely favourable to allow condensation of gaseous molecules into solid particles (Gail & Sedlmayr, 1999). However, the role played by AGB stars as cosmic dust producers has still to be fully understood: contrary to early investigations, more recent studies outlined an important contributions from AGBs event at high redshifts (Valiante et al., 2009, 2011, 2017). The determination of the amount of dust produced by AGB stars and the corresponding size distribution function is required to calculate the extinction properties associated with dust grains, which is a fundamental information to interpret the optical-near-infrared properties of high-z quasars and gamma-ray burst spectra (Maiolino et al. 2004; Gallerani et al. 2010).
In the recent past, the modelling of the AGB phase has made significant steps forwards, with the inclusion of the description of the dust formation mechanism within the stellar evolution framework (Ventura et al., 2012a, b; Nanni et al., 2013, 2014). These models have been extensively tested against near- to mid-infrared observations, primarily obtained with Spitzer, of AGB stars in the Magellanic Clouds (Dell’Agli et al., 2014, 2015a, 2015b; Nanni et al., 2016, 2018) and in Local Group galaxies (Dell’Agli et al., 2016, 2018a, 2019). The results from the Gaia data release 2 allowed the comparison with AGB stars in the LMC (Nanni, 2019). These studies will receive a strong boost after the launch of the James Webb Space Telescope, which will provide extensive infrared (IR) data for the AGB population of all the galaxies in the Local Group, and possibly beyond.
The above mentioned studies required use of AGB models, including the description of dust formation, with metallicities ranging to to the metallicity typical of LMC stars, i.e. . Solar and supersolar models are also available in the literature (Nanni et al., 2013, 2014; Dell’Agli et al., 2017; Ventura et al., 2018; Zhukovska & Henning, 2013).
In this work, we focus our attention towards the low-metallicity tail and present AGB models, of initial mass in the range , down to the metallicity . We calculate the gas yields produced by these stars during the AGB life, making them available for the studies focused on galaxy evolution, which require the knowledge of the contribution from low-metallicity AGB stars to the chemical enrichment, particularly for what attains carbon and nitrogen.
Furthermore, we compute the dust manufactured by these stars during the AGB life. In a cosmological context, our goal is to address the fundamental issue of the contribution of AGB stars to the dust enrichment in the early Universe, something that requires the quantification of the dust produced by AGB stars in very metal-poor environments. Our aim is to find some trends with metallicity, down to the point where a straight extrapolation of the results is sufficient to infer how dust formation works in metal-poor environments.
The paper is structured as follows: in section 2 we describe the codes used to model stellar evolution and dust formation; a detailed discussion of the main physical and chemical properties of the stars of metallicity and are given in section 3; sections 4 and 5 provide a general description of the behaviour of, respectively, the variation of the surface chemical composition and of dust production, in AGB stars of metallicity ; in section 6 we discuss the contribution of metal-poor AGB stars to the cosmic dust yield; the conclusions are given in section 7.
2 Stellar evolution and dust formation modelling
The evolutionary sequences used in the present analysis were started from the pre-main sequence and followed until the final AGB stages, when the convective envelope was almost entirely consumed.
2.1 Initial chemical composition
For this study we calculated new evolutionary sequences, of metallicity , and mass . These models complete the higher mass models of the same metallicity by Di Criscienzo et al. (2013). We also calculated ex novo a full set of models of metallicity .
To discuss the trend of the chemical and dust properties with the metallicity, we considered in the present work models already published by our group. For the metallicity we used the models published in Ventura et al. (2014b); for we relied on the results by Ventura et al. (2016a) (the dust was calculated for the present scope). In the newly calculated and sequences and in the and models we used an enhanced mixture with Fe, taken from Grevesse & Sauval (1998). We also discuss models, published in Ventura et al. (2014a); because this study is focused on stars in the cluster 47 Tuc, the enhancement considered is Fe.
2.2 Stellar evolution modelling
Stellar evolution models were calculated by means of the code ATON. An exhaustive discussion of the numerical structure of the code, with all the micro-physics input used, can be found in Ventura et al. (1998); the latest updates are given in Ventura & D’Antona (2009). For what concerns the choices regarding the macro-physics adopted, we discuss here the input most relevant for the present work:
-
1.
Convection. The convective instability was treated by means of the Full Spectrum of Turbulence (hereafter FST) model for turbulent convection (Canuto & Mazzitelli, 1991). This choice is particularly relevant for the mass domain , because use of the FST description leads to a thermodynamical stratification of the envelope extremely favourable to the ignition of Hot Bottom Burning (HBB), which consists in the activation of a proton-capture nucleosynthesis at the base of the convective envelope (Ventura & D’Antona, 2005).
In nuclearly active regions unstable to convection, we used a diffusive-like description, where nuclear burning and mixing of chemical are self-consistently coupled. The set of equations used were taken by Cloutman & Eoll (1976). Convective velocities are allowed to decay exponentially from the border of convective core during the H- and He-burning phases, with an e-folding distance of ; during the TP-AGB phase we consider that the velocity of the convective eddies in the shell which develops at the ignition of each thermal pulse (hereafter TP) or within the convective envelope decay within radiatively stable regions with an e-folding distance of .
- 2.
-
3.
Radiative opacities. The radiative opacities for temperatures above K were calculated using the OPAL online tool (Iglesias & Rogers 1996); for smaller temperatures we used the AESOPUS tool described in Marigo & Aringer (2009). This choice allows to account for the increase in the opacity associated with the change in the surface chemistry determined by inwards penetration of the convective envelope.
2.3 The description of dust formation
To describe dust production we apply the description of the wind of AGB stars proposed by the Heidelberg group (Ferrarotti & Gail, 2001, 2002, 2006), which allows to determine the size of the solid particles formed in the circumstellar envelope, for the various dust species considered. This method was applied in the past works on this argument by our group (Ventura et al., 2012a, b; Di Criscienzo et al., 2013; Ventura et al., 2014b; Dell’Agli et al., 2017; Ventura et al., 2018) and by the Padua team (Nanni et al., 2013, 2014, 2016, 2018).
The choice of the dust species considered is based on stability arguments of the different compounds (Sharp & Huebner, 1990). Because the CO molecule is extremely stable, it is assumed that in C-rich environments no oxygen is left to form dust, and that the species formed are silicon carbide (SiC) and amorphous carbon. Conversely, in oxygen-rich envelopes, no carbon-bearing dust grains can form, thus leaving space for the formation of alumina dust (Al2O3) and silicates only. The latter species is split into the three components olivine (Mg2SiO4), pyroxene (MgSiO3) and quartz (SiO2); olivine is the most stable, thus we will often refer to it in the following for a general discussion on the behaviour of silicates.
The largest quantities of a given dust species is determined by the surface mass fraction of the so called key-species, defined as the least abundant among the chemical elements involved in the formation reaction (Ferrarotti & Gail, 2006). This is silicon for silicon carbide and silicates, aluminium for alumina dust and the excess of carbon with respect to oxygen for amorphous carbon.
To calculate the dust produced by the stars during their life, we consider between 20 and 30 points during each interpulse phase, chosen in a way such that the main physical quantities of the star do not vary meaningfully. We model dust formation on the basis of the corresponding values of mass, mass loss rate, luminosity, effective temperature and the surface chemical composition. This procedure, coupled with the known gas mass loss rate, allows the computation of the dust production rate during different evolutionary phases. The integration of the current dust production rate over the whole AGB life allows the calculation of the total dust mass produced by a star during the AGB evolution.
| (Myr) | (kyr) | NTP | Y | X(C) | X(N) | X(O) | CO | ||||
| 1.0 | 5100 | 1000 | 6 | 5.4 | 0.50 | 59 | 0.272 | 5.5e-3 | 1.7e-5 | 3.8e-4 | 19.3 |
| 1.1 | 3600 | 1550 | 8 | 7.5 | 0.54 | 62 | 0.281 | 5.6e-3 | 2.0e-5 | 5.0e-4 | 14.9 |
| 1.25 | 2300 | 1600 | 11 | 9.2 | 0.55 | 70 | 0.285 | 9.7e-3 | 4.3e-5 | 8.8e-4 | 14.7 |
| 1.5 | 1310 | 1700 | 15 | 11 | 0.57 | 59 | 0.289 | 1.5e-2 | 4.7e-5 | 1.3e-3 | 15.4 |
| 2.0 | 575 | 1500 | 29 | 16 | 0.61 | 76 | 0.296 | 1.8e-2 | 4.9e-5 | 2.3e-3 | 10.4 |
| 2.5 | 340 | 650 | 27 | 26 | 0.72 | 61 | 0.275 | 6.2e-3 | 1.2e-2 | 4.7e-3 | 1.8 |
| 3.0 | 230 | 320 | 28 | 29 | 0.81 | 34 | 0.285 | 1.4e-3 | 3.5e-3 | 8.6e-4 | 2.2 |
| 3.5 | 167 | 270 | 35 | 38 | 0.83 | 26 | 0.310 | 1.3e-3 | 3.0e-3 | 6.3e-4 | 2.8 |
| 4.0 | 127 | 190 | 41 | 43 | 0.86 | 25 | 0.327 | 1.0e-3 | 2.3e-3 | 4.4e-4 | 3.0 |
| 4.5 | 101 | 203 | 53 | 52 | 0.90 | 18 | 0.343 | 7.9e-4 | 1.5e-3 | 3.6e-4 | 2.9 |
| 5.0 | 82 | 210 | 103 | 95 | 0.94 | 72 | 0.369 | 5.1e-4 | 1.0e-3 | 3.4e-4 | 2.0 |
| 5.5 | 68 | 230 | 112 | 99 | 0.98 | 86 | 0.383 | 4.0e-6 | 1.8e-4 | 1.0e-6 | 5.3 |
| 6.0 | 58 | 180 | 121 | 120 | 1.04 | 88 | 0.391 | 3.0e-6 | 6.8e-5 | 3.0e-7 | 13.3 |
| 1.0 | 5100 | 1300 | 6 | 5.4 | 0.53 | 23 | 0.275 | 1.5e-3 | 3.0e-5 | 2.9e-4 | 6.9 |
| 1.1 | 3600 | 1350 | 6 | 6.7 | 0.54 | 52 | 0.278 | 3.1e-3 | 2.6e-5 | 5.6e-4 | 7.4 |
| 1.3 | 2050 | 1600 | 9 | 7.8 | 0.54 | 56 | 0.279 | 5.3e-3 | 2.5e-5 | 5.6e-4 | 12.6 |
| 1.5 | 1320 | 1350 | 12 | 9.7 | 0.57 | 59 | 0.282 | 1.1e-2 | 3.3e-5 | 1.3e-3 | 11.3 |
| 1.75 | 860 | 1100 | 14 | 12 | 0.60 | 73 | 0.283 | 1.1e-2 | 5.0e-5 | 1.5e-3 | 9.8 |
| 2.0 | 610 | 1700 | 29 | 16 | 0.60 | 77 | 0.290 | 1.2e-2 | 6.4e-5 | 2.2e-3 | 7.3 |
| 2.5 | 360 | 740 | 31 | 26 | 0.72 | 55 | 0.274 | 2.4e-3 | 1.6e-2 | 4.4e-3 | 0.7 |
| 3.0 | 240 | 320 | 28 | 27 | 0.80 | 29 | 0.277 | 1.2e-3 | 3.6e-3 | 8.0e-4 | 2.0 |
| 3.5 | 174 | 262 | 35 | 35 | 0.83 | 15 | 0.307 | 9.0e-4 | 2.9e-3 | 7.3e-4 | 1.6 |
| 4.0 | 132 | 200 | 42 | 44 | 0.86 | 5 | 0.328 | 8.0e-4 | 1.9e-3 | 4.9e-4 | 2.2 |
| 4.5 | 105 | 170 | 47 | 52 | 0.89 | 23 | 0.341 | 1.8e-4 | 1.7e-3 | 1.4e-4 | 1.7 |
| 5.0 | 80 | 123 | 63 | 58 | 0.94 | 50 | 0.353 | 1.1e-4 | 7.2e-4 | 1.1e-4 | 1.3 |
| 5.5 | 69 | 85 | 54 | 72 | 0.99 | 67 | 0.360 | 7.0e-5 | 4.9e-4 | 1.7e-5 | 5.5 |
| 6.0 | 59 | 61 | 46 | 94 | 1.03 | 75 | 0.367 | 3.6e-5 | 2.0e-4 | 7.2e-6 | 6.7 |
| 6.5 | 51 | 54 | 28 | 112 | 1.16 | 43 | 0.367 | 4.0e-6 | 1.9e-4 | 7.8e-7 | 6.8 |
| 7.0 | 44 | 19 | 23 | 135 | 1.22 | 40 | 0.370 | 9.0e-6 | 2.3e-4 | 3.6e-6 | 3.3 |
| 7.5 | 40 | 11 | 19 | 175 | 1.34 | 8 | 0.369 | 1.6e-5 | 2.9e-4 | 6.0e-6 | 3.5 |

3 The AGB evolution of low-metallicity stars
The most relevant physical phenomena taking place during the AGB evolution are thoroughly described in the reviews by Herwig (2005) and Karakas & Lattanzio (2014), where the interested reader can find an exhaustive discussion on the mechanisms potentially able to alter the surface chemical composition, namely third dregde-up (TDU) and HBB.
TDU takes place after each thermal pulse, if the surface convection, during the inwards penetration, reaches regions previously touched by helium burning (Iben, 1974, 1975; Lattanzio, 1989): the consequence of TDU is the progressive enrichment in carbon of the envelope, which eventually favours the conversion of M stars to carbon stars, with a surface CO above unity.
HBB occurs in AGB stars evolving on CO cores of mass higher than and consists into the ignition of p-capture nuclear activity in the innermost regions of the stellar envelope (Renzini & Voli, 1981; Blöcker & Schönberner, 1991); the activation of HBB provokes a significant modification of the surface chemical composition, which will reflect the equilibria of the p-capture nucleosynthesis occurring at the base of the external mantle. HBB is experienced by stars of initial mass above , the threshold value being smaller the lower the metallicity (Ventura et al., 2013).
In the following we discuss the most important physical and chemical properties of low-metallicity AGB stars, that can be understood based on the efficiency of TDU and HBB.
3.1 The role of mass in the determination of the physical and chemical properties
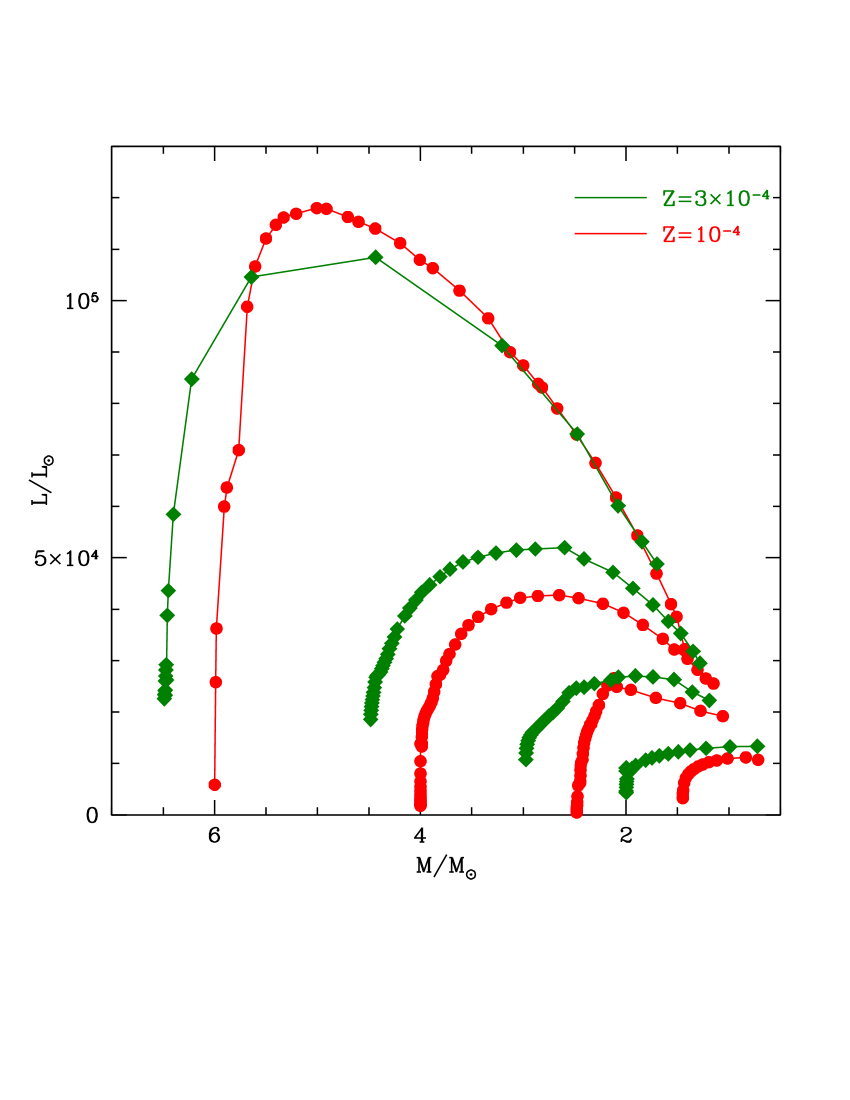
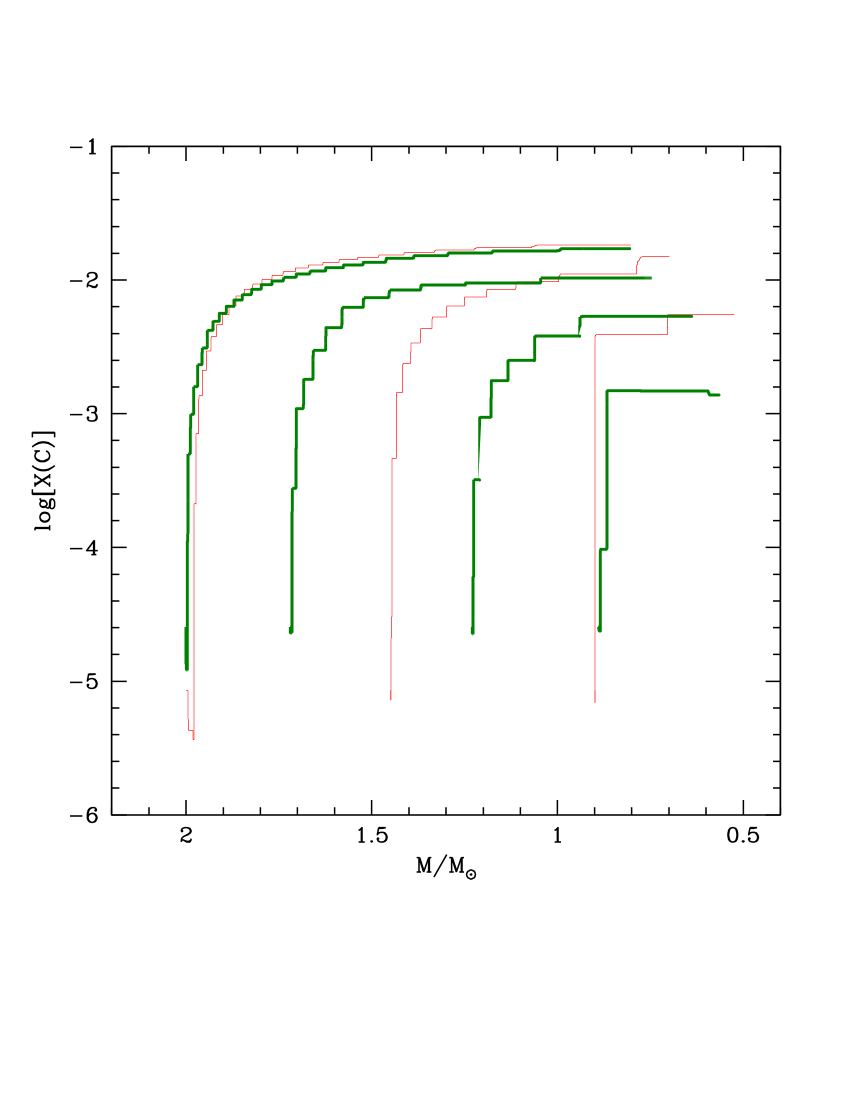
The main properties of the models calculated for the present investigation are reported in table LABEL:tabmod. Fig. 1 shows the evolution of the luminosity and of the surface mass fraction of the CNO elements for some values of the initial mass, chosen to cover the entire range of masses of the stars undergoing the AGB evolution. Note that we report the current mass of the star on the abscissa, which allows to show all the models in the same plane (the different evolutionary times prevent doing this using the AGB time as abscissa) and, more important, to have an idea of what is going on during the phase when most of the mass is lost.
We note in the top, left panel of Fig. 1 the large sensitivity of the luminosity of the star to the initial mass. Metallicity is also playing a role here, lower-Z stars reaching higher luminosities. In low-mass stars (below ) the luminosity increases during the whole AGB phase, owing to the gradual increase in the core mass. Conversely, in higher mass models, the overall energy release increases during the initial AGB phases, then it starts to decline, after a significant fraction of the envelope is lost via stellar wind; this well known behaviour of massive AGB stars (see e.g. Ventura et al. 2002) is motivated by the decrease in the gravitational energy available, which is required to restart CNO burning in the shell after the temporary extinction of that nuclear channel, associated to each TP event.
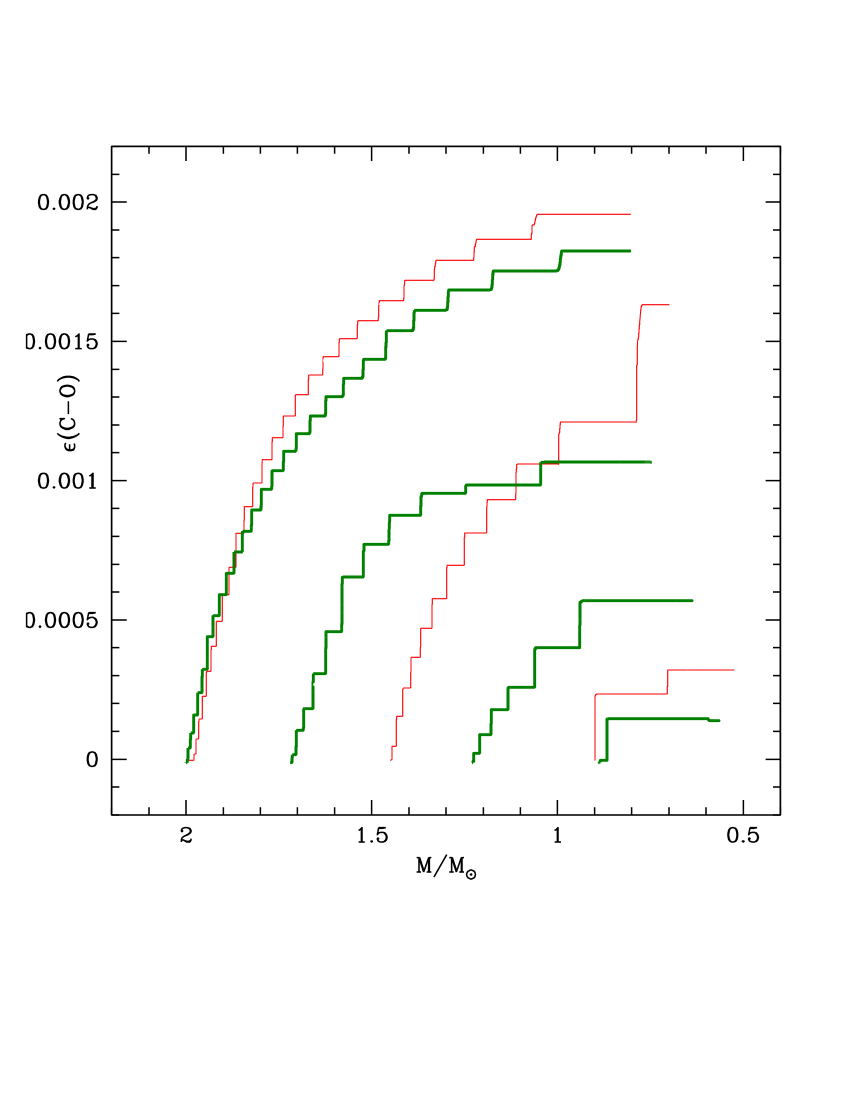
The panels in the right of Fig. 1 show the main feature regarding the evolution of low-mass stars, namely the gradual increase in the surface carbon, due to repeated TDU episodes. Once the surface carbon exceeds oxygen, the star becomes a C-star. The panel in the top reports the variation of the surface carbon mass fraction, whereas in the bottom, right panel we show CO, i.e. the carbon excess with respect to oxygen (in number density), relatively to the number density of hydrogen atoms. The latter quantity is the key-factor determining the amount of carbonaceous dust that can be formed in C-rich environments: we will return to this point in the following sections.
In the metal-poor stars discussed here the C-star stage is reached after only a few TPs, because the oxygen in the star is very low: the C-star phase is of the overall AGB evolution for the metallicity, and for the case (see table 1).
The final carbon abundance and CO increase with the initial mass of the star, because the higher the mass the higher the number of TPs experienced before the envelope is lost. The amount of carbon accumulated in the envelope is not significantly sensitive to the metallicity because the carbon convected to the surface is of primary origin, being produced by nucleosynthesis activated in the He-rich buffer at the ignition of each TP. The gradual increase in the surface carbon has important consequences on the evolution of C-stars: the formation of CN molecules determines an increase in the opacity of the external regions (Marigo, 2002) that favours the expansion of the envelope, a rise in the mass loss rate, thus a faster consumption of the whole external mantle (Ventura & Marigo, 2009, 2010).
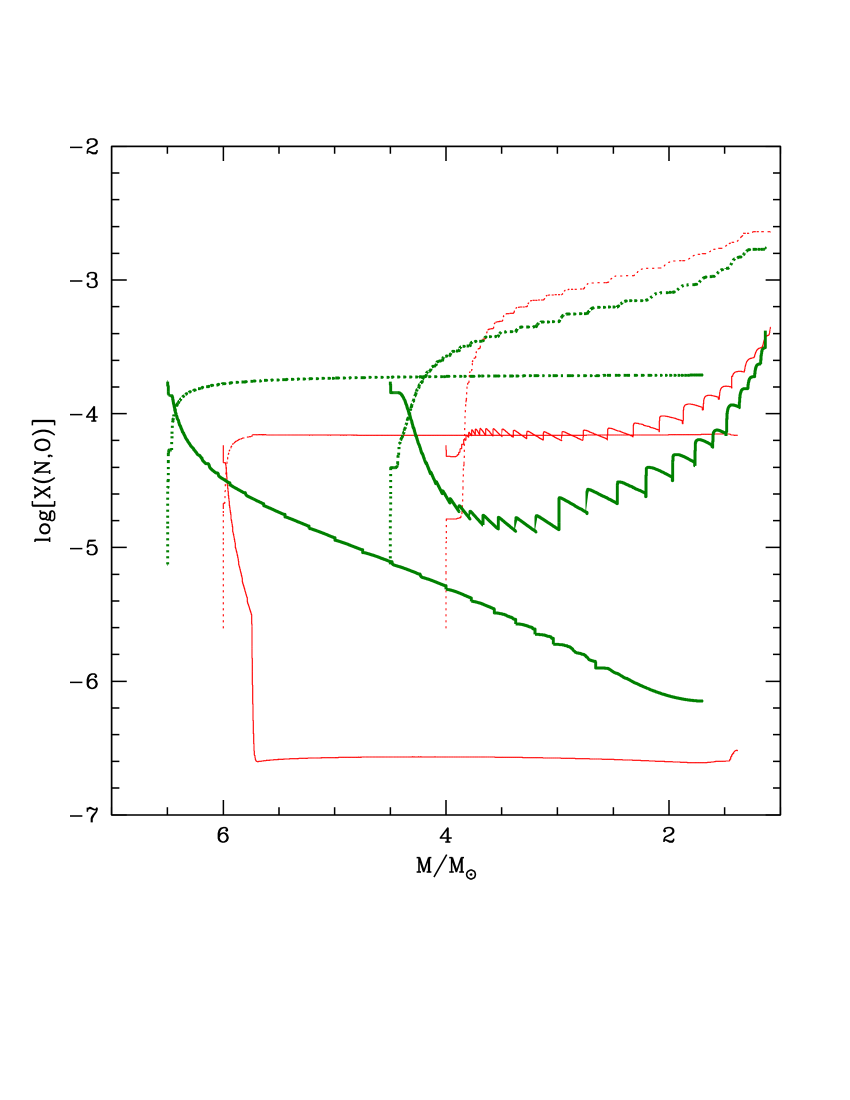
The variation of the surface chemical composition of the stars experiencing HBB, which, for the low metallicities considered here, occurs for initial masses above , is shown in the bottom, left panel of Fig. 1. For clarity reasons we show only the mass fractions of N and O for a few selected masses, which represent: a) stars with core mass close to the threshold limit required to core collapse, here represented by the models of initial mass () and (); b) lower mass stars, which experience a weaker HBB, indicated in the figure by the tracks corresponding to the , and , models.
The chemical evolution of massive AGBs (case a above) is mostly determined by HBB, which causes a depletion in the oxygen content and a parallel increase in the surface nitrogen. In the case oxygen is severely destroyed in the envelope since the very first TPs, thus the stars reach very soon the condition, evolving as C-stars for the majority of the AGB life.
In stars of lower mass (case b) the surface chemistry is determined by the balance between HBB and TDU; the effects of the latter mechanism can be seen in the sudden increase in the surface oxygen abundance, which takes place after each TP. In these stars the strength of HBB is lower than in their higher mass counterparts: the C-star stage is experienced in the initial AGB phases, before the ignition of HBB favours the destruction of the surface carbon, and in the very final evolutionary stages, when HBB is turned off, and some carbon is dredged-up to the surface.
All the stars experiencing HBB manufacture large quantities of nitrogen; however, the final N is higher in lower mass stars, because when TDU is effective, not only the initial carbon in the star is available to be turned into N via HBB, but also the carbon convected to the surface via TDU.
3.2 The evolution of the surface chemistry in metal-poor AGB stars
The relative importance of TDU and HBB is sensitive to the metallicity of the star, which affects the internal temperatures, the thermodynamical stratification of the external mantle and the initial chemical composition.
Regarding the strength of HBB, we show in the top, left panel of Fig. 2 the values of the temperature at the base of the envelope, , of stars of different mass and metallicity111The temperature at the base of the envelope is not constant during the AGB phase. The quantities shown here refer to the phase during which most of mass loss occurs, during which is approximately constant.; only the stars which experience HBB are indicated. These results confirm previous findings, that the strength of HBB is higher the lower is Z (Ventura et al., 2013).
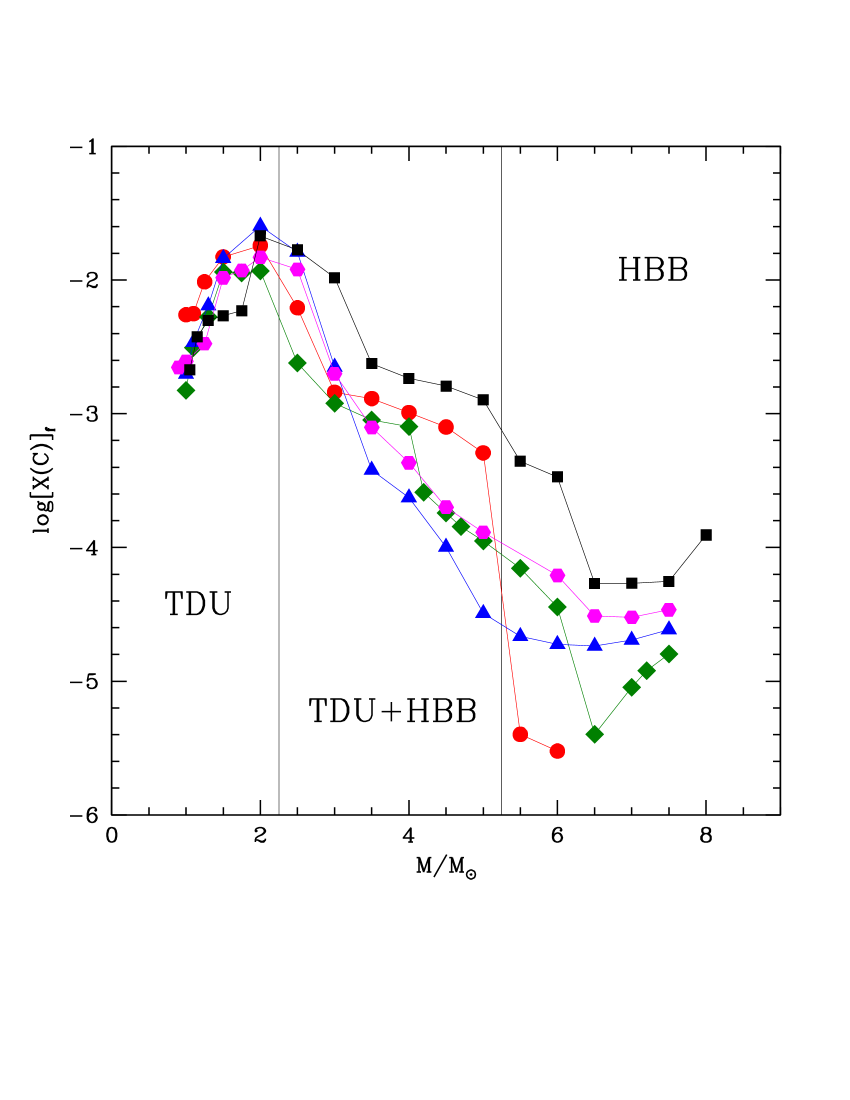
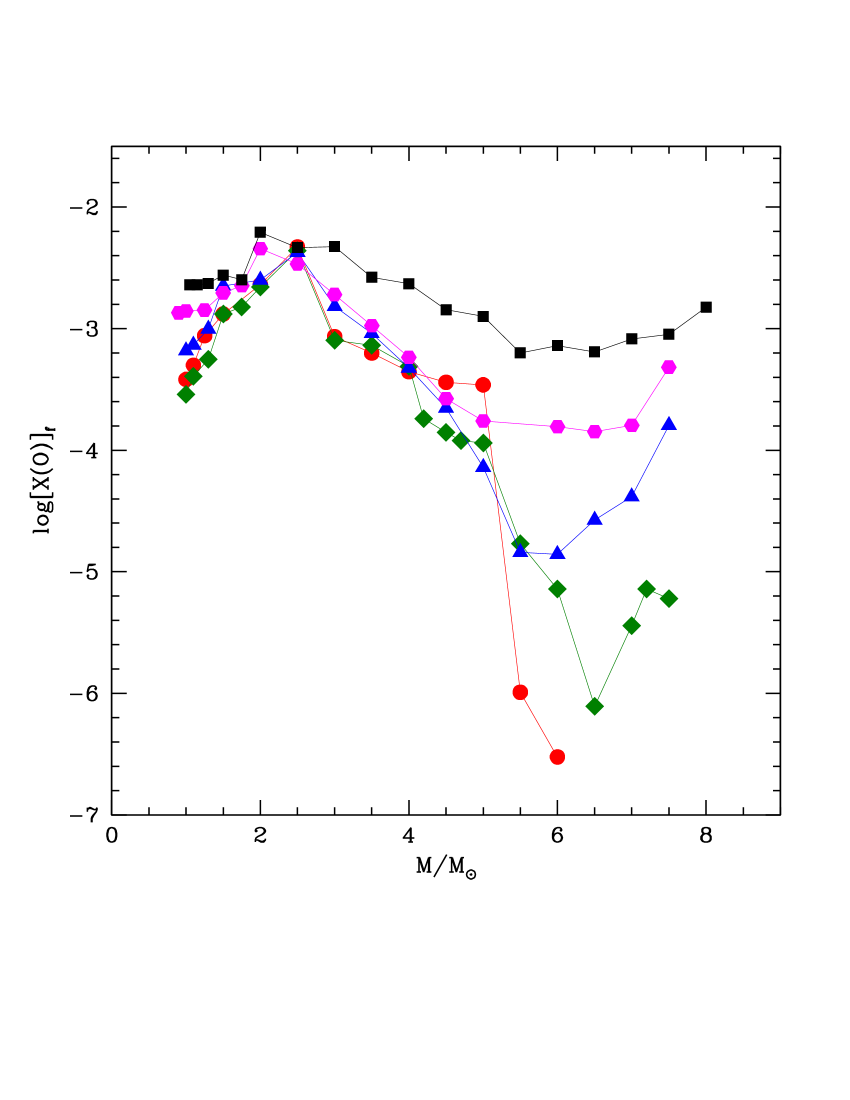
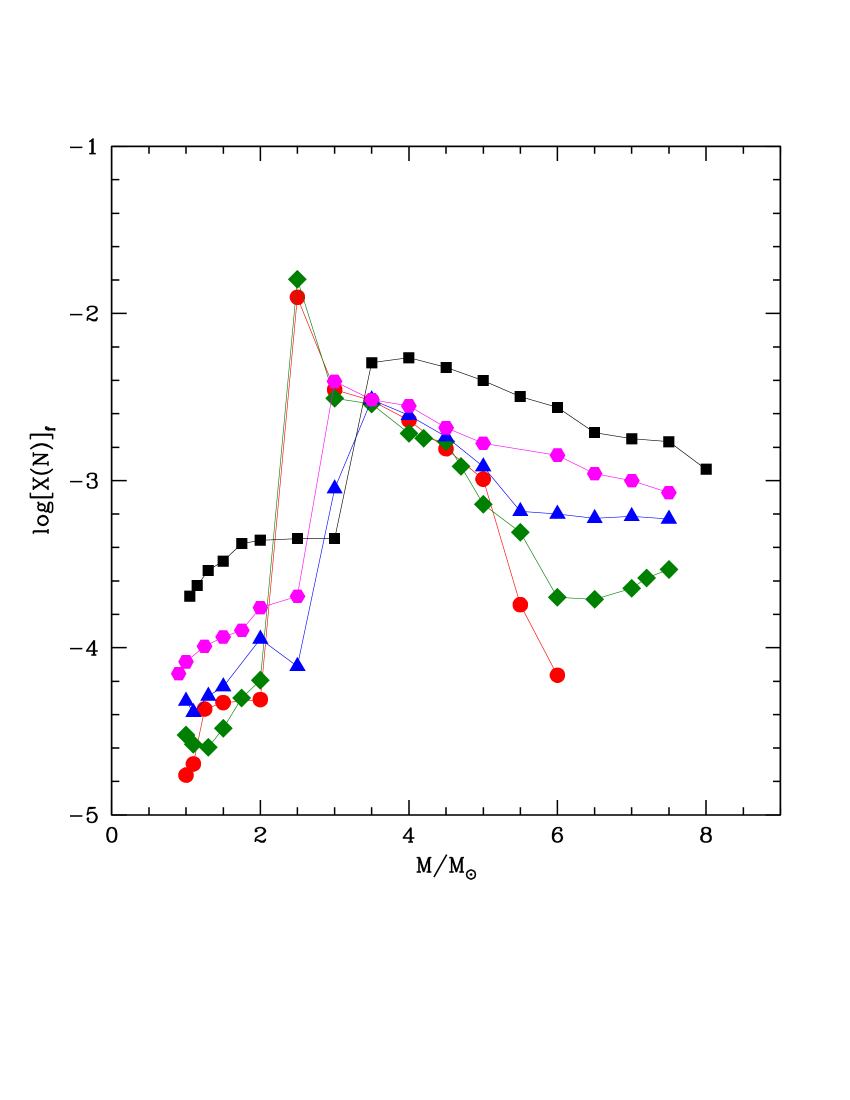
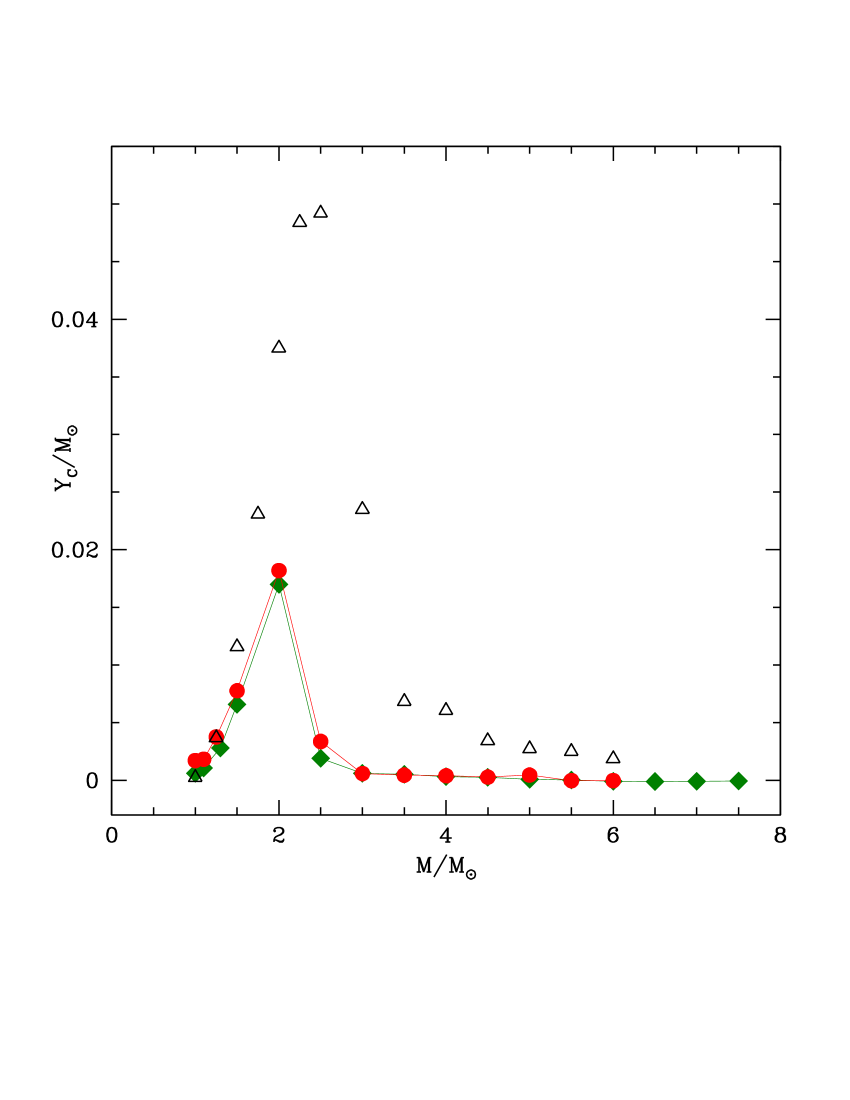
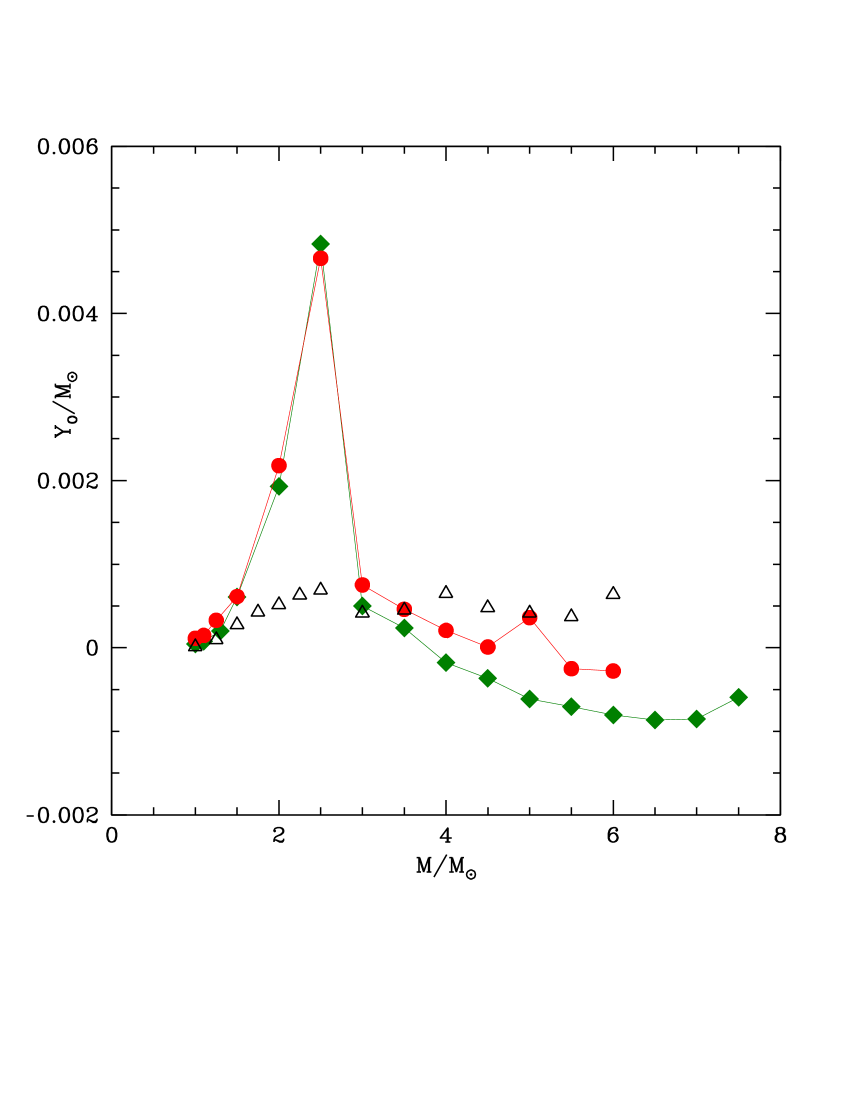
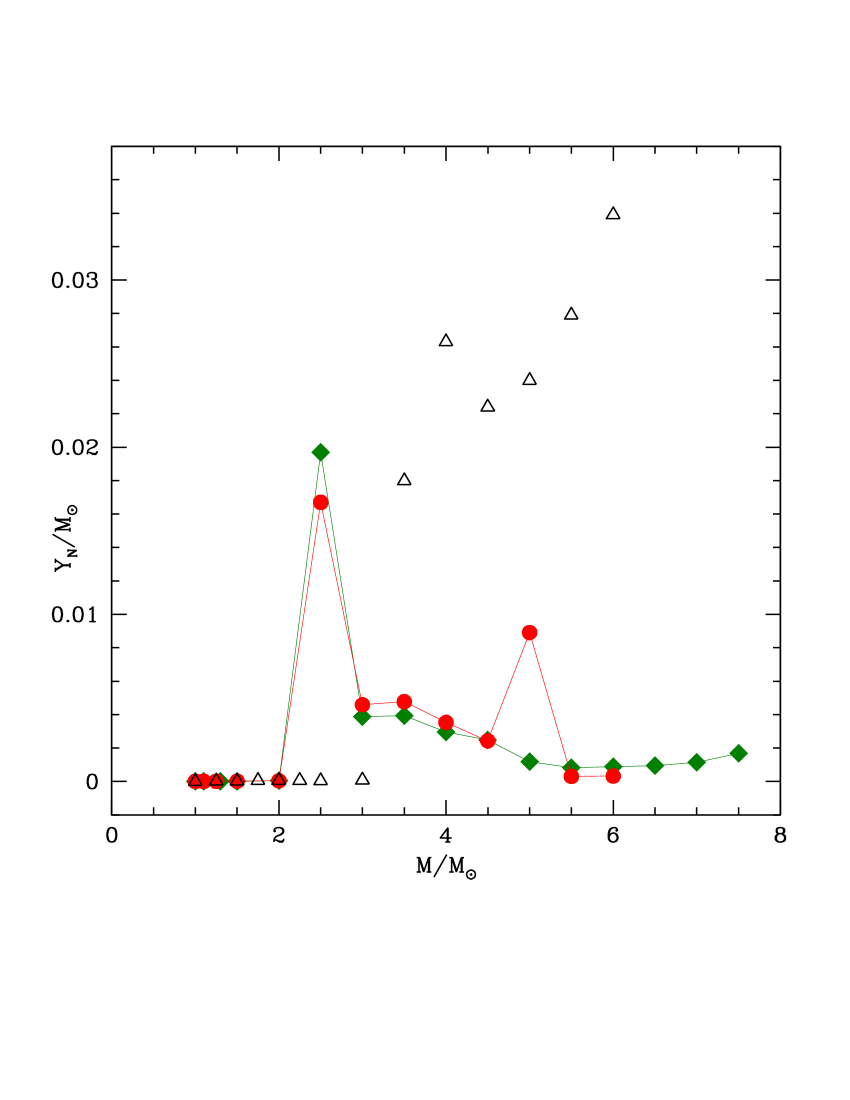
To understand the changes in the surface chemical composition occurring during the AGB evolution, we show in the other three panels of Fig. 2 the final surface mass fraction of the CNO species.
As shown in the top, right panel of Fig. 2, low-mass stars produce carbon. Consistently with the results shown in the right panels of Fig. 1, the trend of the final C with mass is positive for , with metallicity playing a minor role in this context. The largest carbon abundances are of the order of . Because the final carbon mass fraction is not sensitive to Z, the production factor, which indicates the ratio between the final and the initial carbon at the surface of star, changes significantly with the metallicity: in the most metal-poor cases discussed here, , the final carbon is enhanced by a factor up to , whereas in the models the largest C enrichment is by a factor .
For the stars experiencing HBB the trend of the final surface carbon with mass is negative, because, as shown in the top, left panel of Fig. 2, the higher the initial mass the stronger the HBB at the base of the envelope, the faster the carbon destruction process via proton fusion. In this mass domain the results are sensitive to the metallicity, because in metal-poor stars the initial, overall C+N+O is smaller and the HBB is more efficient; both factors lead to a final, lower carbon content in the surface regions of the star.
Post-AGB stars are the immediate progeny of AGB stars and are unique tracers of the nucleosynthesis that occurs prior to and during the AGB phase. Detailed chemical abundances studies of four single post-AGB stars in the Magellanic Clouds (Van Aarle et al., 2013, De Smedt et al., 2014), with initial masses and , have shown that the observed CO ratio is in the range . We note that there are currently no observations of post-AGB stars with , so we use the existing sample for comparison purposes. The observed CO ratios are significantly lower than the predicted CO ratios ( to 20, see table 1). To fully investigate the discrepancy in the observed and predicted CO ratios and make an accurate comparison to the low-metallicity models presented in this study, we require a statistically larger set of observations from post-AGB stars that cover a wide range of initial masses and probe lower metallicities.
The final carbon mass fractions predicted by the present models of AGB stars were shown to bracket the range of values measured in the Planetary Nebulae in the Magellanic Clouds (Ventura et al., 2015b, 2016a).
Among the CNO species, oxygen is the most sensitive to the metallicity. The trend of the final O with mass, shown in the bottom, left panel of Fig. 2, is qualitatively similar to C, with low-mass stars showing up some O enrichment and massive AGBs producing O-poor gas. The O-enrichment associated to TDU is significantly smaller than C, with a production factor that is below for and up to for . The role of metallicity is particularly relevant for the stars experiencing HBB: AGB stars of metallicity experience a mild depletion of oxygen, restricted to the most massive objects, whereas for the lowest metallicities we find a strong depletion of the surface O, up to a factor in stars. The very low oxygen content in the ejecta of low-metallicity, massive AGB stars was the main argument in support of a possible role played by this class of objects in the self-enrichment process of globular clusters (Ventura et al., 2001; D’Ercole et al., 2008).
The results regarding the amount of nitrogen produced, shown in the bottom, right panel of Fig. 2, are understood based on the behaviour of carbon and oxygen. Some N production occurs in low-mass stars, owing to the effects of the first dredge-up; the N enhancement is typically in the range , independently of metallicity. The run of N vs mass exhibits a steep rise in the mass domain close to the lower limit to ignite HBB, owing to the conversion of C and O to N; this is independent of whether the sole CN or the full CNO cycling is activated at the base of the envelope. As discussed earlier in this section, the AGB stars of mass in the range achieve the largest N enrichment, owing to the higher availability of carbon. For the massive AGB stars, in which HBB is the dominant mechanism in changing the surface chemistry, the final N increases with Z, owing to the higher overall CNO content.
4 Stellar yields
The yields of the various chemical species are key quantities to understand the pollution expected from a class of stars and the way they participate in the gas cycle of the interstellar medium (Kobayashi et al., 2011).
In the following we will use the classic definition, according to which we indicate the yield of the -th element as
| (1) |
The integral is calculated over the entire stellar lifetime; is the mass fraction of species at the beginning of the evolution (references regarding the initial chemical composition are provided in Sec. 2.1). Based on this definition, the yield is negative if an element is destroyed and positive if it is produced over the life of the star.
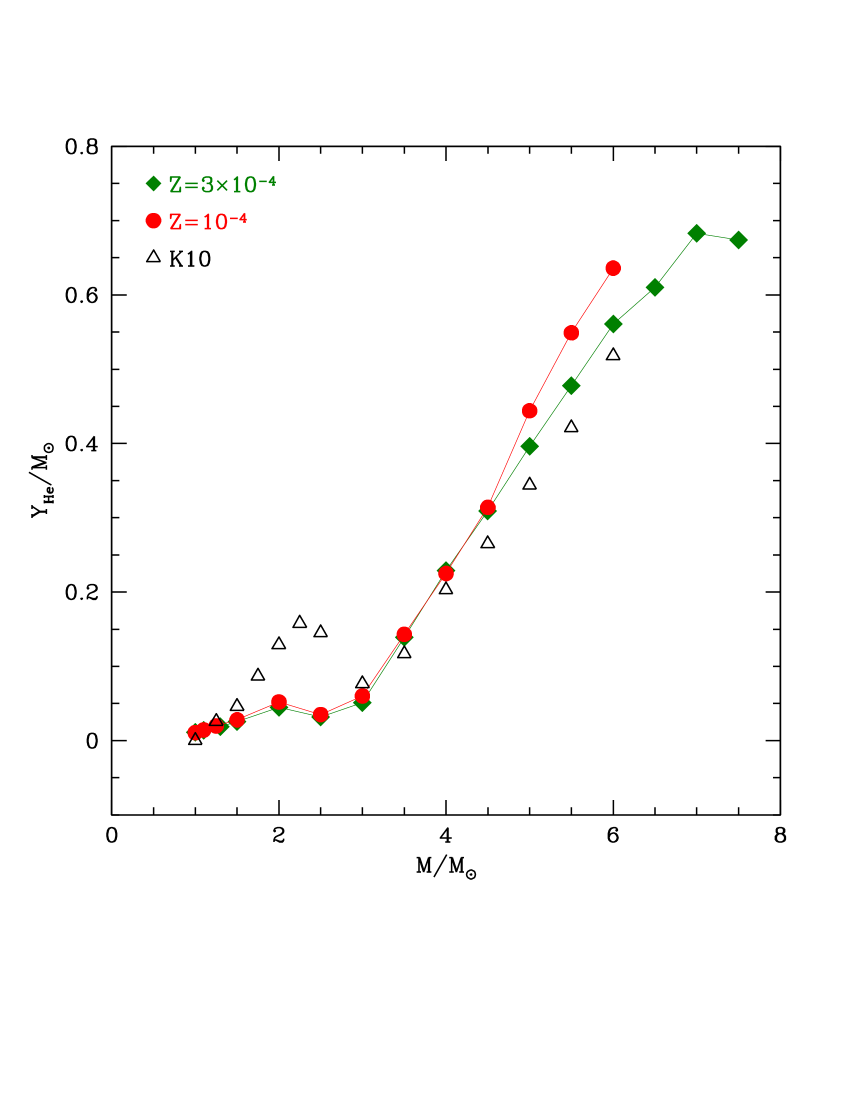
Table LABEL:tabyield reports the yields of different chemical species for the range of mass and metallicity considered. Fig. 3 shows the yields of helium and of the CNO elements.
In the top, left panel of Fig. 3 we see that AGB stars of initial mass above produce gas enriched in helium. The helium enrichment of the surface regions occurs during the second dredge-up (SDU) episode (Becker & Iben, 1979), which follows the end of the core helium burning phase. The helium yield increases with the initial mass of the star, reaching a maximum of for the most massive stars experiencing the TP phase. The helium yields are not significantly sensitive to the metallicity, as indicated by the almost complete overlapping of the lines corresponding to and . These results find an explanation in the behaviour of SDU, whose efficiency, independent of metallicity, increases with the core mass, hence with the initial mass of the star (Ventura, 2010). In stars of mass below the inwards penetration of the convective envelope, which follows the extinction of helium in the core, is not sufficiently deep to penetrate the H-He discontinuity. This is the reason for the clear discontinuity in the slope of the trend of the helium yield with mass, present in the two lines in the top, left panel of Fig. 3.
The yields of carbon, shown in the top, right panel of Fig. 3, reflects the evolution of the surface carbon, discussed in section 3.1. Low-mass star produce gas enriched in carbon, owing to the effects of repeated TDU events. The largest amounts of C are produced by stars, which attain the largest surface carbon abundances during the AGB life (see top, right panel of Fig. 1): the carbon yields of these stars are slightly below . Note that the carbon yields are almost independent of metallicity in this Z domain, in agreement with the discussion in section 3.1.
The carbon yields of stars of mass are generally close to zero, as these stars experience HBB, which destroys the carbon in the envelope. The yields of the most massive stars are negative, as the surface chemistry of these objects is mostly determined by HBB; in stars of mass in the range the carbon yields are positive and negligible, owing to the combined effects of TDU and HBB.
For what regards oxygen (see bottom, left panel of Fig. 3), the yields, similarly to carbon, can be explained based on the balance between the effects of HBB and TDU. Low mass stars produce gas enriched in oxygen, owing to the effects of TDU. The amount of oxygen produced (the yield is at most , for stars) is smaller than carbon. The oxygen yields drop to zero, or turn negative, in the mass domain , owing to the effects of HBB (see bottom, left panel of Fig. 1); in the very metal-poor stars discussed here HBB is extremely strong, thus the gas produced is oxygen-poor for all the stars experiencing HBB.
In the case the carbon and oxygen yields of the stars experiencing HBB are extremely low, but positive, with the only exception of the and stars; this behaviour can be explained by considering that in this very low metallicity domain a few TDU episodes are sufficient to provoke a significant enrichment in the surface C and O, which partly counterbalance the effects of HBB.
The effects of TDU, while important in enriching the gas ejected by low-mass AGBs in carbon and oxygen, have a scarce influence on nitrogen: the N yields of stars are below , showing up a small enrichment, mainly a consequence of the first dredge-up222In the present models we did not consider any possibile extra-mixing from the convective envelope during the red giant phase. In particular, we did not consider any thermohaline mixing effects, which might rise the surface N (Charbonnel & Lagarde, 2010). The N yields given here are to be considered as lower limits for the stars with initial mass below . The stars exposed to HBB produced N-rich matter due to the conversion of carbon and oxygen into nitrogen via p-capture nucleosynthesis. The slope of the N yield with mass is negative in this mass domain because massive AGBs produce essentially secondary nitrogen, whereas the lower mass counterparts, which experience several TDU events, produce also large quantities of primary nitrogen. This explains the peak of at in the bottom, right panel of Fig. 3.
Regarding the chemical species not involved in CNO cycling, we note in table LABEL:tabyield that the 24Mg yields of the stars experiencing HBB are negative, a further signature of the high efficiency of HBB in very metal-poor AGB stars. This is consistent with the positive yields of aluminium and silicon, which are the products of the Mg-Al-Si nucleosynthesis (Arnould et al., 1999; Ventura et al., 2011). Note that the trend of the Al yields with mass is not monotonic in the high mass domain because for HBB temperatures above MK the Al equilibrium abundance in the Mg-Al-Si chain decreases. The sodium yields are either extremely small or negligible in the large mass domain, because under these conditions the destruction channel of sodium prevails over production (Mowlavi, 1999).
. 28Si 1.00 -1.0E-2 1.1E-2 1.7E-3 1.0E-7 5.5E-6 1.2E-4 0.0E-0 1.0E-7 0.0E-0 8.9E-8 9.1E-8 3.3E-8 0.0E-0 1.10 -1.6E-2 1.4E-2 1.8E-3 1.1E-7 6.1E-6 1.5E-4 0.0E-0 1.2E-7 0.0E-0 1.2E-7 1.4E-7 2.9E-8 0.0E-0 1.25 -2.4E-2 2.0E-2 3.8E-3 2.5E-7 1.2E-5 3.3E-4 2.5E-7 3.1E-7 1.4E-8 6.1E-7 5.7E-7 6.9E-8 2.0E-8 1.50 -3.7E-2 2.8E-2 7.8E-3 4.5E-7 1.9E-5 6.1E-4 1.2E-6 1.3E-6 1.2E-7 5.0E-6 3.6E-6 6.4E-7 8.8E-8 2.00 -7.3E-2 5.2E-2 1.8E-2 1.1E-6 4.1E-5 2.2E-3 1.3E-5 7.9E-6 1.6E-6 6.1E-5 3.1E-5 1.7E-5 4.0E-7 2.50 -6.1E-2 3.5E-2 3.4E-3 4.0E-4 1.7E-2 4.7E-3 7.4E-5 1.4E-4 1.4E-6 1.4E-4 4.4E-5 7.1E-5 3.3E-6 3.00 -6.6E-2 6.0E-2 5.9E-4 5.9E-5 4.6E-3 7.5E-4 7.0E-6 3.3E-5 4.3E-9 9.8E-6 3.6E-6 4.9E-6 4.3E-7 3.50 -1.5E-1 1.4E-1 4.5E-4 3.9E-5 4.8E-3 4.6E-4 1.4E-5 3.1E-5 -4.7E-6 1.4E-5 3.6E-6 7.7E-6 5.2E-7 4.00 -2.3E-1 2.2E-1 3.9E-4 4.5E-5 3.5E-3 2.1E-4 3.0E-5 2.7E-5 -1.2E-5 2.0E-5 4.1E-6 1.4E-5 1.0E-6 4.50 -3.2E-1 3.1E-1 2.8E-4 2.5E-5 2.4E-3 9.3E-6 2.4E-5 9.9E-6 -1.6E-5 1.3E-5 1.5E-6 1.6E-5 4.6E-6 5.00 -4.5E-1 4.4E-1 4.5E-4 1.0E-4 8.9E-3 3.6E-4 1.6E-4 3.9E-5 -1.8E-5 8.5E-5 1.9E-5 6.9E-5 4.0E-5 5.50 -5.5E-1 5.5E-1 -2.6E-4 3.1E-6 3.0E-4 -2.5E-4 -1.2E-5 -2.1E-7 -2.1E-5 -5.2E-7 -1.7E-6 -3.7E-7 4.9E-5 6.00 -6.4E-1 6.4E-1 -2.8E-5 3.4E-6 3.2E-4 -2.8E-4 -1.3E-5 -2.9E-7 -2.4E-5 -2.0E-7 -1.9E-6 -3.5E-7 5.3E-5 1.00 -1.2E-2 1.1E-2 5.9E-4 8.7E-8 1.0E-5 4.6E-5 -4.8E-8 1.4E-7 -2.9E-9 -2.4E-10 1.2E-8 5.6E-8 0.0E-0 1.10 -1.5E-2 1.4E-2 1.1E-3 1.1E-7 9.2E-6 7.7E-5 -6.2E-8 4.5E-6 3.0E-9 1.7E-8 5.5E-8 6.2E-8 0.0E-0 1.30 -2.2E-2 1.9E-2 2.8E-3 2.1E-7 1.0E-5 2.0E-4 -1.0E-8 4.4E-7 -4.4E-9 3.4E-7 3.6E-7 1.4E-7 0.0E-0 1.50 -3.3E-2 2.5E-2 6.6E-3 3.1E-7 1.5E-5 6.1E-4 5.9E-7 7.0E-7 -3.9E-8 2.3E-6 1.9E-6 4.6E-7 6.1E-8 2.00 -6.4E-2 4.5E-2 1.7E-2 1.5E-6 5.4E-5 1.9E-3 1.1E-5 6.7E-6 8.3E-7 5.0E-5 2.5E-5 1.4E-5 3.8E-7 2.50 -6.1E-2 3.2E-2 1.9E-3 3.1E-4 2.0E-2 4.8E-3 8.2E-4 1.6E-4 8.9E-4 1.2E-5 2.9E-4 1.4E-4 3.0E-5 3.00 -5.6E-2 5.1E-2 5.9E-4 7.1E-5 3.9E-3 5.0E-4 2.3E-6 2.0E-5 -4.0E-7 5.4E-6 1.8E-6 2.5E-6 6.3E-7 3.50 -1.4E-1 1.4E-1 5.2E-4 6.2E-5 3.9E-3 2.4E-4 3.9E-6 1.8E-5 -1.1E-5 1.4E-5 1.3E-6 4.8E-6 6.9E-7 4.00 -2.3E-1 2.3E-1 3.2E-4 3.0E-5 3.0E-3 -1.8E-4 9.1E-6 6.8E-6 -3.8E-5 2.7E-5 6.7E-7 1.9E-5 2.0E-5 4.50 -3.1E-1 3.1E-1 2.6E-4 3.0E-5 2.5E-3 -3.7E-4 2.0E-5 2.8E-6 -5.0E-5 2.1E-5 -8.2E-7 3.1E-5 9.4E-6 5.00 -4.0E-1 4.0E-1 7.4E-5 1.6E-5 1.2E-3 -6.1E-4 6.3E-6 6.6E-7 -5.8E-5 1.1E-5 -3.8E-6 2.1E-5 4.1E-5 5.50 -4.8E-1 4.8E-1 2.0E-5 4.4E-5 8.3E-4 -7.1E-4 6.7E-6 8.3E-8 -6.6E-5 1.6E-5 -4.7E-6 1.6E-5 5.0E-5 6.00 -5.6E-1 5.6E-1 -8.6E-5 7.8E-6 8.8E-4 -8.1E-4 7.9E-6 -1.5E-7 -7.3E-5 2.9E-5 -5.1E-6 1.6E-5 4.5E-5 6.50 -6.1E-1 6.1E-1 -1.0E-4 8.4E-6 9.4E-4 -8.6E-4 8.4E-6 -2.0E-7 -7.9E-5 3.5E-5 -5.4E-6 1.8E-5 4.3E-5 7.00 -6.8E-1 6.8E-1 -1.0E-4 1.3E-5 1.1E-3 -8.5E-4 1.2E-5 3.4E-7 -8.4E-5 5.5E-5 -5.4E-6 1.7E-5 2.9E-5 7.50 -6.7E-1 6.7E-1 -6.9E-5 2.1E-5 1.7E-3 -5.9E-4 3.8E-4 9.7E-6 -8.1E-5 6.9E-5 -3.8E-6 1.0E-5 1.2E-5
5 The comparison with results in the literature
AGB modelling is affected by several uncertainties in the input macro-phyics, mainly related to convection and mass loss. These uncertainties have important effects on the description of the evolution of both low-mass AGBs and of their higher mass counterparts, for what regards the main structural and evolutionary properties and the alteration of the surface chemical composition.
In the low-mass domain a relevant role is played by the treatment of the convective borders, particularly of the regions close to the base of the convective envelope; this determines the efficiency of TDU and consequently the extent of carbon and oxygen enrichment occurring after each TP (Straniero et al., 1997). For stars experiencing HBB the key issue is the treatment of the convective instability itself, i.e. the modality of calculating the temperature gradient with regions unstable to convective motions. The strength of HBB is heavily influenced by the convective model adopted (Ventura & D’Antona, 2005).
We expect that the impact of these phenomena is particularly relevant for the very low-Z models discussed in the present investigation. In low-mass stars, because the initial carbon content of the star is extremely small, a given amount of carbon dredged-up to the surface triggers a very large percentage increase in the surface C, which, in turn, favours a faster and easier achievement of the C-star stage; therefore, the description of TDU deeply affects the carbon enrichment in the gas ejected. Regarding stars of initial mass above , in very low-metallicity AGB stars the efficiency of HBB, hence the degree of nucleosynthesis experienced at the base of the external envelope, changes dramatically according to convection modelling. This is going to affect the yields of all the species involved in p-capture nucleosynthesis, from carbon to silicon.
To understand how the results obtained depend on the description of convection, we report in Fig. 3 the yields of models, published in Karakas (2010, hereinafter K10).
The top-left panel shows that the massive AGB stars helium yields presented here are similar to those by K10. This is because the helium enrichment in massive AGB stars occurs mainly during the SDU, a process, taking place before the beginning of the AGB phase, whose description is unaffected by the uncertainties associated to the AGB evolution. This finding confirms the robustness of the helium yields by masssive AGB stars, in agreement with the analysis by Ventura (2010). On the other hand, deeper TDU episodes are responsible for the higher helium yields reported by K10 in the low-mass regime (1.5-3).
Regarding the CNO species, the results shown in Fig. 3 indicate some similarities and significant differences.
The carbon K10 yields are generally higher than ours. In the low-mass domain this is due to the higher efficiency of TDU in the K10 computations, which favours a larger C enrichment. For the stars experiencing HBB, an additional reason for the differences found is the higher strength of the HBB in the present models compared to K10; while the K10 carbon yields are positive for all the masses investigated, in the present case the C yields of massive AGB stars are negative, because carbon is severely destroyed by p-capture at the bottom of the envelope.
The differences in the efficiency of the TDU experienced have important effects on the amount of nitrogen produced by AGB stars of mass above . The N yields are significantly higher in the K10 case, because of the additional contribution of primary nitrogen, synthesized via HBB by proton capture on the carbon nuclei dredged-up during each TDU event.
The strength of HBB has a dominant role in the determination of the oxygen yields. While the K10 oxygen yields are positive for all the masses considered, in the models discussed here the O yields are negative in the large mass domain, owing to the higher efficiency of the HBB experienced, in comparison to K10.
6 Dust from metal-poor AGB stars
The circumstellar envelopes of AGB stars are generally considered as favourable environments to dust formation (Gail & Sedlmayr, 1999; Ferrarotti & Gail, 2006). This is mainly due to two reasons: a) the effective temperatures of AGB stars are extremely cool, below 5000K, which partly inhibits the sublimation process; b) the high number of gas molecules available per unit volume, due to the large densities of the wind, triggered by the large rates with which these stars lose their envelope (up to a few yr).
As discussed in section 2.3, the mineralogy of the dust formed in the wind of AGB stars is determined by the CO ratio: carbon stars produce mainly solid carbon and SiC particles, whereas oxygen-rich stars produce silicates and alumina dust. In both cases little amounts of iron dust is formed (Ventura et al., 2012a, b, 2014b; Dell’Agli et al., 2017; Ventura et al., 2018).
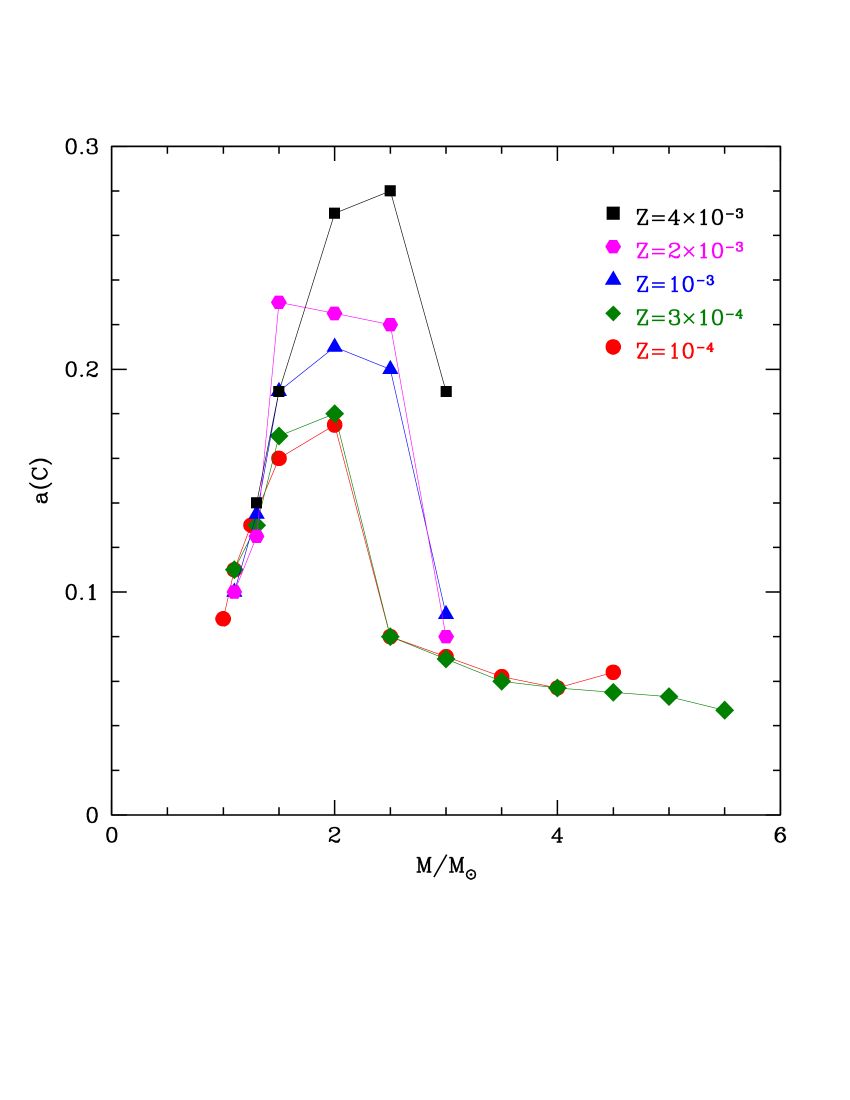
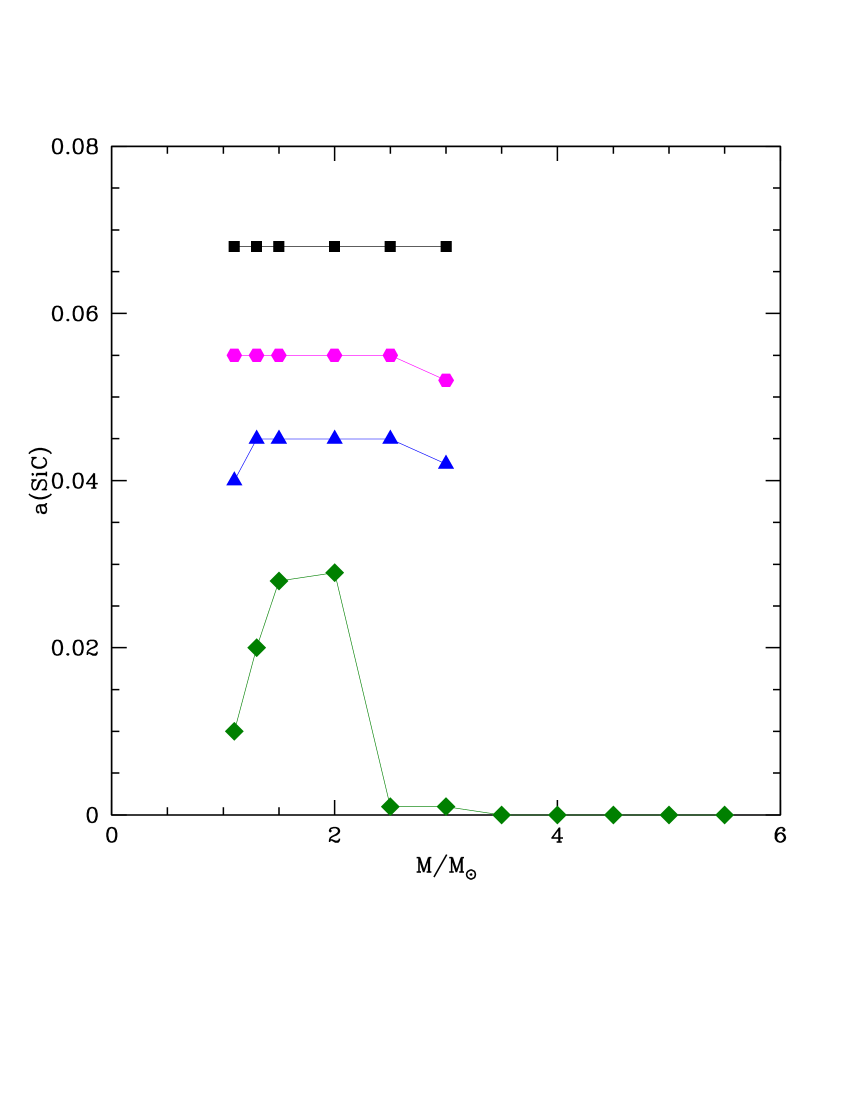
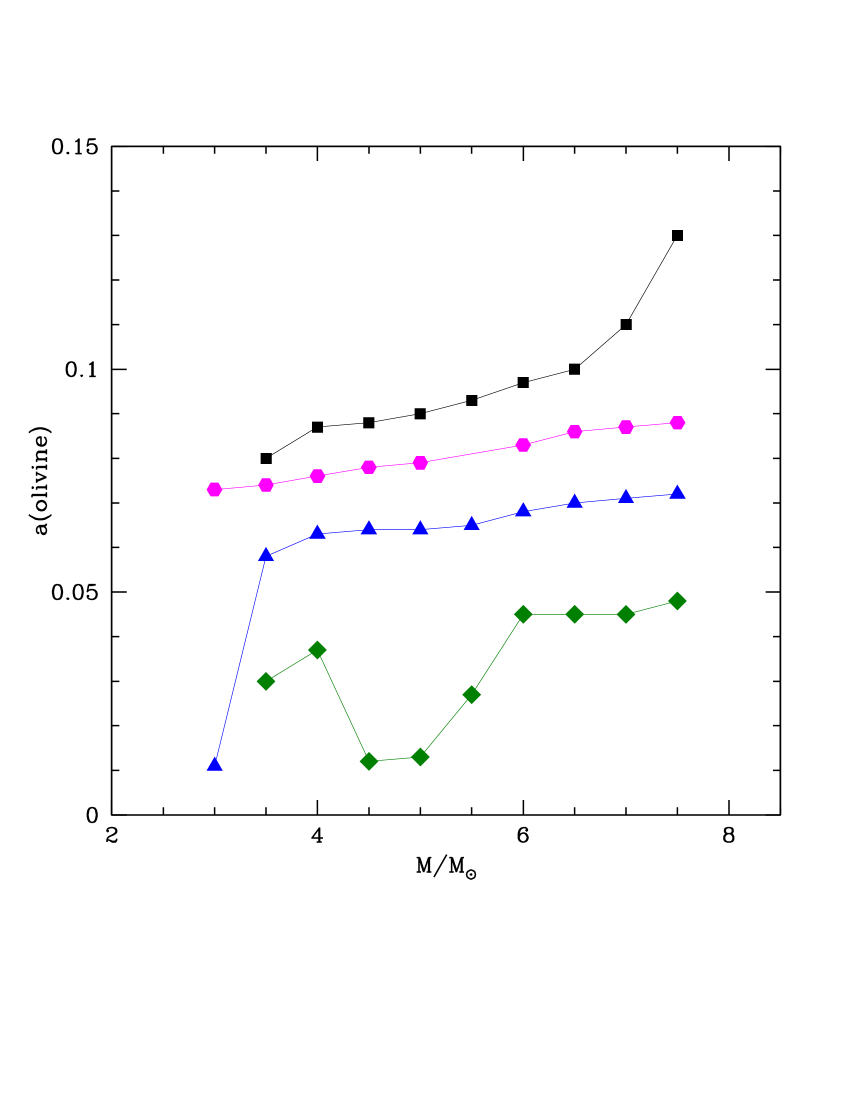
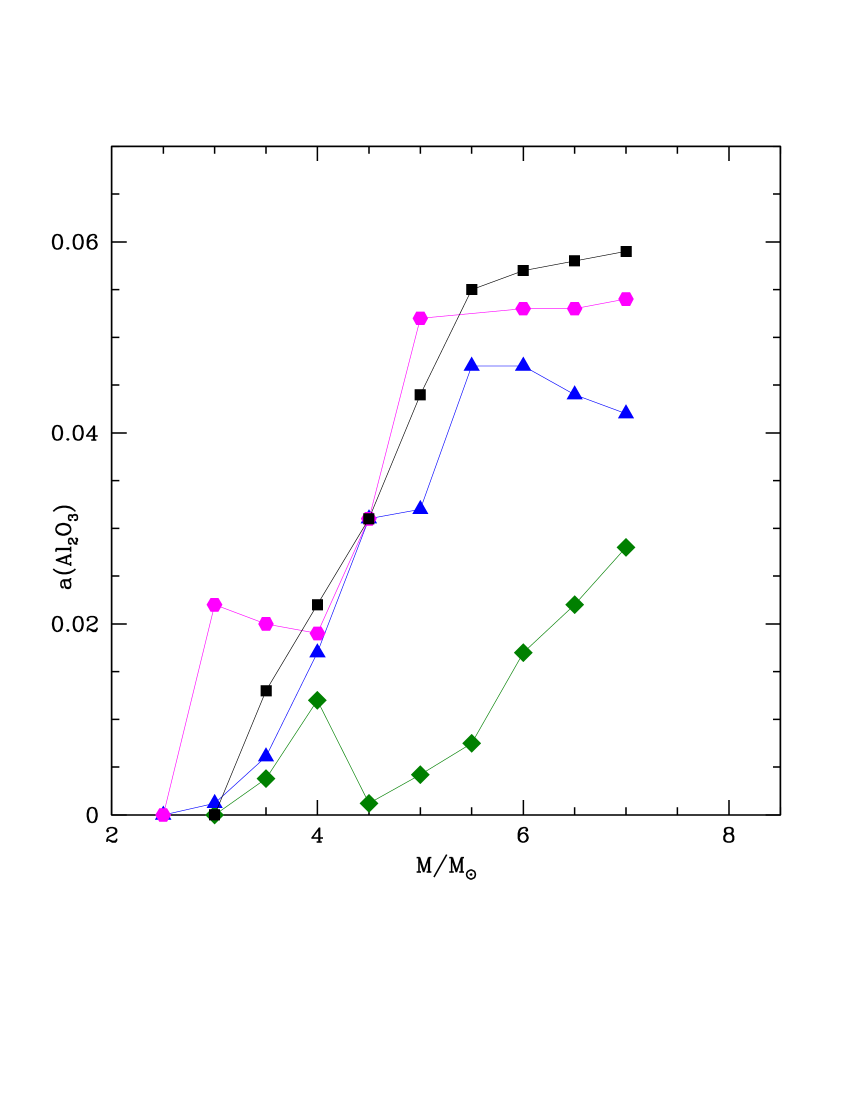
Fig. 4 shows the size of the grain particles formed in the wind of AGB stars of various masses and metallicities. The different panels refer to amorphous carbon (top, left panel), silicon carbide (top, right), the most stable silicate, i.e. olivine (bottom, left), and alumina dust (bottom, right). For what attains low-mass stars, we do not consider the formation of silicates before the C-star stage is reached (e.g. during the early AGB phases), because in those cases the amount of dust formed is negligible.
We must keep into account that the size of the solid particles is not constant during the whole AGB evolution, because the physical conditions within the envelope change and the surface chemical composition is altered by the physical processes described earlier in this paper (Ventura et al., 2012a, b). For what attains olivine and alumina dust, the quantities reported in Fig. 4 refer to the evolutionary phases during which most of mass loss occurs, which are the most relevant to understand the impact of the gas and dust ejected by AGB stars. For what regards solid carbon, the dimension of amorphous carbon particles increases after the C-star stage is reached, owing to the gradual rise in the surface carbon; the quantities shown in the top, left panel of Fig. 4 refers to the final AGB phases, during which these stars reach the highest degree of obscuration. Finally, for what attains SiC, we will see that the species is so highly stable that saturation conditions are easily achieved: the size of the SiC particles keeps approximately constant for the whole AGB evolution.
The size of the carbon grains formed reflect the behaviour of the surface carbon, (see top, right panel of Fig. 2). For a given metallicity, the carbon grains with the largest size are formed in the wind of stars of initial mass stars, which in the latest evolutionary phases reach carbon mass fractions in the envelope above . The large degree of obscuration attained by these stars was proposed by Dell’Agli et al. (2014, 2015a) to explain the stars with the reddest infrared colours in the LMC.
For metallicities carbon particles are produced only in the circumstellar envelopes of stars of mass below , because in their higher mass counterparts the ignition of HBB prevents the achievement of the C-star condition. In the most metal-poor cases some carbon dust is produced even in stars, because they become carbon stars as a consequence of the destruction of the surface oxygen (see discussion in section 3.1); however, in these cases the size of the carbon grains is below m, because also carbon is exposed to proton fusion under HBB conditions, thus the excess of carbon with respect to oxygen in the envelope is very low. Most of the carbon dust is produced by low-mass stars.
Interestingly, we see that, according to our modeling, despite the increase in the surface carbon is fairly independent of metallicity (see top, right panel of Fig. 2), the size reached by amorphous carbon grains is higher the higher is Z: the grains with the largest dimension, of the order of m, form in the wind of stars. This can be explained by considering that metal-poor stars evolve at hotter surface temperatures, a condition that favours sublimation, which inhibits dust formation.
SiC dust is extremely stable: compared to carbon, SiC grains form closer to the surface of the stars, stellar radii from the photosphere (Ferrarotti & Gail, 2002). The amount of SiC formed is determined by the amount of silicon available, thus it is sensitive to the metallicity. Because the SiS molecule is extremely stable (Sharp & Huebner, 1990), only the gaseous silicon unlocked in SiS molecules, i.e. , is available to condense into SiC. The size of the SiC grains grows with Z: we find that SiCm for , SiCm for , SiCm for and SiCm for . No SiC forms around stars. The size of the SiC particles formed is practically independent of mass, because saturation conditions are easily reached in all the masses considered, halting a further growth of the grains.
The formation of silicates and alumina dust is sensitive to Z, because the size that the grains can reach depends on the amount of silicon and aluminium in the envelope. The size of olivine grains increases with metallicity and the mass of the star, because higher mass AGB stars experiment stronger HBB conditions. The trend of the size of olivine grains with mass is not monotonic in the case, because in stars of mass the destruction of the surface oxygen provokes a scarcity of water molecules, which are required to form silicates. In AGB stars negligible formation of silicates is expected.
On the qualitative side, alumina dust follows the same behaviour of silicates. The size of the Al2O3 grains is significantly smaller than silicates, because the amount of silicon in the envelope is higher than aluminium.
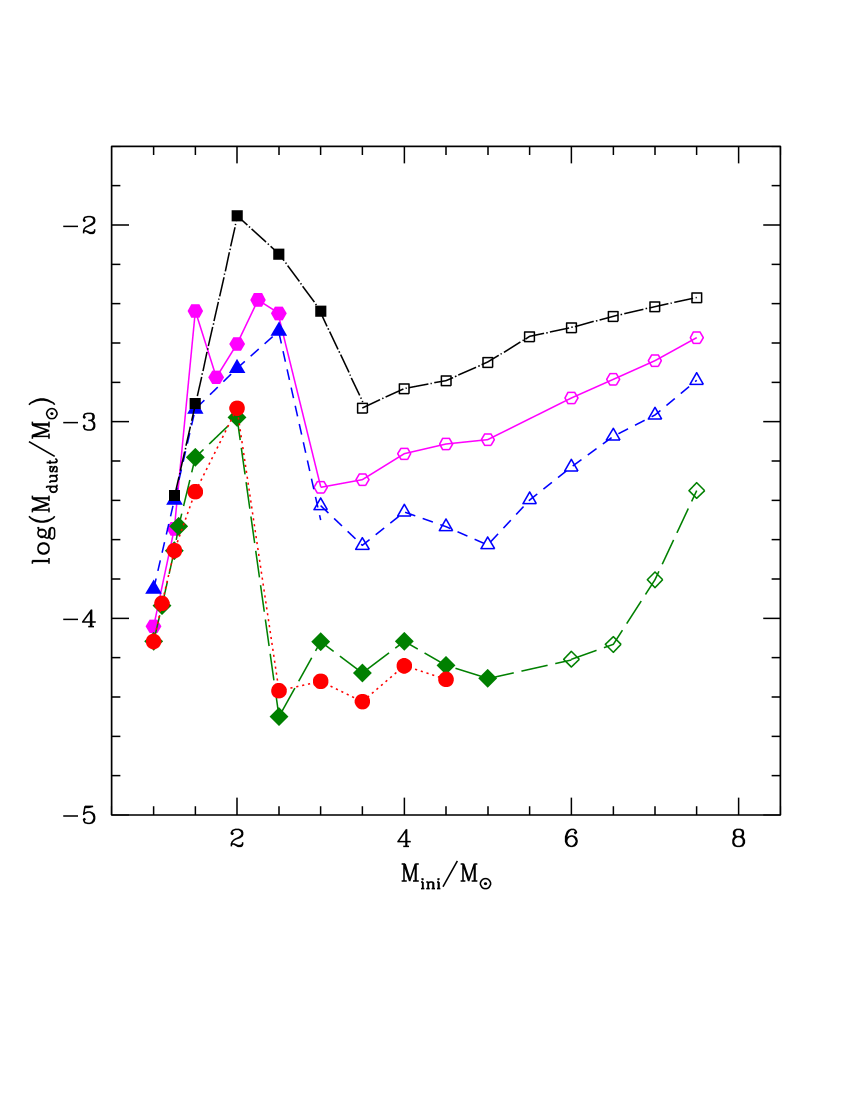
The summary of the results obtained are reported in Table LABEL:tabyielddust, together with the dust mass produced by low-metallicity stars during the entire AGB phase for each dust species. The total amount of dust is also shown in Fig. 5. A clear trend, expected based on the arguments discussed earlier in this section, is the drop in the amount of dust formed by stars of mass above as the metallicity decreases. The trend of the dust formed with mass also changes for metallicities . Indeed we have seen that in massive AGB stars of metallicity the strong HBB conditions provoke the destruction of the surface oxygen and the conversion of stars into C-stars; the surface carbon is extremely small though, thus dust is produced only in negligible quantities. In this mass domain the amount of dust produced is below for metallicities .
The only dust produced in meaningful quantities by AGB stars of metallicity is the amorphous carbon manufactured by , not experiencing HBB. The mass of solid carbon produced, below , is smaller than in their higher metallicity counterparts, according to the arguments given above.
In addition to constraining the nucleosynthesis experienced in the end of the AGB phase, the comparison with the dust that resides in the circumstellar environment surrounding single post-AGB stars is also a good tracer of the dust produced in the previous stage (see Van Winckel 2003 and references therein). Observational studies of the circumstellar environment around C-rich single post-AGB stars have shown that their dust is predominantly C-rich. For instance, the m amorphous SiC feature is commonly observed in the circumstellar environment of many of these stars. Additionally, the C-rich post-AGB stars that are also s-process enhanced show the m feature (Kwok et al., 1989), whose exact nature remains unclear (Zhang et al., 2009) but is likely to be associated with C-rich dust. In the case of O-rich post-AGB stars, silicates (both amorphous and crystalline), oxides, and traces of crystalline water ice, make up most of their circumstellar environment (see Waters 2011 and references therein). However, we note that the current sample of observed post-AGB stars in the Galaxy and Magellanic Clouds are at higher metallicites (Z 0.007 0.008, see Section 3.2) than that of the models presented in this study. Therefore, to make an accurate comparison to the predicted dust chemistry, we require observations from post-AGB stars that cover a wide range of initial masses and probe lower metallicities.
| 1.0 | 7.62D-05 | – | – | – | – | – | 7.62D-05 | 7.43D-10 |
| 1.1 | 1.19D-04 | – | – | – | – | – | 1.19D-04 | 2.84D-09 |
| 1.25 | 2.21D-04 | – | – | – | – | – | 2.21D-04 | 6.05D-09 |
| 1.5 | 4.40D-04 | – | – | – | – | – | 4.40D-04 | 1.78D-08 |
| 2.0 | 1.17D-03 | – | – | – | – | – | 1.17D-03 | 3.15D-07 |
| 2.5 | 4.28D-05 | 1.44D-07 | 5.80D-08 | 2.22D-08 | 1.75D-04 | 2.17D-08 | 4.26D-05 | 1.22D-09 |
| 3.0 | 4.78D-05 | 2.10D-07 | 8.70D-08 | 3.53D-08 | 3.51D-06 | 5.35D-08 | 4.74D-05 | 2.03D-07 |
| 3.5 | 3.77D-05 | 9.19D-07 | 3.61D-07 | 1.42D-07 | 1.26D-05 | 2.16D-07 | 3.61D-05 | 6.39D-07 |
| 4.0 | 5.73D-05 | 1.00D-06 | 3.95D-07 | 1.58D-07 | 2.08D-05 | 2.67D-07 | 5.54D-05 | 2.21D-06 |
| 4.5 | 4.89D-05 | 1.08D-07 | 5.90D-08 | 3.71D-08 | 8.80D-06 | 7.05D-07 | 4.80D-05 | 5.79D-06 |
| 5.0 | 7.28D-07 | 1.27D-09 | 9.71D-10 | 1.01D-10 | 1.08D-09 | 7.25D-07 | – | – |
| 5.5 | 7.92D-07 | 2.87D-09 | 1.58D-09 | 7.91D-10 | 1.63D-09 | 7.85D-07 | – | – |
| 6.0 | 6.01D-07 | 3.31D-08 | 1.66D-08 | 1.03D-08 | 1.56D-07 | 5.41D-07 | – | – |
| 1.00 | 7.62D-05 | – | – | – | – | – | 7.62D-05 | 7.43D-10 |
| 1.10 | 1.16D-04 | – | – | – | – | – | 1.16D-04 | 1.19D-07 |
| 1.25 | 2.21D-04 | – | – | – | – | – | 2.21D-04 | 6.05D-09 |
| 1.30 | 2.93D-04 | – | – | – | – | – | 2.93D-04 | 5.58D-07 |
| 1.50 | 6.58D-04 | – | – | – | – | – | 6.58D-04 | 1.75D-06 |
| 2.00 | 1.05D-03 | – | – | – | – | – | 1.05D-03 | 2.62D-06 |
| 2.50 | 3.16D-05 | 3.33D-06 | 1.20D-06 | 4.13D-07 | 4.10D-04 | 6.04D-08 | 2.66D-05 | 7.77D-09 |
| 3.00 | 7.59D-05 | 3.14D-06 | 1.18D-06 | 4.52D-07 | 4.56D-09 | 6.50D-07 | 7.05D-05 | 3.72D-06 |
| 3.50 | 5.27D-05 | 1.06D-05 | 3.93D-06 | 1.47D-06 | 5.18D-06 | 2.33D-06 | 3.43D-05 | 4.35D-06 |
| 4.00 | 7.63D-05 | 1.37D-05 | 6.82D-06 | 4.02D-06 | 7.01D-07 | 6.48D-06 | 4.53D-05 | 2.32D-05 |
| 4.50 | 5.77D-05 | 3.59D-07 | 1.76D-07 | 1.05D-07 | 7.75D-06 | 1.21D-05 | 4.50D-05 | 1.26D-05 |
| 5.00 | 4.94D-05 | 8.15D-08 | 4.37D-08 | 2.43D-08 | 9.41D-07 | 1.75D-05 | 3.17D-05 | 2.61D-05 |
| 5.50 | 5.60D-05 | 9.36D-07 | 4.98D-07 | 2.55D-07 | 9.39D-07 | 1.88D-05 | 2.45D-05 | 1.01D-05 |
| 6.00 | 6.19D-05 | 1.02D-05 | 5.48D-06 | 3.47D-06 | 9.37D-07 | 4.28D-05 | – | – |
| 6.50 | 7.36D-05 | 1.33D-05 | 4.83D-06 | 2.07D-06 | 6.64D-06 | 5.34D-05 | – | – |
| 7.00 | 1.57D-04 | 5.91D-05 | 3.46D-05 | 9.10D-06 | 2.58D-05 | 5.40D-05 | – | – |
| 7.50 | 4.46D-04 | 3.20D-04 | 9.72D-05 | 2.68D-05 | 3.57D-05 | 2.02D-06 | 2.82D-08 | 3.63D-08 |
7 The contribution of metal-poor AGB stars to the cosmic dust yield
Following the discussion presented in our previous works, here we briefly discuss the impact of the new AGB dust yields, computed with ATON, on the so-called cosmic dust yield.
To study the dust contribution from low-metallicity AGB stars to the overall dust budget of stellar populations we follow the methodology by Valiante et al. (2009): The time evolution of the total dust mass produced by a single population of stars with initial mass forming at a fixed metallicity of , and is computed as:
| (2) |
where and are the progenitor star and its produced dust mass and SFR is the star formation rate that, in general, is a function of time and the mass- (and metallicity-) dependent evolutionary time-scale, . The lower mass limit, , is set by the stellar mass corresponding to an evolutionary time-scale , i.e. the minimum stellar mass that is able to contribute to dust production at time . The evolutionary time-scales of intermediate mass stars are reported in Table LABEL:tabmod. The initial mass function (IMF), is a Larson distribution with characteristic mass (Larson, 1998)333We normalize to unity the integral of in the mass range .:
| (3) |
with In this calculation we assume that all the stars form in an instantaneous burst at , integrating the mass- and metallicity-dependent dust injection rate from AGB stars and SNe for about 10 Gyr. This simple approach enable us to compare the maximum contribution of the two main stellar dust sources, AGB and SNe, before newly formed grains are injected (and reprocessed) into the host galaxy ISM.
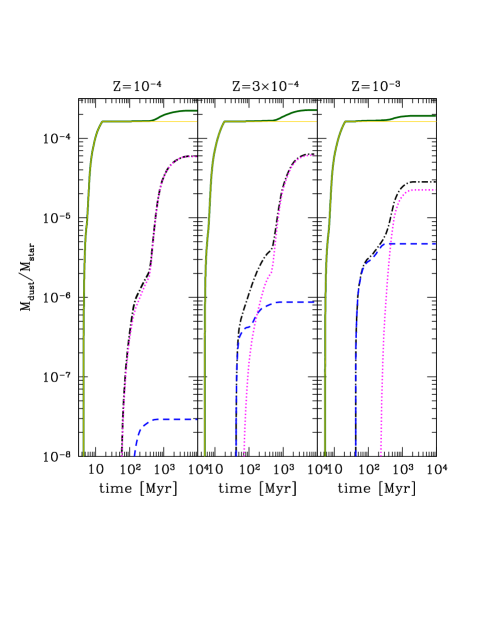
In Figure 6 we show the evolution of the cosmic dust yields of intermediate mass stars, i.e. the total dust mass produced by stars normalized to the total stellar mass formed in a single instantaneous burst. The left and middle panels refer, respectively, to and . To understand the trend with metallicity we also show in the right panel the case (Ventura et al., 2012a, b). The contributions of silicate (blue dashed lines) and carbon (magenta dotted lines) dust to the total AGB dust budget (black dot-dashed lines) are shown. The green-thick solid lines indicate the cosmic dust yield444Note that dust reprocessing in the ISM (dust destruction by SN shocks and grain growth by accretion of heavy elements from the gas phase) is not taken into account in the present computation. while the yellow-thin solid lines refer to the contribution from SNe, calculated taking into account the partial destruction of newly synthesized dust in the reverse shock of the SN ( of the newly formed dust survives; see Bianchi & Schneider 2007 and Valiante et al. 2009 for details).
At the metallicity an important transition occurs: the cosmic dust yield is dominated by carbonaceous particles at all times, whereas for higher metallicities there is an early epoch ( Myr) dominated by the production of silicate dust. As shown in the figure, the epoch of transition from silicate-dominated to carbon-dominated dust production depends on metallicity.
In the early evolutionary stages ( Myr) the cosmic dust yield in the and cases is, respectively, 3 and 7 times larger than . This trend with is due to the behaviour of stars, whose dust production increases with metallicity (see Figure 5).
At later times, the cosmic dust yields become less and less sensitive to the metallicity; these epochs are characterized by the evolution of lower mass stars (), whose dust production is almost independent of (see Figure 5). After 500 Myr the cosmic dust yields reach a value of for and .
Interestingly, Gyr after the starburst, the cosmic dust yield in the case is a factor of 2 smaller than for (see right-panel of Figure 6). This is a consequence of the lower abundance of carbon in metallicity stars, as shown in the top right panel of Figure 3.
Finally, AGB stars contribution to the cosmic dust yield of the whole
stellar population (red dot-dashed lines), reach at most (on time-scales longer
than Gyr, close to the Hubble time at redshift ). Thus, metal-poor AGB stars,
are not the main stellar dust producers, in particular at very high redshift ().
When (i.e. ) the dominant dust factories are higher mass stars,
, exploding as SNe (see Valiante et al., 2009, 2017).
Conversely, metal-rich intermediate mass stars are expected to provide a significant
(or even dominant, on timescales of Myr; Valiante et al., 2017)
contribution to cosmic dust in galaxies (and quasars) already as redshift as high as . As a consequence of the strongly metallicity-dependent dust production rate (and thus total dust yield)
computed with the ATON models we expect that if galaxies are metal-poor their total dust budget is mainly
the result of high-mass star evolution.
On the other hand, metal-rich systems may have been significantly polluted by dust produced by AGB stars.
Our conclusion here is different from what discussed in previous
studies (see e.g. Valiante et al., 2009; Dwek & Cherchneff, 2011)
in which a dominant contribution from low-metallicity intermediate-mass stars is found,
on shorter time-scales, even at (e.g. after Myr as in Valiante et al., 2009).
The origin of this difference comes from the total dust yields from AGB stars adopted in these works that are only weekly dependent on stellar initial
metallicity (see e.g. Dwek, 1998; Zhukovska et al., 2008).
The role of AGB stars and SNe as stellar dust sources has been at the center of several studies aimed to explain dust enrichment of galaxies, especially at high redshifts. To this aim, stellar dust yields are often used as an input to cosmological models which follow the complex process of galaxy formation and evolution. Thus, the adopted stellar yields play a fundamental role in modelling dust (and metals) evolution through cosmic times. The result presented here, showing a strong metallicity-dependence of the AGB star yields, is important in such a context. The impact of different AGB and SNe dust yields on dust production in different environments is discussed in Gall et al. (2011a), Valiante et al. (2017) and Ginolfi et al. (2018).
It is important to note, however, that the (relative) role of AGB stars and SNe as stellar dust sources not only depends on mass- and metallicity-dependent yields (Valiante et al., 2017; Ginolfi et al., 2018) but also on the adopted IMF and SFH (more than on cosmic time, i.e. independently of the galaxy redshift up to )(Valiante et al., 2009, 2011; Calura et al., 2014; Mancini et al., 2015). As an example, Valiante et al. (2009) or Dwek & Cherchneff (2011) show that AGB stars may be the dominant dust sources in dusty quasars at provided that a peculiar SFH is assumed. AGB stars are also shown to have a major role as stellar dust factories in metal-poor dwarf galaxies (Zhukovska, 2014). On the other hand, different studies using AGB dust yields from Ferrarotti & Gail (2006) or Zhukovska et al. (2008) conclude that dust enrichment in different systems (from high redshift starburst galaxies and quasars to local Milky Way-like and dwarf galaxies) require either a rather sizable (dominant) contribution by SNe, with AGB stars providing an insufficient/negligible contribution (e.g. Michałowski et al., 2010; Gall et al., 2011a; Michałowski, 2015), an IMF biased towards high-mass stars (top-heavy; e.g. Gall et al., 2011a, b; Valiante et al., 2011; Calura et al., 2014) or an additional, non stellar contribution (such as grain growth or re-formation in the ISM; e.g. Michałowski et al., 2010; Valiante et al., 2011; Zhukovska, 2014; Michałowski, 2015; Zhukovska et al., 2016; Mancini et al., 2015; Ginolfi et al., 2018). Our study suggest that these results would be further strenghtened, and in some cases pushed to their extremes (e.g. towards unfeasible SNe dust yields requirements), if the reduced low-metallicity AGB stars contribution is taken into account.
8 Conclusions
We present very low-metallicity models of stars of low and intermediate mass, evolving through the AGB phase. This work extends down to metallicities previous results from our group, limited to . The models presented here have metallicity and .
We find that the mass transition to activate HBB at the base of the envelope is , about half solar mass lower than in stars of higher metallicity. Low-mass stars not experiencing HBB reach the C-star stage, due to the effects of repeated TDU events. The carbon yields and the final carbon are sensitive to the initial mass, while being fairly independent of metallicity.
The strength of HBB experienced by stars is higher the lower the metallicity. The efficiency of HBB in the low-Z domain investigated here is so strong that the surface oxygen is almost entirely destroyed by p-capture reactions taking place at the base of the envelope; this holds particularly for the most massive AGB stars, where the evolution of the surface chemical composition is essentially determined by HBB. In the case the strong destruction of oxygen makes all the stars to reach the C-star stage, independently of the initial mass; these stars are expected to be observed as C-stars during the post-AGB phases.
The dust manufactured by low-metallicity AGBs reflects the evolution of the surface chemical composition. In the low-mass domain most of the dust is under the form of amorphous carbon, with little () or no () traces of silicon carbide. Despite the carbon enrichment of the surface regions is fairly independent of metallicity, the quantity of dust produced decreases with , because the higher effective temperatures reached by stars of lower metallicity partly inhibits dust formation.
In the high-mass domain the trend of dust with metallicity is more straightforward. These stars produce essentially silicates and alumina dust; because of the larger availability of silicon and aluminium in higher-metallicity stars, the dust mass manufactured and the size of the dust particles are higher the larger the metallicity. The stars follow a different behaviour, because the strong destruction of the surface oxygen inhibits the formation of silicates: these stars produce only carbon dust, in negligible quantities, owing to the destruction of the surface carbon triggered by HBB.
In the context of cosmic dust production, the present results indicate that the AGB contribution to the global dust production in metal-poor environments reach at most after Gyr, which corresponds to a redshift . The percentages and epochs quoted above are partly dependent on the physical ingridients used to model the AGB phase, particularly to the extent of the extramixing region during the TDU (and the efficiency of the convective instability). Further sources of uncertainity are represented by the description of destruction process of the newly formed dust particles in the expanding ejecta of SNe and details of the SFH adopted. On general grounds, we conclude that metal-poor AGB stars are not expected to be the main dust contributors, when describing low-metallicity () galaxies, at all cosmic epochs/redshifts, and that the dominant dust factorries are stars of higher mass, exploding as supernovae. This is significantly different from the results obtained for higher metallicities, which show that the contribution from low and intermediate mass stars to the overall dust budget may reach . Detailed models of dust from AGB stars and SNe are crucial for the general understanding of stellar dust production in the Universe.
Acknowledgments
The authors are indebted to the anonymous referee for the careful reading of the manuscript and for the several comments, that help improving significantly the quality of this work. FDA and DAGH acknowledge support from the State Research Agency (AEI) of the Spanish Ministry of Science, Innovation and Universities (MCIU) and the European Regional Development Fund (FEDER) under grant AYA2017-88254-P. DK acknowledges support from the Macquarie University New Staff Scheme funding (MQNS 63822571).
References
- Arnould et al. (1999) Arnould M., Goriely S., Jorissen A., 1999, A&A, 347, 572
- Becker & Iben (1979) Becker S. A., Iben, I. Jr. 1979, ApJ, 232, 831
- Bertoldi (2003) Bertoldi F., Cox P., Neri R., et al. 2003, A&A, 409, L47
- Bianchi & Schneider (2007) Bianchi, S., & Schneider, R. 2007, MNRAS, 378, 973
- Blöcker (1995) Blöcker T., 1995, A&A, 297, 727
- Blöcker & Schönberner (1991) Blöcker T., Schönberner D., 1991, A&A, 244, L43
- Calura et al. (2014) Calura, F., Gilli, R., Vignali, C., et al. 2014, MNRAS, 438, 2765
- Canuto & Mazzitelli (1991) Canuto, V. M. C., Mazzitelli, I. 1991, ApJ, 370, 295
- Charbonnel & Lagarde (2010) Charbonnel C., Lagarde N. 2010, A&A, 522, A10
- Cloutman & Eoll (1976) Cloutman L. D., Eoll J. G. 1976, ApJ, 206, 548
- D’Ercole et al. (2008) D’Ercole A., Vesperini E., D’Antona F., McMillan S. L. W., Recchi, S. 2008, MNRAS, 391, 825
- Dell’Agli et al. (2014) Dell’Agli F., Ventura P., García-Hernández D. A., Schneider R., Di Criscienzo M., Brocato E., D’Antona F., Rossi C., 2014, MNRAS, 442, L38
- Dell’Agli et al. (2015a) Dell’Agli F., Ventura P., Schneider R., Di Criscienzo M., García-Hernández D. A., Rossi C., Brocato E. 2015a, MNRAS, 447, 2992
- Dell’Agli et al. (2015b) Dell’Agli F., García-Hernández D. A., Ventura P., Schneider R., Di Criscienzo M., Rossi C. 2015b, MNRAS, 454, 4235
- Dell’Agli et al. (2016) Dell’Agli F., Di Criscienzo M., Boyer M. L., García-Hernández D. A. 2016, MNRAS, 460, 4230
- Dell’Agli et al. (2017) Dell?Agli F., García-Hernández D. A., Schneider R., Ventura P., La Franca F., Valiante R., Marini E., Di Criscienzo M., 2017, MNRAS, 467, 4431
- Dell’Agli et al. (2018a) Dell’Agli F., Di Criscienzo M., Ventura P., Limongi M., García-Hernández D. A., Marini E., Rossi C. 2018a, MNRAS, 479, 5035
- Dell’Agli et al. (2019) Dell’Agli F., Di Criscienzo M., García-Hernández D. A., Ventura P., Limongi M., Marini E., Jones O. C. 2019, MNRAS, 482, 4733
- De Smedt et al. (2014) De Smedt K., Van Winckel H., Kamath D., Karakas A. I., Siess L., Goriely S., Wood P. 2014, A&A, 563, L5
- Di Criscienzo et al. (2013) Di Criscienzo M., Dell’Agli F., Ventura P., Schneider R., Valiante R., La Franca F., Rossi C., Gallerani S., Maiolino, R., 2013, MNRAS, 433, 313
- Dwek (1998) Dwek, E., 1998, ApJ, 501, 643
- Dwek & Cherchneff (2011) Dwek E., & Cherchneff, I. 2011, ApJ, 727, 63
- Ferrarotti & Gail (2001) Ferrarotti A. S., Gail H.-P. 2001, A&A, 371, 133
- Ferrarotti & Gail (2002) Ferrarotti A. S., Gail H.-P. 2002, A&A, 382, 256
- Ferrarotti & Gail (2006) Ferrarotti A. D., Gail H. P. 2006, A&A, 553, 576
- Gail & Sedlmayr (1999) Gail H.-P., Sedlmayr E. 1999, A&A, 347, 594
- Gall et al. (2011a) Gall C., Andersen A. C., & Hjorth J. 2011a, A&A, 528, A13
- Gall et al. (2011b) Gall C., Andersen A. C., & Hjorth J. 2011b, A&A, 528, A14
- Gallerani et al. (2010) Gallerani S. et al., 2010, A&A, 523, A85
- Ginolfi et al. (2018) Ginolfi M., Graziani L., Schneider R., Marassi S., Valiante R., Dell’Agli F., Ventura P., Hunt L. K. 2018, MNRAS, 473, 4538
- Grevesse & Sauval (1998) Grevesse N., Sauval A. J, 1998, SSrv, 85, 161
- Herwig (2005) Herwig F., 2005, ARA&A, 43, 435
- Iben (1974) Iben I. Jr. 1974, ARA&A, 12, 215
- Iben (1975) Iben I. Jr. 1975, ApJ, 196, 525
- Iben (1981) Iben I. Jr., 1981, ApJ 246, 278
- Iglesias & Rogers (2006) Iglesias C. A., Rogers F. J., 1996, ApJ, 464, 943
- Karakas (2010) Karakas A. I. 2010, MNRAS, 403, 1413
- Karakas & Lattanzio (2014) Karakas A. I., Lattanzio J. C. 2014, PASA, 31, e030
- Kobayashi et al. (2011) Kobayashi C., Karakas A. I., Umeda H. 2011, MNRAS, 414, 3231
- Kraemer et al. (2017) Kraemer K. E., Sloan G. C., Wood P. R., Jones O. C., Egan M. P. 2017, ApJ, 834, 185
- Kwok et al. (1989) Kwok S., Volk K. M., Hrivnak B. J. 1989, ApJL, 345, L51
- Larson (1998) Larson R. B., 1998, MNRAS, 301, 569
- Lattanzio (1989) Lattanzio J. C. 1989, ApJL, 344, L25
- Maiolino et al. (2004) Maiolino R., Schneider R., Oliva E., Bianchi S., Ferrara A., Mannucci F., Pedani M., Roba Sogorb M., 2004, Nat, 431, 533
- Mancini et al. (2015) Mancini M., Schneider R., Graziani L., et al. 2015, MNRAS, 451, L70
- Marigo (2002) Marigo P. 2002, A&A, 387, 507
- Marigo & Aringer (2009) Marigo P., Aringer B., 2009, A&A, 508, 1538
- Michałowski et al. (2010) Michałowski, M. J., Murphy, E. J., Hjorth, J., et al. 2010, A&A, 522, A15
- Michałowski (2015) Michałowski, M. J. 2015, A&A, 577, A80
- Mowlavi (1999) Mowlavi N. 1999, A&A, 350, 73
- Nanni et al. (2013) Nanni A., Bressan A., Marigo P., Girardi L., 2013, MNRAS, 434, 2390
- Nanni et al. (2014) Nanni A. Bressan A. Marigo P. Girardi L., 2014, MNRAS, 438, 2328
- Nanni et al. (2016) Nanni A., Marigo P., Groenewegen M. A. T., et al. 2016, MNRAS, 462, 1215
- Nanni et al. (2018) Nanni, A., Marigo, P., Girardi, L., Rubele S., Bressan A., Groenewegen M. A. T., Pastorelli G., Aringer B. 2018, MNRAS, 473, 5492
- Nanni (2019) Nanni A. 2019, MNRAS, 482, 4726
- Nenkova et al. (1999) Nenkova M., Ivezić Ž., Elitzur M., 1999, in: LPIContributions 969, Workshop on Thermal Emission Spectroscopy and Analysis of Dust, Disks, and Regoliths, ed. A. Sprague, D. K. Lynch, & M. Sitko (Houston, TX: Lunar and Planetary Institute), 20
- Pipino et al. (2011) Pipino A., Fan X. L., Matteucci F., Calura F., Silva L., Granato G., Maiolino R., 2011, A&A, 525, A61
- Renzini & Voli (1981) Renzini A., Voli M., 1981, A&A, 94, 175
- Romano et al. (2010) Romano D., Karakas A. I., Tosi M., Matteucci F. 2010, A&A, 522, A32
- Romano et al. (2017) Romano D., Matteucci F., Zhang Z.-Y., Papadopoulos P. P., Ivison R. J. 2017, MNRAS, 470, 401
- Sharp & Huebner (1990) Sharp C. M., Huebner, W. F. 1990, ApJS, 72, 417
- Schneider et al. (2014) Schneider R., Valiante R., Ventura P., Dell’Agli F., Di Criscienzo M., Hirashita H., Kemper F. 2014, MNRAS, 442, 1440
- Straniero et al. (1997) Straniero O., Chieffi A., Limongi M., Busso M., Gallino R., Arlandini C. 1997, ApJ, 478, 332
- Valiante et al. (2009) Valiante R., Schneider R., Bianchi S., Andersen A. C. 2009, MNRAS, 397, 1661
- Valiante et al. (2011) Valiante R., Schneider R., Salvadori S., Bianchi S. 2011, MNRAS, 416, 1916
- Valiante et al. (2017) Valiante R., Gioannini L., Schneider R., Matteucci F., Dell’Agli F, Di criscienzo M. 2017, Mem. Sait, 88, 420
- van Aarle et al. (2013) van Aarle E., Van Winckel H., De Smedt K., Kamath D., Wood P. R. 2013, A&A, 554, A106
- van Winckel (2003) van Winckel H. 2003, ARA&A, 41, 391
- Ventura et al. (2001) Ventura P., D’Antona F., Mazzitelli I., Gratton R. 2001, ApJ, 550, L65
- Ventura et al. (2002) Ventura P., D’Antona F., Mazzitelli I. 2002, A&A, 393, 215
- Ventura & D’Antona (2005) Ventura P., D’Antona F., 2005, A&A, 431, 279
- Ventura & D’Antona (2009) Ventura P., D’Antona F., 2009, MNRAS, 499, 835
- Ventura et al. (2001) Ventura P., D’Antona F., Mazzitelli I., Gratton R. 2001, ApJL, 550, L65
- Ventura (2010) Ventura P. 2010, Light Elements in the Universe, 268, 147
- Ventura et al. (2011) Ventura P., Carini R., D’Antona F. 2011, MNRAS, 415, 3865
- Ventura et al. (2012a) Ventura P., Di Criscienzo M., Schneider R., Carini R., Valiante R., D’Antona F., Gallerani S., Maiolino R., Tornambé A., 2012a, MNRAS, 420, 1442
- Ventura et al. (2012b) Ventura P., Di Criscienzo M., Schneider R., Carini R., Valiante R., D’Antona F., Gallerani S., Maiolino R., Tornambé A., 2012b, MNRAS, 424, 2345
- Ventura et al. (2013) Ventura P., Di Criscienzo M., Carini R., D’Antona F., 2013, MNRAS, 431, 3642
- Ventura et al. (2014a) Ventura P., Di Criscienzo M., D’Antona F., Vesperini E., Tailo M., Dell’Agli F., D’Ercole A. 2014a, MNRAS, 437, 3274
- Ventura et al. (2014b) Ventura P., Dell’Agli F., Di Criscienzo M., Schneider R., Rossi C., La Franca F., Gallerani S., Valiante R., 2014b, MNRAS, 439, 977
- Ventura et al. (2015) Ventura P., Karakas A. I., Dell’Agli F., Boyer M. L., García-Hernández D. A., Di Criscienzo M., Schneider R. 2015a, MNRAS, 450, 3181
- Ventura et al. (2015b) Ventura P., Stanghellini L., Dell’Agli F., García-Hernández D. A., Di Criscienzo, M. 2015b, MNRAS, 452, 3679
- Ventura et al. (2016a) Ventura P., Stanghellini L., Di Criscienzo M., García-Hernández D. A., Dell’Agli F. 2016a, MNRAS, 460, 3940
- Ventura et al. (2016b) Ventura P., Karakas A. I., Dell’Agli F., García-Hernández D. A., Boyer M. L., Di Criscienzo, M. 2016b, MNRAS, 457, 1456
- Ventura et al. (2018) Ventura P., Karakas A., Dell’Agli F., García-Hernández D. A., Guzman-Ramirez, L. 2018, MNRAS, 475, 2282
- Ventura & Marigo (2009) Ventura P., Marigo P., 2009, MNRAS, 399, L54
- Ventura & Marigo (2010) Ventura P., Marigo P., 2010, MNRAS, 408, 2476
- Ventura et al. (1998) Ventura P., Zeppieri A., Mazzitelli I., D’Antona F., 1998, A&A, 334, 953
- Vincenzo et al. (2016) Vincenzo F., Belfiore F., Maiolino R., Matteucci F., Ventura, P. 2016, MNRAS, 458, 3466
- Vincenzo & Kobayashi (2018a) Vincenzo F., Kobayashi C. 2018a, A&A, 610, L16
- Vincenzo & Kobayashi (2018b) Vincenzo F., Kobayashi C. 2018b, MNRAS, 478, 155
- Wachter et al. (2002) Wachter A., Schröder K. P., Winters J. M., Arndt T. U., Sedlmayr E., 2002, A&A, 384, 452
- Wachter et al. (2008) Wachter A., Winters J. M., Schröder K. P., Sedlmayr E., 2008, A&A, 486, 497
- Waters (2011) Waters L. B. F. M. 2011, Why Galaxies Care about AGB Stars II: Shining Examples and Common Inhabitants, 445, 227
- Weisz et al. (2014) Weisz D. R., Dolphin A. E., Skillman E. D., Holtzman J., Gilbert K. M., Dalcanton J. J., Williams B. F. 2014, ApJ, 789, 147
- Zhukovska et al. (2008) Zhukovska S., Gail H.-P., Trieloff M., 2008, A&A, 479, 453
- Zhukovska & Henning (2013) Zhukovska S., Henning T., 2013, A&A, 555, 15
- Zhukovska (2014) Zhukovska, S. 2014, A&A, 562, A76
- Zhukovska et al. (2016) Zhukovska, S., Dobbs, C., Jenkins, E. B., & Klessen, R. S. 2016, ApJ, 831, 147