Mixed magnetism, nanoscale electronic segregation and ubiquitous first order transitions in giant magnetocaloric MnFeSiP alloys detected by 55Mn NMR
Abstract
We report on a study on a representative set of Fe2P-based MnFePSi samples by means of 55Mn NMR in both zero and applied magnetic field. The first-order nature of the magnetic transition is demonstrated by truncated order parameter curves with a large value of the local ordered moment at the Curie point, even at compositions where the transition appears second order from magnetic measurements. No weak ferromagnetic order could be detected at Si-poor compositions showing the kinetic arrest phenomenon, but rather the phase separation of fully ferromagnetic domains from volume fractions where Mn spins are fluctuating. The more pronounced decrease of the ordered moment at the sites on approaching , characteristic of the mixed magnetism of these materials, is demonstrated to be driven by a vanishing spin density rather than enhanced spin fluctuations at the -site. An upper limit of is set for the fluctuating Mn moment at the site by the direct detection of a 55Mn NMR resonance peak in the Mn-rich samples above , showing nearly temperature-independent frequency shifts. A sharper secondary peak observed at the same compositions reveals however the disproportionation of a significant -Mn fraction with negligible hyperfine couplings, which retains its diamagnetic character across the transition, down to the lowest available temperatures. Such a diamagnetic fraction qualitatively accounts for the reduced average moment previously reported at large Mn concentrations.
pacs:
76.60.-k, 75.30.Kz, 75.30.Sg, 74.62.DhI Introduction
Magnetic materials showing a first order magnetic transition (FOMT) have been attracting sustained research interest because of their inherent giant magnetocaloric effect, originating from the large entropy change taking place at the transition. The latter is the key to their employment for magnetic refrigeration, whereby the vapor based thermodynamic cycles of traditional refrigerators are replaced by magnetization-demagnetization cycles, which are environment-safer and potentially more efficient. To this end, Fe2P-based MnxFe1.95-xSiyP1-y alloys () are among the most promising materials. Their paramagnetic (PM) to ferromagnetic (FM) FOMT is governed by a magneto-elastic transition taking place at the Curie point, characterized by a sizable variation of the crystal cell parameters without a symmetry change. By varying the composition, can be tuned over a wide temperature interval including room temperature, which makes these systems eligible for real case applications.
Like their parent Fe2P compound, the Mn-Fe-Si-P systems crystallize in the hexagonal space group P6m, with a crystal structure characterized by the stacking of , sites and , sites on alternate layers. The magnetic Fe, Mn ions occupy the and sites, with a marked preference of Mn for site Dung et al. (2011a, 2012), while the and sites are occupied by the non metallic P and Si ions, with a partial preference of Si for sites at . Miao et al. (2014) The magnetism of the ions exhibits an itinerant character witnessed by a fractional magnetic moment at low temperature, as compared to on Mn at the sites, which behave as nearly localized spins. The moment at the sites exhibits a steep drop at , in coincidence with a marked in-plane lattice contraction, partly compensated by an expansion along . The accompanying magneto-elastic transition at fits into the scenario of an enhanced chemical bonding of the atoms, and increased spin itineracy above the FOMT. The coexistence of large Mn moments with weaker and possibly vanishing moments is referred to as mixed magnetism. However, the exact nature of the electronic state of the ions in the PM state is still controversial. X-ray magnetic circular dichroism (XMCD) experiments indicated in fact that the moment quenching above is incomplete, Yibole et al. (2015) in contrast with earlier predictions for a total moment extinction by band structure calculations. Dung et al. (2011b)
The critical temperature and the character of the magneto-elastic transition are strongly affected by the Mn/Fe and Si/P substitutions. An increasing substitution of P with the larger Si ions at the sites gives rise to an in-plane expansion, accompanied by increased - and decreased - minimum distances. In agreement with the tendency observed on crossing the FOMT, this leads to a relative localization of the moments and an enhanced inter-layer exchange coupling, hence a more robust ferromagnetism and an increased are observed. Silicon-poor compositions, on the other hand, yield lower , an unsaturated magnetic moment and strong magnetization hysteresis vs. both temperature and applied field. The latter are manifestations of a kinetically arrested magnetic transition, i.e. a frozen-in metastable state separated from thermodynamic equilibrium by a large free-energy barrier. The kinetic arrest can be however mitigated and eventually suppressed by doping a few percent boron into the sites, producing a qualitatively similar, though more dramatic effect as the Si/P substitution. The progressive substitution of Fe by Mn at the sites at Mn concentrations , on the other hand, depresses and drives a decrease of the ordered moment. Dung et al. (2012) However, the magnetoelastic transition coupled to the FOMT is depressed as well, as witnessed by a smaller step in the lattice parameters. As a consequence, the first order character of the magnetic transition becomes less pronounced.
| Sample | Composition | (K)111From on warming (Fig. 1) . | (K)222From on cooling (Fig. 1). |
|---|---|---|---|
| S1 | Mn1.27Fe0.68Si0.52P0.48 | 286.6(2) | 285.2(2) |
| S2 | Mn1.7Fe0.25Si0.5P0.5 | 178.5(3) | 175.5(3) |
| S3 | MnFe0.95Si0.29P0.71 | 199(1) | 73(3) |
| S4 | MnFe0.95Si0.33P0.67B0.03 | 261.7(3) | 242(1) |
In this paper, we address the study of the magnetic transitions and of mixed magnetism in a representative set of Mn-Fe-Si-P compounds by means of 55Mn nuclear magnetic resonance (NMR). In zero applied field (ZF), 55Mn nuclei resonate in a hyperfine field proportional to the ordered component of the on-site Mn electronic spin, thus probing locally the magnetic order parameter and the electronic configuration of the Mn ions. 55Mn NMR provides complementary information to 57Fe Mössbauer spectroscopy, Jernberg et al. (1984) with a benefit for NMR due to its simpler spectra, yielding a precise determination of the order parameter even in the presence of a broad distribution of hyperfine fields. As seen by a local probe of magnetism, a FOMT appears as a truncated transition, Allodi et al. (2014) i.e. a non-vanishing local moment probed by the hyperfine field and, rather, a phase-separated magnetic state with a vanishing volume of the ordered phase at the transition temperature. The first-order nature of the magnetic transitions in Mn-Fe-Si-P compounds is established by 55Mn NMR even at Mn-rich compositions where a nearly second-order magnetic transition (SOMT) was inferred from magnetization and magneto-caloric effect measurements. The mixed magnetism of these systems is unambiguously ascribed to the vanishing of the spin polarization at the sites in the PM phase, with a very stringent limit for the fluctuating moment set by the comparison of NMR and magnetization data. Moreover, a sizable fraction of diamagnetic manganese, independent of temperature, was found at the -site at compositions. Such a diamagnetic fraction, never reported earlier, seemingly plays a role in the decreasing average moment at increasing reported by neutron scattering and the lower of the Mn-rich compounds.
II Experimental details
II.1 Sample preparation and characterization
The Mn-Fe-Si-P(-B) samples were prepared by ball milling for 10 hours of the binary parent Fe2P compound and high-purity elementary Mn, Fe, red-P, Si (and B, when appropriate), weighed in proper amounts. The resulting fine powder was then pressed into small tablets, sintered for two hours at 1100 and annealed for 20 hours at 850 in Ar atmosphere, and finally cooled down quickly to room temperature, as detailed elsewhere Dung et al. (2011a); Miao et al. (2016a); Thang et al. (2017). The synthesis was targeted at four compositions representative of different regimes in the magnetic response: Mn1.27Fe0.68Si0.52P0.48, Mn1.7Fe0.25Si0.5P0.5, Mn1Fe0.95Si0.29P0.71 and Mn1Fe0.95Si0.33P0.67B0.03, referred to hereafter as S1-S4, respectively. Powders from the same batches of samples S2-S4 have also been the subject of the investigations published in Refs. Miao et al., 2016a, b, c. The sample homogeneity was assessed by powder X-ray diffraction, revealing a single crystal phase belonging to the appropriate P6m space group.
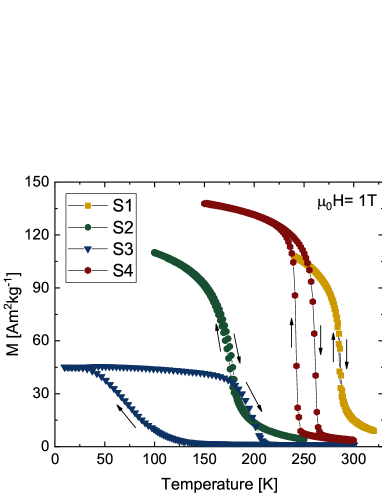
The magnetic characterization of the samples was carried out by a superconducting quantum interference device (SQUID) magnetometer (Quantum Design MPMS-XL) in the 2-350 K temperature range and by a MANICS DSM-8 magnetometer equipped with an oven in the 300-800 K range. The magnetization curves of the four samples, recorded as a function of temperature in an applied field of 1 T, are shown in Fig. 1. Sample S1 shows a sharp transition close to room temperature with negligible hysteresis, making this compound of interest for applications. The Mn-richer S2 shows a reduced and a smoother curve suggesting a SOMT. The Si-poor S3 exhibits a strong temperature hysteresis and an unsaturated magnetic moment characteristic of a kinetically arrested magnetic state. The full magnetization is recovered and thermal hysteresis is nearly suppressed in S4, similar to S3 but for a slight B doping. The transition temperatures of the various samples, determined as the inflection points of , are summarized in Table 1.
II.2 NMR experiments
The NMR experiments were carried out by means of a home-built phase-coherent spectrometer Allodi et al. (2005) and a helium-flow (in the 5-80 K range) or a nitrogen-flow cryostat (70-360 K) on finely powdered samples, in order to maximize the penetration of the radiofrequency (rf) magnetic field. Whenever an intense signal with a large rf enhancement was present, namely in ZF or in a moderate external field applied as a perturbation of the much larger spontaneous hyperfine field, measurements were performed by using a small coil ( nH) wound around the sample and terminated onto a 50 resistor as a probe. The sensitivity penalty of a non-resonant circuit was in fact compensated by the enhancement of the NMR arising from the hyperfine coupling of nuclear and electronic magnetization, characteristic of ferromagnets, Riedi (1989); Turov and Petrov (1972) while the untuned probehead allowed automated frequency scans. A conventional LC resonator was however employed for the weaker resonance lines very close to , in order to improve sensitivity, as well as in all the other cases.
The NMR spectra were recorded by means of a standard spin echoes pulse sequence, with equal rf pulses of intensity and duration optimized for maximum signal, and delay limited by the dead time of the apparatus. Each spin echo, representing one frequency point in the spectrum, was analyzed by taking the maximum magnitude of the Fourier-transformed signal, as detailed elsewhere. Allodi et al. (2014)
| Sample | 111Assumed equal to (see text). | |||
|---|---|---|---|---|
| (MHz) | (MHz) | (measured) | (expected) | |
| S1 | 289.4(2) | 166.2(2) | 0.32(3) | 0.27 |
| S2 | 258.0(2) | 154.2(2) | 0.50(4) | 0.7 |
| S3 | 320.0(1) | 224(1) | 0.04 (1) | 0 |
| S4 | 312.6(2) | 216.2(5) | 0.10 (2) | 0 |
III Experimental results
The 55Mn spectra detected at low-temperature in zero and in a perturbing field, their evolution with temperature, the distinct behavior of the spontaneous field at the two Mn sites on approaching , and the detection of non-magnetic Mn fractions from 55Mn NMR in applied fields, are presented for clarity in separate subsections. Each one addresses specific issues: the assignment of the spontaneous 55Mn NMR peaks to corresponding crystal sites and the local moment probed therein; the order of the magnetic transition and the kinetic arrest phenomenon in silicon-poor compounds; the nature of mixed magnetism; and the electronic state at the site above , respectively.
III.1 Mn moment and site occupancy
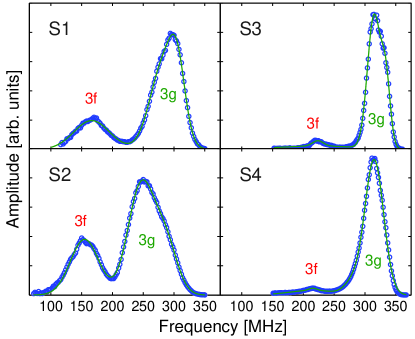
Very intense spontaneous 55Mn NMR signals were detected below by very low rf excitation power, thanks to a sizable enhancement , Riedi (1989) in the typical range of values for the coupling of nuclei to the electronic magnetization in domain walls. The ZF spin echo amplitudes at low temperature (5 K), divided by the frequency-dependent sensitivity (), are plotted vs. frequency in Fig. 2 for all our samples. After such a correction, the plotted quantities correspond to the distributions of hyperfine fields at the 55Mn nuclei. The spectra exhibit two broad peaks with composition-dependent positions and relative weights. The more intense resonance is found in the 260-320 MHz frequency interval (24-30 T in field units), whereas the minority peak, increasing in intensity with increasing Mn concentration, is located in the 150-220 MHz range (14-21 T). Assuming an isotropic hyperfine coupling term in the order of -11 T/ as in manganites Allodi et al. (2014) and in other magnetic compounds, Portis and Lindquist (1965) and neglecting transferred contributions to the contact hyperfine field by neighboring ions, which are known to be very small in these systems, we estimate electronic spin moments of approximately 2.2-2.7 and 1.3-1.9 at the corresponding Mn sites. These values and the relative amplitudes of the two peaks are in qualitative agreement with the determination of the magnetic moment and the Mn occupancy at the two sites by neutron scattering. Dung et al. (2012) The low- and high-frequency 55Mn resonance peaks are therefore unambiguously assigned to Mn nuclei at the and sites, respectively.
The best-fit mean frequencies of the two resonance peaks and the ratios of their integrated amplitudes, corresponding to the relative occupancy of the and sites by Mn, are listed for each sample in Table 2. The amplitude ratios are compared with the values expected for a total preference of Mn for the site, whereby only Mn atoms in excess of 1 per formula unit (FU) occupy sites. It is apparent from samples S3 and S4 (), showing however a small but finite -Mn fraction, that the preferential occupation of sites by Mn is not perfect, and some spillage of Mn and Fe to the disfavored sites occur. The Mn-rich sample S2 (), on the other hand, exhibits a low-moment -Mn fraction significantly smaller than the expected 0.7 value. The missing -Mn ordered fraction in this sample will be commented again in Sec. IV, along with the detection of a sizable amount of non-magnetic Mn ions.
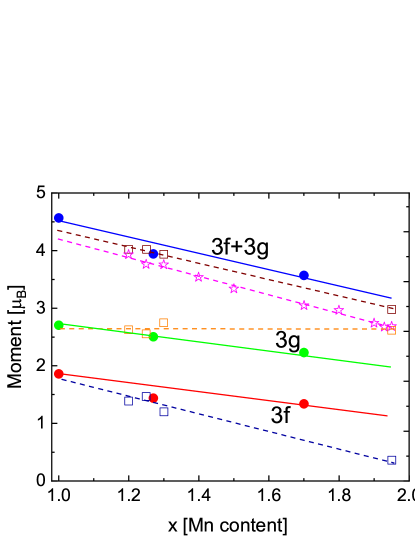
The mean spontaneous NMR frequencies of the and peaks are plotted vs. Mn concentration in Fig. 3, overlaid to the , and overall moment per FU determined by neutron scattering, and to the macroscopic saturation moment per FU reported in the literature for similar compounds. Dung et al. (2012) In the figure, NMR frequencies are scaled to moments by assuming a mean hyperfine field of 11 T/, as stated above. The total moment assessed by 55Mn ZF-NMR is in good agreement with its determinations by the other techniques. The agreement of the and NMR frequencies with the individual and moment values refined by neutrons is however poorer. In particular, NMR shows a similar relative decrease with increasing for the and resonance frequencies, while a constant and a more rapidly decreasing moment were estimated from neutron data.
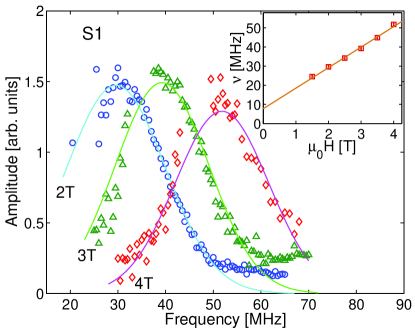
The attribution of both the resonance peaks to 55Mn nuclei (rather than 31P, which also experience a large transferred hyperfine field in the parent Fe2P compound) Koster and Turrell (1971) is further demonstrated by the application of moderate external fields acting as a perturbation of the much larger internal field. Typical spectra in external fields up to a few tesla are shown in Fig. 4 for a representative sample (S1). Both the and mean resonance frequencies shift to lower frequency following a linear dependence on the the applied field
| (1) |
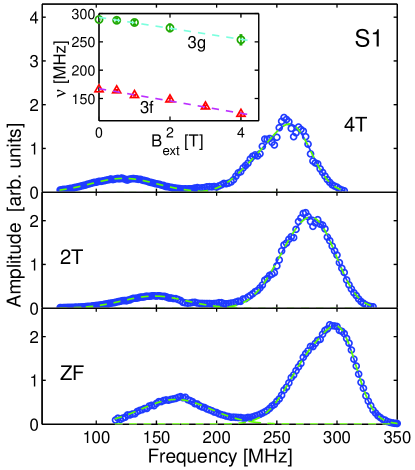
( = , ), where is the isotropic component of the hyperfine field and MHz/T is the gyromagnetic ratio of 55Mn (figure inset). The collinear composition of the isotropic hyperfine field (collinear in turn to the on-site electronic moment) and the external field is demonstrated by the shift with an absolute rate equal to the full 55Mn gyromagnetic ratio , without line splitting or appreciable broadening. The negative sign of indicates that the hyperfine field is antiparallel to the electronic spin, in agreement with the core-polarization mechanism dominant in the contact hyperfine coupling of transition metal ions. Freeman and Watson (1965) All these facts prove therefore the full FM order of both sublattices.
Similar field-dependent spectra were recorded in all samples. In particular, they were detected also in the kinetically arrested S3, which shows a curve saturating in two steps (Fig. 2b of Ref. Miao et al., 2016c), with the full saturation taking place in a field as high as T, and a large hysteresis in below .Miao et al. (2016c) The field dependence of the mean frequency of the majority peak is plotted vs. field in the inset of Fig. 5, overlaid to a plot of the law of Eq. 1 (with slope set equal to the 10.5 MHz/T value of 55Mn). It is apparent from the figure that, above an external field of 2 T corresponding to the saturation of the magnetically ordered domains, the collinear composition of the internal with the external field as of Eq. 1 is obeyed by . The local magnetic order probed by NMR is therefore fully FM in sample S3 as well. In the main panel of Fig. 5 two low temperature spectra are compared, recorded in the same field applied after zero-field cooling (ZFC) and after an isothermal field ramp up to followed by a ramp down to the measuring field, respectively. Clearly, only the signal amplitude is hysteretic vs. field cycles, while the spectra are identical but for a vertical scaling relative to each other. This indicates that the microscopic properties of the magnetically ordered phase are unaffected by the applied fields, and only its volume is increased. These results therefore provide evidence that the unsaturated magnetization of this sample is due to the coexistence of spatially segregated FM and non-FM domains, and that the full moment saturation develops as a field-induced nucleation of FM domains from the competing phase.
III.2 First order transitions and kinetic arrest
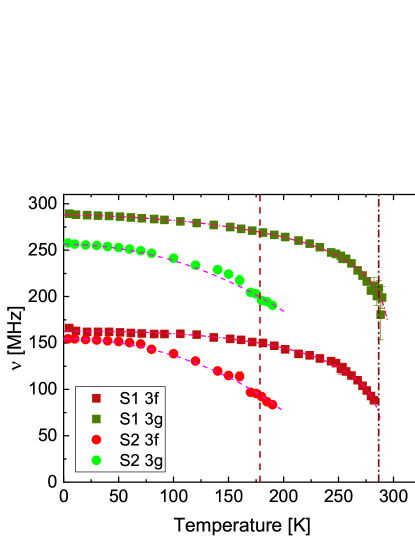
The ZF 55Mn NMR spectra could be recorded up to in all samples. The temperature dependence of the centers of gravity and of the two resonance peaks, proportional to the mean local moments at the two Mn sites, is plotted in Fig. 6 and Fig. 7 for samples S1-S2 and S3-S4, respectively. In the figures, the warming-up higher transition temperatures of Table 1 are marked by vertical dashed lines for reference. It is apparent from the figures that the order parameter curves do not vanish at in any sample. The reduced order parameter at the site is approximately 0.8 at and extrapolates to zero at a significantly higher temperature. This holds true also for samples S2, showing a comparatively small thermal hysteresis and a magnetization vs. temperature dependence resembling that of a SOMT (Fig. 1). These truncated order parameter curves (i.e. not vanishing at ), as seen by a local probe in direct space like NMR, indicate that the magnetically ordered phase does not collapse on warming due to critical spin fluctuations but, rather, to an independent mechanism which abruptly breaks down exchange coupling. The truncation effect is therefore a clear indication of a FOMT. In Fe2P-based alloys, the driving mechanism for the magnetic transition is known to reside in the concomitant magneto-elastic transition at . Similar truncated transitions have been observed e.g. in manganites, Allodi et al. (2014, 2008) where they have been ascribed to the breakdown of half-metallicity and the onset of a polaron phase. Adams et al. (2004)
In order to reconcile the seeming SOMT from magnetization data in sample S2 with the marked first order character apparent from 55Mn NMR, it is worth noting that spontaneous 55Mn resonances are detected in this sample several kelvin above without noticeable anomalies in and (Fig. 6). This behavior indicates the coexistence of a FM and a PM phase over a wide temperature interval across the transition, with the FM fraction surviving above as a minority phase. Therefore, it is the volume fraction of the ordered phase which tends continuously to zero on warming, as a consequence of a broad distribution of critical temperatures for the driving magneto-elastic transition. This interpretation is actually corroborated by X-ray diffraction data, showing a smoother variation of the lattice parameters in this sample, as compared to the step-like jump observed in the other ones.Miao et al. (2016a)
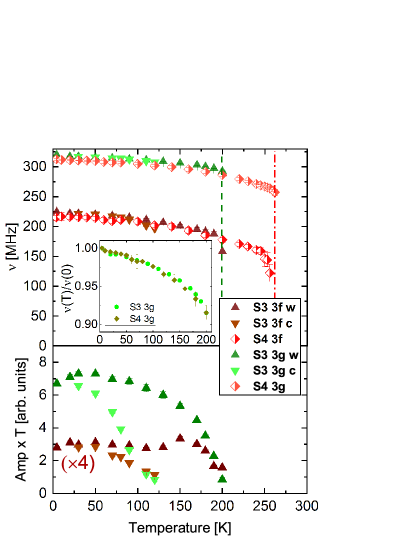
The and order parameter curves of sample S3, showing a marked thermal hysteresis and the kinetic arrest phenomenon, are plotted vs. temperature on both cooling and warming in Fig. 7 (top panel). Very small and negligibly small differences in the values of and , respectively, are detected between the cooling and warming scans, and only close to the lower transition . In the figure, and of S3 are overlaid to the corresponding quantities of sample S4 containing the same nominal amount of Mn but showing in contrast higher , a much narrower hysteresis and the full saturation moment. Notably, the spontaneous NMR frequencies of the two samples follow the same relative dependence of temperature and can be made to overlap by a vertical scaling factor of (figure inset). The near coincidence of the absolute values in these macroscopically very different samples is in essential agreement with the reported finding that the local and moments depend to leading order only on Mn content.Dung et al. (2012); Miao et al. (2014) Their slight difference is probably related to the larger amount of misplaced Mn atoms at the sites found in S4 (Table 2).
The integrals of the NMR signal amplitude of S3 over the and peaks, normalized by the sensitivity proportional to and the Boltzmann factor , are plotted vs. in the bottom panel of Fig. 7. Where the signal loss due to the spin-spin nuclear relaxation is negligible, i.e. far enough from , the plotted quantities are proportional to the number of resonating nuclei, hence to volume of the ordered phase. In contrast to and , the normalized signal amplitude is strongly hysteretic vs. , and its temperature behavior closely reproduces that of . The thermal hysteresis of the magnetically ordered volume therefore agrees with the onset of a net moment by the nucleation of fully FM domains, as also indicated by the similar hysteresis vs. reported above.
Notably, a spin density wave (SDW) was detected in this sample by neutron scattering across , and identified with the competing phase to the FM one. Miao et al. (2016c) No NMR signal component distinct from the two-peak spectrum of Fig. 2c, however, could be detected down to the lowest temperatures. The missed detection of a SDW by our experiments may be due to a number of reasons, involving the different timescales of the two techniques as well as unfavorable experimental conditions for NMR. The SDW might be entirely dynamic in nature as sensed by the slower NMR probe (under this hypothesis, an upper limit may be set to its correlation time), making it indistinguishable from the PM phase. Even if, on the contrary, the SDW is mostly static, it might be subject to sizable and relatively slow () spin or charge excitations, leading to exceedingly fast relaxations which wipe out the NMR signal of 55Mn nuclei therein. Lancaster et al. (2014); Allodi et al. (2001) Finally, the detection of a SDW phase may be hindered by a diminished sensitivity of 55Mn NMR to non-FM signal components, in view of the smaller rf enhancement typically encountered in the latter.
III.3 Mixed magnetism
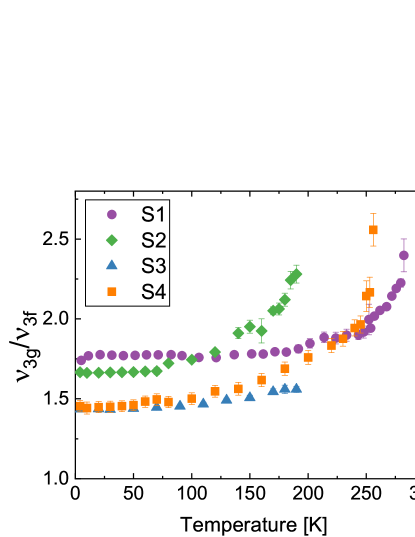
A careful examination of and in the various samples reveals that the two quantities, probing the ordered Mn moments at the and the sites, do not scale with each other as a function of temperature and seemingly behave as independent order parameters. In particular, decreases faster than on warming. This is apparent from Fig. 8, showing a continuous increase of the ratio with temperature in all the four samples and a clear upturn at in samples S1, S2 and S4. The steeper temperature dependence of the ordered moment on approaching , in agreement with previous reports by other techniques, Dung et al. (2012); Yibole et al. (2015), Dung et al. (2011b) is a clear manifestation of the weaker magnetism of the ion, possibly evolving into a non-magnetic state. Its coexistence with the larger and more localized moment is referred to altogether as mixed magnetism, and it is believed to play an important role in the FOMTs of this class of materials. Miao et al. (2016d, b, a, c) Nevertheless, it is clear from Figs. 6 and 7 that also , with the sole possible exception of sample S1, maintains a finite value at , as in a truncated order parameter curve. This particularly evident in the kinetically arrested S3 sample, showing just a moderate increase with temperature in (Fig. 8). Such a quantitatively different behavior may be understood in view of the more marked truncation effect in this sample, whose mean hyperfine frequencies , closely follow those of S4, in spite of the large difference in the transition temperatures of the two compounds. It seems therefore that the FOMT and the drop of the moment are independent phenomena, especially at compositions showing the kinetic arrest like that of S3, and that a non magnetic state of the ion (discussed below) is achieved somewhere above .
The nature of the observed drop of the ordered moment on approaching is demonstrated by nuclear relaxations. Spin-spin relaxation rates , measured in ZF on the two resonance peaks, are plotted vs. temperature in Fig. 9 for a representative sample (S1). Far enough from , is smaller at the site by a factor of 2, in qualitative agreement with the smaller . This experimental ratio is smaller than the value expected from the isotropic hyperfine couplings of the two sites. Such a discrepancy is probably accounted for by anisotropic couplings, which also produce nuclear relaxations without a net effect on the mean resonance frequencies, and which are comparable for the two peaks as indicated by their similar absolute linewidths. Nevertheless, the ratio of at the over the site increases on warming. This rules out enhanced spin fluctuations (due e.g. to weakened exchange interactions) as the origin for the loss of the ordered moment, as the latter would lead to relatively stronger nuclear relaxations on the peak, contrary to evidence. The moment drop is therefore due to the vanishing of the spin polarization and the tendency to a non-magnetic state of the ions, in agreement with ab initio band calculations. Dung et al. (2011b)
III.4 Vanishing moment and diamagnetic Mn
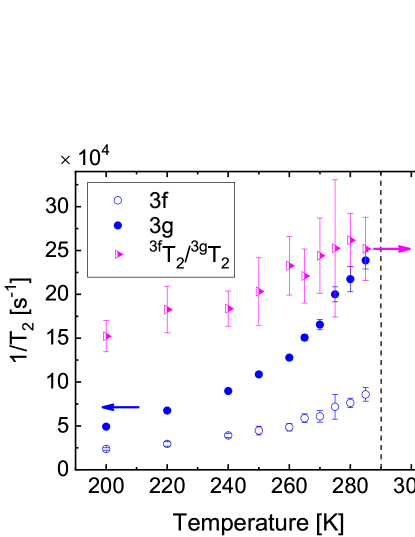
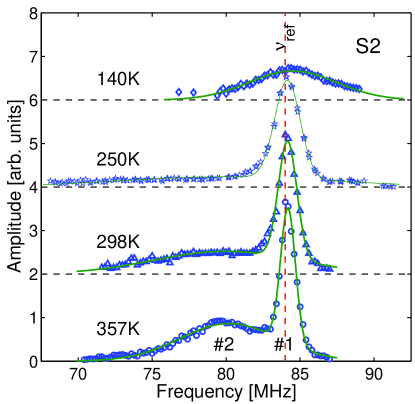
The PM phase at temperatures well above was investigated by 55Mn NMR in an applied field T mostly in sample S2, featuring both a large fraction and relatively low which matches the temperature range of our N2-flow cryostat. A set of 55Mn NMR spectra recorded at several temperatures above is shown in Fig. 10. The highest temperature spectrum (357 K) consists of two well resolved resonance peaks: a sharper line with a small positive shift with respect to the 55Mn reference (83.998 MHz), referred to hereafter as line 1, and a much broader resonance with a negative shift ( MHz in absolute units), referred to as peak 2. The two peaks, whose intensity is not corrected for spin-spin relaxations in the plot, exhibit comparable raw integrated amplitudes. However, line 2 is strongly relaxed, and its measured transverse relaxation time is shorter than the dead-time-limited duration of the spin-echo pulse sequence employed to excite the resonance. The signal loss due to relaxation, on the contrary, is negligible for line 1 (). When the relaxation is accounted for, the corrected amplitude of peak 2 is estimated 4 times larger than that of line 1, which is therefore a minority signal.
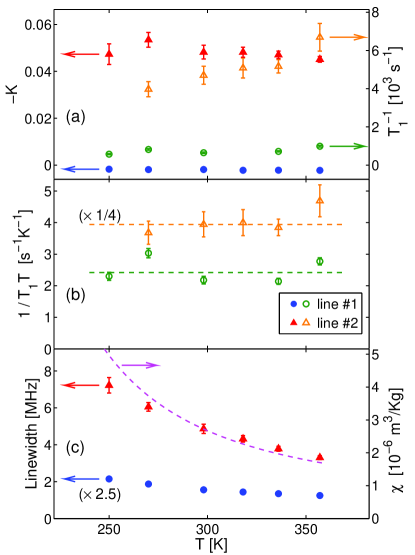
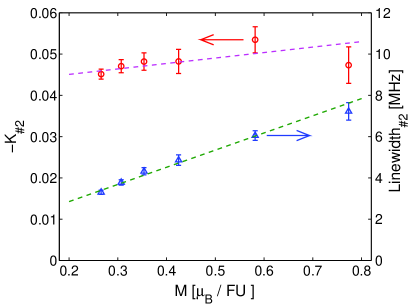
The evolution of the 55Mn NMR spectrum on cooling down to 250 K, a temperature still well above , is summarized by Fig. 11, showing the shifts (panel a) and widths (c) of the two lines as a function of temperature. The spin lattice relaxation rates are also plotted in Fig. 11a, overlaid to the data. On both peaks, they obey the Korringa law typical of metals, Abragam (1961); Slichter (1990) as it is apparent from Fig. 11b, showing Korringa products independent of within experimental accuracy. The rates of peak 2 are larger than on peak 1 by approximately a factor of 7, in agreement with a similar ratio observed in (see above). This indicates, along with the larger linewidth of peak 2, that 55Mn nuclei therein experience stronger interactions with electronic spins. The magnitude of its Gaussian linewidth is much larger than the dipolar contribution, for which a limiting value of approximately 2 MHz is calculated in the FM phase, while its temperature dependence mimics that of the of the magnetic susceptibility (overlaid to the data of Fig. 11c for reference). These two features of demonstrate therefore a sizable anisotropic hyperfine coupling term for the corresponding nuclei. The isotropic hyperfine contact term proportional to the on-site spin density, on the other hand, is probed by the line shift after the subtraction of possible temperature-independent chemical shift terms. Figure 11a clearly shows that the sizable shift of line 2 is nearly independent of temperature, and it is therefore dominated by a chemical shift in the order of -4%. Such a large value demonstrates its origin from low-lying excited crystal field states via the van Vleck mechanism,Nehrke and Pieper (1996) and is comparable to the values found in the non-magnetic ground state of transition metal ions, like e.g. low-spin cobalt. Lancaster et al. (2014) The isotropic hyperfine coupling of these 55Mn nuclei, probed by the residual temperature-dependent component of , can be better estimated by comparison with magnetometry data in the vs. plot of Fig. 12, where temperature is the implicit parameter. The linear fit in the figure extrapolates to a maximal spin-dependent component in for a saturation moment , i.e. a hyperfine field in the virtual magnetically saturated state which would be attained either in much larger magnetic fields or at lower temperature while preserving however the high-temperature electronic and structural properties of the material. Assuming an on-site origin for the electronic polarization at the nucleus, the latter corresponds to a saturation Mn moment of just , according to the core-polarization coupling constant of about demonstrated above by comparing NMR with neutron scattering data. For reference, the extrapolation from the analogous linear dependence of on (shown in Fig. 12 as well) yields an asymptotic linewidth MHz, whence a rms anisotropic hyperfine field T. Such a large value of cannot arise from the tiny on-site spin moment estimated above,Kubo et al. (1969) and must be therefore a transferred contribution from neighboring magnetic ions. Given the presence of a large, though anisotropic, transferred hyperfine field at the corresponding Mn site, a transferred origin cannot be ruled out for its much smaller as well. Therefore, this majority 55Mn NMR signal is compatible with a strictly spinless Mn species. In view of the mixed magnetism detected in these materials by several techniques, including the ZF 55Mn NMR experiments on this exact sample reported in this paper, this resonance is undoubtedly assigned to Mn ions at sites, and it proves that the drop of the spontaneous resonance frequency observed below evolves into a truly non magnetic state in the PM phase. To this end, it is worth noting that the limiting linewidth of peak 2, defined above, coincides numerically with the experimental linewidth of the peak in the low temperature ZF spectrum (Fig. 2). This suggests a common origin from transferred hyperfine interactions, mostly unaffected by the low-temperature transition of the ions to a magnetic state, for the inhomogeneous broadening of line 2 and the ZF- peak.
We now focus on the sharper line 1, arising from a minority Mn fraction, as commented above. It is apparent from Fig. 10 and 11a that its shift , much smaller than and opposite in sign, is practically independent of temperature. Moreover the magnitude of its linewidth , also much smaller than , agrees with a dominant dipolar origin from classical electronic moments. These two facts indicate, respectively, vanishing isotropic and a small anisotropic hyperfine couplings, i.e. a diamagnetic behavior. Indeed, this Mn species does not develop a magnetic ground state on cooling, unlike the majority fraction probed by peak 2, as it is witnessed by the detection of the corresponding resonance safely below , broadened ( MHz at K), but essentially unshifted (Fig. 10). Though a minority diamagnetic Mn fraction, however, its belonging to a non magnetic impurity phase can be safely ruled out. Its amount is estimated in fact as large as atoms per FU from the amplitude of its 55Mn NMR peak relative to peak 2 probing Mn. This figure also supported by its comparison with the intensity of 31P nuclear resonance in this sample, yielding the same estimate. 11131P NMR in these samples is the subject of a distinct investigation and will be reported elsewhere. A spurious phase in such an amount would have been detected by X ray diffraction, contrary to experimental evidence. Moreover its nuclear relaxations are only moderately weaker than on peak 2 and in the typical range of nuclei of non magnetic ions in magnetic materials, like e.g. 139La in lanthanum manganites Allodi et al. (1998, 2001) and cobaltates.Lancaster et al. (2014) This proves that these nuclei experience electronic spin fluctuations and therefore belong to the proper MnFeSiP phase.
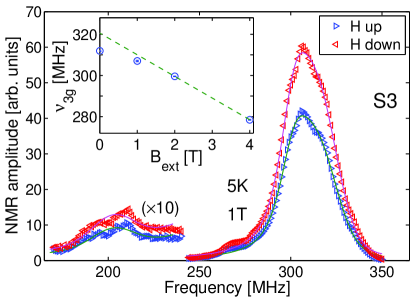
An indication on the origin of this so-called diamagnetic Mn fraction is provided by its systematic search in the other samples. Resonances perfectly similar to lines 1 and 2, except for a larger chemical shift of the former () and overall broader spectra due the vicinity of , were found in sample S1 as well above 290 K up to he highest available temperature (360 K). In such a temperature range, the very large linewidth of peak 2 makes a reliable assessment of its position and amplitude, hence a cross-calibration of the amplitudes of the two peaks, impossible. Qualitatively, the intensity of peak 1 in S1 appears comparable or just slightly smaller than in S2. Its origin from diamagnetic Mn atoms, which retain their non-magnetic character down to the lowest temperature, is confirmed by the 55Mn resonance peaks detected at K in the frequency scans of Fig. 13 in moderate applied fields (so that the corresponding frequency intervals are disjoint from the field-shifted spontaneous resonance). The common origin of these peaks with the high-temperature line 1 is proven by their shift with field according to the 55Mn gyromagnetic ratio (times a small correction for the chemical shift ) and a small positive internal field T, in agreement with the relation
| (2) |
(see Fig. 13 inset). The positive sign of , in contrast with the negative spin hyperfine coupling of transition metal ions arising from core polarization, warrants in fact its transferred origin, compatibly with a spinless Mn state.
The search for signals from non-magnetic Mn at both room and low temperature, on the contrary, was unsuccessful in samples S3 and S4. Based on the estimated sensitivity of our NMR measurements, the missed detection of such signals poses an upper limit to a possible diamagnetic Mn fraction not exceeding 0.01 Mn atoms per FU. Its practical absence in these two samples, incidentally with the same Mn content and hence with a small, if not vanishing, concentration of Mn atoms at the sites (Tables 1, 2), as opposed to its sizable amount found in the Mn-richer S1 and S2 samples, suggests that diamagnetic Mn atoms are located at sites.
IV Discussion and conclusions
ZF 55Mn NMR proves that the magnetic transition of Fe2P based Mn-Fe-Si-P alloys is strongly first order even at a Mn concentration as high as (sample S2), where a SOMT was inferred from a smoother magnetization curve and a shallower magnetic entropy peak at .Dung et al. (2011a) At this composition, however, the truncation effect on the magnetic order parameter, probed locally by the spontaneous 55Mn resonance frequency , is as severe as at other compositions. As already discussed above, the magnetic transition in this compound is actually characterized by a PM-FM phase coexistence over a wide temperature interval, indicative of a broad distribution of driven by a blurred magnetoelastic transition. Although the overall effect of such inhomogeneities on the macroscopic magnetism accidentally mimics a SOMT, it is clear that here the continuous parameter at is the ordered volume instead of the local moment, and that this magnetic transition is not driven by critical fluctuations. Based on this finding for this compound, whose macroscopic response shows the closest resemblance to that of a SOMT, we conclude that no real SOMT can be found in the composition phase diagram of Mn-Fe-Si-P alloys, and therefore FOMTs are a general property of these materials.
Similarly, a phase-separated state, rather than a weak FM structure, is responsible for the kinetically-arrested magnetic order of the Si-poor S3 compound, apparent from its unsaturated and strongly hysteretic magnetization. 55Mn NMR demonstrates that the macroscopic magnetic moment develops by the nucleation of fully FM domains, while only the magnetically ordered volume is hysteretic vs. both temperature and applied field. The competing phase to the FM fraction, identified by neutron scattering with an incommensurate SDW, is possibly dynamic on the comparatively longer timescale of NMR so that it cannot be distinguished from the PM phase.
The mixed magnetism of the Mn-Fe-Si-P systems is detected by NMR through the independent temperature dependence of the ordered moments at the and sites. The drop of the spin polarization at the site on warming up to , and not just its ordered component, is demonstrated by the steeper decrease of the NMR order parameter not accompanied by excess spin fluctuations, as it is witnessed by relatively weaker nuclear relaxations on the resonance peak. The extinction of the moment develops as a progressive reduction over a wide temperature range on warming and it is still incomplete at , as it is apparent by the non-zero value (sample S1, featuring the highest , is a possible exception to the latter behavior). This suggests that the FOMT in these materials, though related to the weakening of the magnetism observed with increasing temperature, is not simply triggered by it. This is particularly evident in the kinetically arrested S3 compound, showing only a moderate reduction of the moment at its upper transition temperature . As already pointed out in Sec. III.3, the stronger truncation effect on its order parameter curve, also involving a phase boundary with an incommensurate SDW phase, might be the clue to the more pronounced decoupling of the moment quenching from the magneto-elastic transition in this sample. Nevertheless, the drop of the moment proceeds up to a spinless state of the ions at temperatures high enough. This is verified directly by 55Mn NMR well above in a strong applied field whenever applicable, namely in the Mn-richer sample S2 (and, with much lower accuracy, S1) showing a significant fraction of sites occupied by Mn ions. The direct detection of a non-magnetic Mn state confirms the initial prediction of a vanishing spin density at the sites by band structure calculations, Dung et al. (2011b) later challenged, however, by XMCD, Yibole et al. (2015) thus solving a long-standing controversy.
Besides the majority fraction of “normal” Mn atoms that develop itinerant magnetism below , a Mn species with even weaker interactions with the surrounding magnetic ions and preserving its non-magnetic character down to the lowest temperatures, is revealed by the same NMR experiments at the same Mn-rich compositions. Though minority, such a diamagnetic fraction, reported in this work for the first time, is sizable ( Mn atoms per FU in S2) and 55Mn nuclei therein experience spin fluctuations. It belongs therefore to the magnetic material under exam and not to an undetected (and unprecedented) non magnetic Mn impurity phase. Indeed, we are not aware of any non magnetic, ionic state of manganese, that are in contrast well documented e.gi̇n cobalt, whose Co3+ ion exhibits a low-spin (i.e. spinless) ground state in a octahedral crystal field. Lancaster et al. (2014); Allodi et al. (2011) The disproportionation of Mn into high-spin and low-spin species at distinct sites, on the other hand, is possible in intermetallic compounds, including metallic manganese itself (-Mn), Hobbs et al. (2003) whose Mn-IV atoms exhibit a nearly spinless state. Yamagata and Asayama (1972) We argue therefore that the diamagnetic Mn state found in these compounds may be driven by a similar spontaneous electronic segregation within the proper Mn-Fe-Si-P phase. To this end, it is worth noting that the Korringa behavior obeyed by both 55Mn species (Fig. 11b), indicating a dominant contribution to their spin-lattice relaxations by band electrons, agrees with the belonging to a metallic phase of the diamagnetic fraction as well. The lack of a significant diamagnetic Mn signal in the Mn-poorer S3 and S4 compounds where no Mn occupancy of sites by Mn is expected (and a small one is detected by ZF NMR) indicates that diamagnetic Mn as well occupy sites. In this view the electronic segregation, still to be identified, should involve two slightly different states of the ion, weakly magnetic and strictly non magnetic, respectively.
The relevance of a diamagnetic Mn fraction at the sites for the magnetic and magnetocaloric properties of the materials where it is present in a significant amount is unclear so far. However, it accounts qualitatively for some discrepancies found from the ZF 55Mn NMR spectra of the Mn-richer S2 compound (), namely, a to peak intensity ratio smaller than expected (Table 2) and, on the contrary, a larger estimate for moment than neutron scattering (Fig. 3). It is noteworthy that the estimated diamagnetic fraction of sample S2 nearly equals within experimental errors its missing fraction of ordered moments. Sample S1 () also shows a significant diamagnetic Mn fraction. Here the ZF NMR peak amplitude is in fair agreement with its expected value, but this may be the results of a compensation by off-site Mn atoms spilled over from their preferential site, as in sample S4. In the presence of a disproportionation between magnetic and non-magnetic species at the same crystallographic site, on the other hand, a probe in reciprocal space (neutron scattering) yields the average moment at the site, while a probe in direct space (NMR) selectively probes the moment of each magnetic species. This observation, therefore, qualitatively explains the steeper decrease of the ordered moment vs. Mn concentration as determined by neutrons with respect to NMR. We have however no explanation for the opposite relative dependence observed by the two techniques at the site, where a moment decrease is detected by NMR only.
ACKNOWLEDGMENT
This work is part of an Industrial Partnership Program IPP I28 of the Stichting voor Fundamenteel Onderzoek der Materie (FOM), which is financially supported by the Nederlandse Organisatie voor Wetenschappelijk Onderzoek (NWO) and co-financed by BASF Future Business.
References
- Dung et al. (2011a) N. H. Dung, L. Zhang, Z. Q. Ou, and E. Brück, Applied Physics Letters 99, 092511 (2011a), eprint https://doi.org/10.1063/1.3634016, URL https://doi.org/10.1063/1.3634016.
- Dung et al. (2012) N. H. Dung, L. Zhang, Z. Q. Ou, L. Zhao, L. van Eijck, A. M. Mulders, M. Avdeev, E. Suard, N. H. van Dijk, and E. Brück, Phys. Rev. B 86, 045134 (2012), URL https://link.aps.org/doi/10.1103/PhysRevB.86.045134.
- Miao et al. (2014) X. F. Miao, L. Caron, P. Roy, N. H. Dung, L. Zhang, W. A. Kockelmann, R. A. de Groot, N. H. van Dijk, and E. Brück, Phys. Rev. B 89, 174429 (2014), URL https://link.aps.org/doi/10.1103/PhysRevB.89.174429.
- Yibole et al. (2015) H. Yibole, F. Guillou, L. Caron, E. Jiménez, F. M. F. de Groot, P. Roy, R. de Groot, N. H. van Dijk, and E. Brück, Phys. Rev. B 91, 014429 (2015), URL https://link.aps.org/doi/10.1103/PhysRevB.91.014429.
- Dung et al. (2011b) N. H. Dung, Z. Q. Ou, L. Caron, L. Zhang, D. T. Thanh, G. A. De Wijs, R. A. De Groot, K. H. Buschow, and E. Brück, Advanced Energy Materials 1, 1215 (2011b), ISSN 16146832.
- Jernberg et al. (1984) P. Jernberg, A. Yousif, L. Häggström, and Y. Andersson, Journal of Solid State Chemistry 53, 313 (1984), ISSN 0022-4596, URL http://www.sciencedirect.com/science/article/pii/0022459684901087.
- Allodi et al. (2014) G. Allodi, R. D. Renzi, K. Zheng, S. Sanna, A. Sidorenko, C. Baumann, L. Righi, F. Orlandi, and G. Calestani, Journal of Physics: Condensed Matter 26, 266004 (2014), URL http://stacks.iop.org/0953-8984/26/i=26/a=266004.
- Miao et al. (2016a) X. F. Miao, L. Caron, J. Cedervall, P. C. M. Gubbens, P. Dalmas de Réotier, A. Yaouanc, F. Qian, A. R. Wildes, H. Luetkens, A. Amato, et al., Phys. Rev. B 94, 014426 (2016a), URL https://link.aps.org/doi/10.1103/PhysRevB.94.014426.
- Thang et al. (2017) N. V. Thang, H. Yibole, N. H. van Dijk, and E. Brück, Journal of Alloys and Compounds 699, 633 (2017), ISSN 09258388, URL http://dx.doi.org/10.1016/j.jallcom.2016.12.402.
- Miao et al. (2016b) X. Miao, L. Caron, P. Gubbens, A. Yaouanc, P. D. de Réotier, H. Luetkens, A. Amato, N. van Dijk, and E. Brück, Journal of Science: Advanced Materials and Devices 1, 147 (2016b), ISSN 2468-2179, special Issue in Memory of Dr. P.E. BROMMER, URL http://www.sciencedirect.com/science/article/pii/S2468217916300570.
- Miao et al. (2016c) X. F. Miao, Y. Mitsui, A. I. Dugulan, L. Caron, N. V. Thang, P. Manuel, K. Koyama, K. Takahashi, N. H. van Dijk, and E. Brück, Phys. Rev. B 94, 094426 (2016c), URL https://link.aps.org/doi/10.1103/PhysRevB.94.094426.
- Allodi et al. (2005) G. Allodi, A. Banderini, R. De Renzi, and C. Vignali, Rev. Sci. Instrum. 76, 083911 (2005), URL http://scitation.aip.org/content/aip/journal/rsi/76/8/10.1063/1.2009868.
- Riedi (1989) P. C. Riedi, Hyperfine Interact. 49, 335 (1989).
- Turov and Petrov (1972) M. A. Turov and M. P. Petrov, Nuclear Magnetic Resonance in Ferro- and Antiferromagnets (Halsted, New York, 1972).
- Portis and Lindquist (1965) A. M. Portis and R. H. Lindquist, in Magnetism, edited by G. T. Rado and H. Suhl (Academic Press, New York, 1965), vol. IIA.
- Koster and Turrell (1971) E. Koster and B. G. Turrell, Journal of Applied Physics 42, 1314 (1971), eprint https://doi.org/10.1063/1.1660234, URL https://doi.org/10.1063/1.1660234.
- Freeman and Watson (1965) A. J. Freeman and R. E. Watson, in Magnetism, edited by G. T. Rado and H. Suhl (Academic Press, New York, 1965), vol. IIA.
- Allodi et al. (2008) G. Allodi, M. Bimbi, R. De Renzi, C. Baumann, M. Apostu, R. Suryanarayanan, and A. Revcolevschi, Phys. Rev. B 78, 064420 (2008), URL http://link.aps.org/doi/10.1103/PhysRevB.78.064420.
- Adams et al. (2004) C. P. Adams, J. W. Lynn, V. N. Smolyaninova, A. Biswas, R. L. Greene, W. Ratcliff, S.-W. Cheong, Y. M. Mukovskii, and D. A. Shulyatev, Phys. Rev. B 70, 134414 (2004), URL http://link.aps.org/doi/10.1103/PhysRevB.70.134414.
- Lancaster et al. (2014) T. Lancaster, S. R. Giblin, G. Allodi, S. Bordignon, M. Mazzani, R. De Renzi, P. G. Freeman, P. J. Baker, F. L. Pratt, P. Babkevich, et al., Phys. Rev. B 89, 020405(R) (2014), URL https://link.aps.org/doi/10.1103/PhysRevB.89.020405.
- Allodi et al. (2001) G. Allodi, M. Cestelli Guidi, R. De Renzi, A. Caneiro, and L. Pinsard, Phys. Rev. Lett. 87, 127206 (2001), URL https://link.aps.org/doi/10.1103/PhysRevLett.87.127206.
- Miao et al. (2016d) X. Miao, N. Thang, L. Caron, H. Yibole, R. Smith, N. van Dijk, and E. Brück, Scripta Materialia 124, 129 (2016d), ISSN 1359-6462, URL http://www.sciencedirect.com/science/article/pii/S1359646216303190.
- Abragam (1961) A. Abragam, The Principles of Nuclear Magnetism, International series of monographs on physics (Clarendon Press, 1961), ISBN 9780198520146.
- Slichter (1990) C. Slichter, Principles of Magnetic Resonance, Springer series in solid state sciences (Springer-Verlag, 1990), ISBN 3540501576.
- Nehrke and Pieper (1996) K. Nehrke and M. W. Pieper, Phys. Rev. Lett. 76, 1936 (1996), URL https://link.aps.org/doi/10.1103/PhysRevLett.76.1936.
- Kubo et al. (1969) T. Kubo, A. Hirai, and H. Abe, Journal of the Physical Society of Japan 26, 1094 (1969), eprint https://doi.org/10.1143/JPSJ.26.1094, URL https://doi.org/10.1143/JPSJ.26.1094.
- Allodi et al. (1998) G. Allodi, R. De Renzi, F. Licci, and M. W. Pieper, Phys. Rev. Lett. 81, 4736 (1998), URL http://link.aps.org/doi/10.1103/PhysRevLett.81.4736.
- Allodi et al. (2011) G. Allodi, R. De Renzi, S. Agrestini, C. Mazzoli, and M. R. Lees, Phys. Rev. B 83, 104408 (2011), URL https://link.aps.org/doi/10.1103/PhysRevB.83.104408.
- Hobbs et al. (2003) D. Hobbs, J. Hafner, and D. Spišák, Phys. Rev. B 68, 014407 (2003), URL https://link.aps.org/doi/10.1103/PhysRevB.68.014407.
- Yamagata and Asayama (1972) H. Yamagata and K. Asayama, Journal of the Physical Society of Japan 33, 400 (1972), eprint https://doi.org/10.1143/JPSJ.33.400, URL https://doi.org/10.1143/JPSJ.33.400.