Phase space dynamics of a plasma wakefield dechirper for energy spread reduction
Abstract
Plasma-based accelerators have made impressive progress in recent years. However, the beam energy spread obtained in these accelerators is still at level, nearly one order of magnitude larger than what is needed for challenging applications like coherent light sources or colliders. In plasma accelerators, the beam energy spread is mainly dominated by its energy chirp (longitudinally correlated energy spread). Here we demonstrate that when an initially chirped electron beam from a linac with a proper current profile is sent through a low-density plasma structure, the self wake of the beam can significantly reduce its energy chirp and the overall energy spread. The resolution-limited energy spectrum measurements show at least a threefold reduction of the beam energy spread from 1.28 to 0.41 FWHM with a dechirping strength of 1 (MV/m)/(mm pC). Refined time-resolved phase space measurements, combined with high-fidelity three-dimensional particle-in-cell simulations, further indicate the real energy spread after the dechirper is only about (FWHM), a factor of 10 reduction of the initial energy spread.
In recent years, great strides have been made in the field of plasma-based wakefield accelerators Mangles et al. (2004); Geddes et al. (2004); Faure et al. (2004); Leemans et al. (2014); Blumenfeld et al. (2007); Litos et al. (2014); Corde et al. (2015); Gessner et al. (2016). However, the energy spread in these accelerators is typically at a few percent level, which is still nearly one order of magnitude larger than that is required in forefront applications like free electron lasers and linear colliders. The beam energy spread in plasma accelerators is usually dominated by a nearly linear energy chirp arising from the relatively broad acceleration phase occupied by the beam. Therefore, reducing the beam energy spread down to percent level requires effective energy chirp reduction in plasma accelerators.
Energy dechirpers based on corrugated wall structures or dielectric-based slab structures have been experimentally demonstrated Emma et al. (2014); Antipov et al. (2014). To date, the typical dechirping strength experimentally obtained in these devices with mm-level gap is 0.01-0.1 (MV/m)/(mm pC) for ps-long electron beams, where is defined as the dechirping field divided by the bunch length and the bunch charge Antipov et al. (2014). The beam produced by a plasma accelerator is typically very short (few fs), and has a relatively large energy chirp (few to 10s MeV). Therefore, it may be impractical to adopt a dechirper with such low . Although theoretical studies indicate that can be improved to 103 (MV/m)/(mm pC) for 10 fs electron beams by reducing the gap size to 10s m level Nie et al. (2018), such small gap may prove to be challenging for beam alignment.

In order to achieve a higher dechirping strength in practice, an alternative approach is to use a tunable plasma dechirper (PD) Y. P. Wu, Proceedings of IPAC 2017 () (2017); Y. P. Wu, Y. C. Du, et al., Proceedings of IPAC 2017, Copenhagen, Denmark pp. 1258-1260 () (2017), as shown schematically in Fig. 1(a). In this scheme, an electron beam with a nearly linear positive energy chirp (Fig. 1(b), the beam energy increases quasi-linearly from head to tail, which is normal for an underloaded wake in a plasma accelerator Li et al. (2013); Manahan et al. (2017)) is sent through a separate low-density plasma section to excite a nearly linear plasma wake Lu et al. (2005). For bunch lengths much shorter than the plasma wavelength, the beam will totally stay in the decelerating phase of the wake where has a negative slope (Fig. 1(c)), where the beam tail experiences a larger energy loss than the head. Therefore, the positive chirp can be effectively eliminated during the propagation (Fig. 1(d)). The total dechirping effects can be easily tuned by changing the density and length of the plasma.
The concept of a PD was first proposeded and experimentally demonstrated by Tsinghua group in 2017, where an energy chirp reduction of factor 1.25 was clearly observed Y. P. Wu, Proceedings of IPAC 2017 () (2017); Y. P. Wu, Y. C. Du, et al., Proceedings of IPAC 2017, Copenhagen, Denmark pp. 1258-1260 () (2017). Very recently, this method has been extended to show a factor 4-6 reduction of the energy chirp through energy spectrum measurement D’Arcy et al. (2019); Shpakov et al. (2019). However, for this method to be really useful for reducing energy spread of electron beams in plasma accelerators down to 0.1 level, a factor 10 reduction of the energy chirp and overall energy spread is needed, where the complex interplay and trade-off among the linear chirp reduction, the nonlinear chirp increase and the slice energy spread growth become critical. In this Letter, we demonstrate a near tenfold beam energy spread reduction in a properly designed beam current profile and PD parameters, and the complex longitudinal phase space dynamics of the dechirping process is clearly revealed through refined time-resolved phase space measurements, in good agreement with high-fidelity three-dimensional (3D) particle-in-cell (PIC) simulations.
To quantify the effects of a PD, we show in Fig. 2 simulation results obtained by full 3D PIC code QuickPIC Huang et al. (2006); An et al. (2013) for three typical beam current profiles (flat-top, parabolic and Gaussian, Fig. 2 (a)). In these simulations, electron beams with a transverse Gaussian profile () are initialized with zero slice energy spread and positive linear chirp (FWHM energy spread ), and the plasma is initialized with a uniform electron density , where is the plasma skin depth.

In Fig. 2(b), the on-axis s (divided by the beam peak current ) are plotted, where a similar linear slope near the beam center is obtained for all three profiles. For the flat-top profile, is close to linear within the whole beam, while for non flat-top profiles, s have nonlinear forms near the head and the tail, which can induce nonlinear energy chirps during the dechirping process. In Fig. 2(c), the radial dependences of s are plotted to show the transverse non-uniformity of the wake, which can induce beam slice energy spread growth during the dechirping process. The final achievable minimum energy spread of the beam is determined by a trade-off among the linear chirp reduction, the nonlinear chirp increase and the slice energy spread growth. In Fig. 2(d), the energy spread (FWHM) reduction versus the product of the propagation distance and the peak current are plotted, where is normalized to . It can be clearly seen that after a distance of about 9.5 (flat-top)/9.2 (parabolic)/10.5 (Gaussian) [kA])-1, the minimum energy spread about 3 (flat-top)/8 (parabolic)/12 (Gaussian) of its initial value can be achieved, which suggests a dechirping factor of 33.3 (flat-top)/12.5 (parabolic)/8.3 (Gaussian). Based on Fig. 2(b), the dechirping strength can be estimated as cm (MV/m)/(mm pC). For a given beam, the plasma wavelength must be larger than the bunch length. For example, for bunch length , plasma densities vary from cm-3 to cm-3 for 10 fs1 ps beams, giving a (MV/m)/(mm pC).
To confirm the above predictions, we have performed a plasma dechirping experiment on the TTX platform at Tsinghua University Du et al. (2011); Hua et al. (2015). The schematic layout is shown in Fig. 3(a). A 40 pC, 1.1 ps (FWHM), 46 MeV electron beam with a positive linear energy chirp is generated by a high brightness S-band RF linac. The bunch charge is set by tuning the energy of the 300 fs (FWHM), 266 nm photocathode drive laser. The bunch length is achieved through velocity compression in this photogun by launching the beam at low phase Zhang et al. (2014). The positive energy chirp is imprinted by off-crest acceleration in the accelerating tube. The electron beam is focused to a transverse size m (Fig. 3(b)) at the front edge of a slit gas jet by two triplets, and detected by a removable OTR screen (Screen1 in Fig. 3(a)). The normalized emittance of the beam is measured to be mm mrad by using a two-screen method (Screen1 and Screen2 about 2 m downstream) Zhang and Zhuang (1998). The beam longitudinal phase space is measured on another YAG:Ce screen (Screen3 in Fig. 3(a)) by using a RF deflecting cavity (temporal resolution 0.4 ps FWHM) and a dipole magnet, as shown in Fig. 3(c). By combining the longitudinal phase space measurement with beam vertical distribution (deflecting cavity off), the beam current profile can be obtained through deconvolution, as shown in Fig. 3(d). We note that this profile is similar to a parabolic distribution, and a plasma density cm-3 should be used to ensure the monotonicity of dechirping field within the beam.
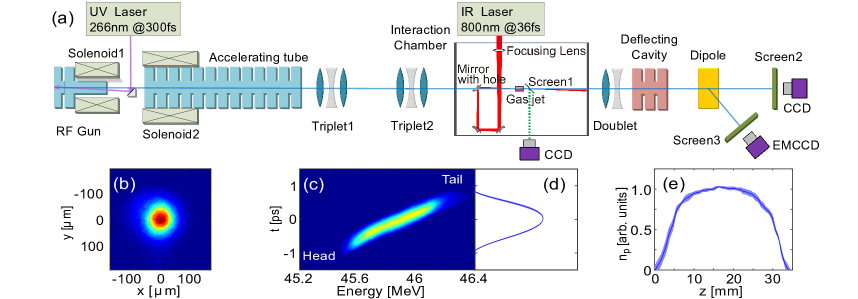
To generate a low-density plasma with cm-3, a method based on laser ionization of a mixed gas ( H2 + He) is used, where the laser intensity is chosen properly to just ionize the hydrogen atoms. The longitudinal gas profile from the slit gas jet (30 mm by 2 mm) was measured off line using shearing interferometry by a wavefront sensor Chanteloup (2005) with Argon gas, as shown in Fig. 3 (d). A fs (FWHM) 800 nm laser pulse is focused to a waist size m by a lens ( mm) near the center of the slit gas jet. Right after ionization occurs, the plasma approximately has an initial radius and a density in the range cm-3, which is proportional to the backing gas pressure ( MPa). After a proper delay ( 10 ns), the plasma expands to a wider size with a lower density approximately in the range of cm-3. As shown in Ref. Lemos et al. (2013), the plasma expansion rate is dominated by the initial electron temperature induced by the ionization process, and has little dependence on the initial density. As a result, the plasma density after expansion with given delay is approximately proportional to its initial backing pressure .
To demonstrate the dechirping effect with this low-density plasma, the electron beam was sent through a -mm central hole on the final turning mirror of the laser pulse to focus right near the front edge of the gas jet. The laser pulse collinearly propagates with and arrives about ns before the electron beam with a timing jitter of 100 fs Lin et al. (2018). The electron beam has a negligible transverse beam position jitter at the focus ( 3 m), and propagates through the 30 mm-long low-density plasma. Figure 4(a) shows the energy spectrum of the incoming beam on Screen3 after dispersion by the dipole magnet when the plasma is off. Integrated energy spectra of 20 consecutive shots similar to Fig. 4(a) are shown in Fig. 4(e) (the blue band), which gives a FWHM energy spread of 0.59 MeV. Figure 4(b), (c) and (d) show the spectrum of the outcoming beam on Screen3 for three different backing pressures (0.5, 1 and 2 MPa), and the effect of dechirping is evident. The integrated energy spectra are also shown in Fig. 4(e) with different colors, as the gas pressure is increased the energy spread becomes smaller. For MPa, the FWHM energy spread from Fig. 4(e) (the red line) is MeV, which gives a more than threefold reduction in the absolute energy spread, and a reduction in the relative energy spread from to . In these measurements, the horizontal size and the divergence of the beam at the entrance of the dipole limit the energy resolution to about 0.17 MeV (FWHM), and this can be estimated directly from the expanded slice energy spread obtained by longitudinal phase space measurement in Fig. 3(c), where the true slice energy spread is below 0.01 MeV based on simulations of our beamline and measurements of similar beamlines Huang et al. (2010); Feng et al. (2011). Therefore, the threefold reduction in energy spread should be considered only as a lower limit.

To get a deeper insight of the dechirping process, and also to alleviate the effect of the limited energy resolution, we performed refined beam longitudinal phase space measurements, and made detailed comparisons with high-fidelity 3D PIC simulations using the code QuickPIC. Three measured beam longitudinal phase spaces on Screen3 after dechirping with MPa, MPa and MPa are shown in Fig. 5(b), (c) and (d), and the corresponding projected energy spectra are shown in Fig. 5(m) with green, black and red solid lines, where the projected FWHM energy spread for MPa is MeV, very similar to the result obtained from the direct energy spectrum measurement (Fig. 4(e)).
To make comparisons between the high-fidelity simulations and the experimental results, we use beam and plasma parameters in the simulations as close to the experimental conditions as possible. For the beam parameters, the measured current profile (Fig. 3(d)) and the energy chirp deduced from the centroid of the longitudinal phase space (purple line in Fig. 5(a)) are used, and the beam slice energy spread is also set to the upper limit (0.01 MeV FWHM) Huang et al. (2010); Feng et al. (2011). For the plasma parameters, the longitudinal plasma profile is set as the measured distribution in Fig. 3(e), and the plasma density is assumed to be proportional to the backing pressure as discussed before. In Fig. 5(f) through (h), we show the simulated phase spaces on Screen3 obtained by scanning the single free parameter to get a best fit to the experimental measurements ( cm-3 for MPa, therefore cm-3/ cm-3 for MPa/ MPa as discussed before). Here the effect of beam transport through the beamline downstream the plasma is fully taken into account. In Fig. 5(m) we show a direct comparison between the measured (solid) and the simulated (dotted) integrated energy spectra. The agreement between the two is excellent for all three values of . The above comparisons use only one parameter to closely match three longitudinal phase spaces and integrated energy spectra, giving us confidence for the value of the plasma density used, which is too low to be directly measured online by interferometry.
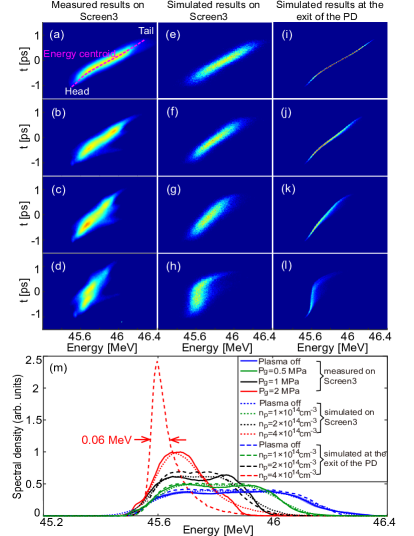
Based on the good agreements above, we can also get valuable information on the exact beam energy spread after the PD, which can not be directly measured due to the limited energy resolution about 0.17 MeV. Figure 5(i) through (l) plot the simulated longitudinal phase spaces just at the exit of the PD for the cases of plasma off, cm-3, cm-3 and cm-3, respectively. One can see that during the whole dechirping process, the slice energy spread increases slightly from its initial value (0.01 MeV) to less than 0.04 MeV (0.02 MeV for cm-3, 0.03 MeV for cm-3 and 0.04 MeV for cm-3). The integrated energy spectra for these three cases are also shown in Fig. 5(m) with green, black and red dashed lines. For cm-3/ cm-3, the three green/black lines (solid for measured on Screen3, dotted for simulated on Screen3 and dashed for simulated at the exit of the PD) match each other well, suggesting that at this density the energy spread is still dominated by the residual energy chirp. However, for cm-3, the dashed red line (simulated energy spectrum at the exit of the PD) shows dramatically narrower spread compared with the other two lower density cases, which strongly suggests that at this density the real energy spread of the beam is much smaller (about MeV) than the resolution-limited measurement (0.19 MeV). Therefore, the above simulations and comparisons with experimental phase space measurements suggest that the FWHM energy spread of the beam has been reduced from MeV to MeV for the case of cm-3, leading to a near tenfold reduction in the relative energy spread (from 1.28 down to 0.13 ). This is also consistent with the simulation predictions of the final achievable minimum energy spread shown in Fig. 2(d) when a parabolic current profile is used. Furthermore, the simulated field in this case has a maximum strength of MV/m. Combining with the bunch charge and length in our experiment, this yields a dechirping strength of (MV/m)/(mm pC), one to two orders of magnitude higher than those obtained using corrugated wall devices or dielectric-based slab structures as dechirpers for similar beams Emma et al. (2014); Antipov et al. (2014).
In this experiment, to resolve the beam longitudinal phase space with a resolution-limited deflecting cavity, a relatively long bunch length ( 1.1 ps FWHM) is used. These experimental results can be properly scaled for much shorter beams typically obtained in a plasma accelerator. For example, for a 10 fs electron beam, roughly ten thousand times higher plasma density should be used ( cm-3) for the PD, and the corresponding dechirping strength is increased by a factor of according to previous analyses.
In summary, a PD scheme based on the beam’s self-generated linear wake in a low-density plasma is proposed and experimentally demonstrated. The experimental results, combined with high-fidelity 3D PIC simulations indicate a near tenfold reduction of the beam energy spread from 1.28 to 0.13 FWHM. This tunable and flexible technique can be applied to future plasma-based photon sources and colliders for significantly enhancing the beam quality.
I ACKNOWLEDGMENTS
The authors thank Dr. B. Liu for the support of quadrupole magnets and Dr. W. J. Ma for the support of diamond films for vacuum isolation. This work is supported by the NSFC Grants (No. 11535006, No. 11425521, No. 11775125 and No. 11875175), CAS Center for Excellence in Particle Physics, and the U.S. Department of Energy Grants (No. DE-SC0008491, No. DE-SC0008316 and DE-SC0010064) at UCLA. The numerical simulations were carried out using Sunway TaihuLight cluster at National Supercomputing Center in Wuxi (NSCCWX).
II references
References
- Mangles et al. (2004) S. P. D. Mangles, C. D. Murphy, et al., Nature 431(7008), 535 (2004).
- Geddes et al. (2004) C. G. R. Geddes, C. Toth, et al., Nature 431(7008), 538 (2004).
- Faure et al. (2004) J. Faure, Y. Glinec, et al., Nature 431(7008), 541 (2004).
- Leemans et al. (2014) W. P. Leemans, A. J. Gonsalves, et al., Phys. Rev. Lett 113), 245002 (2014).
- Blumenfeld et al. (2007) I. Blumenfeld et al., Nature 445, 741 (2007).
- Litos et al. (2014) M. Litos, E. Adli, et al., Nature 515(7525), 92 (2014).
- Corde et al. (2015) S. Corde, E. Adli, et al., Nature 524, 442 (2015).
- Gessner et al. (2016) S. Gessner, E. Adli, et al., Nature Communications 7, 11785 (2016).
- Emma et al. (2014) P. Emma, M. Venturini, K. L. F. Bane, G. Stupakov, H. S. Kang, M. S. Chae, J. Hong, C. K. Min, H. Yang, et al., Physical review letters 112, 034801 (2014).
- Antipov et al. (2014) S. Antipov, S. Baturin, C. Jing, M. Fedurin, A. Kanareykin, C. Swinson, P. Schoessow, W. Gai, and A. Zholents, Physical review letters 112, 114801 (2014).
- Nie et al. (2018) Y. Nie, G. Xia, and T. Pacey, Nuclear Instruments and Methods in Physics Research A 909, 271 (2018).
- Y. P. Wu, Proceedings of IPAC 2017 () (2017) Y. P. Wu, Proceedings of IPAC 2017 (2017), URL http://accelconf.web.cern.ch/AccelConf/ipac2017/talks/tuobb1_talk.pdf.
- Y. P. Wu, Y. C. Du, et al., Proceedings of IPAC 2017, Copenhagen, Denmark pp. 1258-1260 () (2017) Y. P. Wu, Y. C. Du, et al., Proceedings of IPAC 2017, Copenhagen, Denmark pp. 1258-1260 (2017), URL http://accelconf.web.cern.ch/AccelConf/ipac2017/papers/tuobb1.pdf.
- Li et al. (2013) F. Li, J. F. Hua, et al., Phys. Rev. Lett. 111, 015003 (2013).
- Manahan et al. (2017) G. G. Manahan, A. F. Habib, P. Scherkl, P. Delinikolas, A. Beaton, A. Knetsch, O. Karger, G. Wittig, T. Heinemann, et al., Nature Communications 8, 15705 (2017).
- Lu et al. (2005) W. Lu, C. Huang, et al., Physics of Plasmas 12, 063101 (2005).
- D’Arcy et al. (2019) R. D’Arcy, S. Wesch, A. Aschikhin, S. Bohlen, C. Behrens, M. J. Garland, L. Goldberg, P. Gonzalez, A. Knetsch, et al., Physical review letters 122, 034801 (2019).
- Shpakov et al. (2019) V. Shpakov, M. P. Anania, M. Bellaveglia, A. Biagioni, F. Bisesto, F. Cardelli, M. Cesarini, E. Chiadroni, A. Cianchi, et al., Physical review letters 122, 114801 (2019).
- Huang et al. (2006) C. Huang et al., J. Phys. Confer. Series 46, 190 (2006).
- An et al. (2013) W. An et al., J. Comput. Phys. 250, 165 (2013).
- Du et al. (2011) Y. C. Du, L. X. Yan, et al., Nuclear Instruments and Methods in Physics Research A 637, S168 (2011).
- Hua et al. (2015) J. F. Hua, L. X. Yan, et al., Chinese Physics C 29, 017001 (2015).
- Zhang et al. (2014) Z. Zhang, Y. Du, et al., Phys. Rev. ST Accel. Beams 17, 032803 (2014).
- Zhang and Zhuang (1998) L. Y. Zhang and J. J. Zhuang, Nuclear Instruments and Methods in Physics Research Section A: Accelerators, Spectrometers, Detectors and Associated Equipment 407, 356 (1998).
- Chanteloup (2005) J.-C. Chanteloup, Applied Optics 44, 1559 (2005).
- Lemos et al. (2013) N. Lemos, T. Grismayer, et al., Physics of Plasmas 20, 063102 (2013).
- Lin et al. (2018) Z. Y. Lin, Y. C. Du, et al., Review of Scientific Instruments 89, 014701 (2018).
- Huang et al. (2010) Z. Huang, A. Brachmann, F. J. Decker, Y. Ding, D. Dowell, P. Emma, J. Frisch, S. Gilevich, G. Hays, et al., Phys. Rev. ST Accel. Beams 13, 020703 (2010).
- Feng et al. (2011) C. Feng, T. Zhang, et al., Phys. Rev. ST Accel. Beams 14, 090701 (2011).