Momentum-space atom correlations in a Mott insulator
Abstract
We report on the investigation of the three-dimensional single-atom-resolved distributions of bosonic Mott insulators in momentum-space. Firstly, we measure the two-body and three-body correlations deep in the Mott regime, finding a perfectly contrasted bunching whose periodicity reproduces the reciprocal lattice. In addition, we show that the two-body correlation length is inversely proportional to the in-trap size of the Mott state with a pre-factor in agreement with the prediction for an incoherent state occupying a uniformly filled lattice. Our findings indicate that the momentum-space correlations of a Mott insulator at small tunnelling is that of a many-body ground-state with Gaussian statistics. Secondly, in the Mott insulating regime with increasing tunnelling, we extract the spectral weight of the quasi-particles from the momentum density profiles. On approaching the transition towards a superfluid, the momentum spread of the spectral weight is found to decrease as a result of the increased mobility of the quasi-particles. While the shapes of the observed spectral weight agree with those predicted by perturbative many-body calculations for homogeneous systems, the fitted mobilities are larger than the theoretical ones, mostly because of the co-existence of various phases in the trap.
I INTRODUCTION
Measuring many-body correlations is central to investigate and reveal the properties of strongly interacting quantum matter cirac2012 . It allows one to test the predictions of simple microscopic models used to understand many-body physics mahan2000 . One paradigmatic example is the Hubbard hamiltonian that describes quantum particles hopping between the sites of a lattice in the presence of interaction. Comparison of the predictions of the Hubbard model with the measured response functions, e.g., the one-particle spectral function damascelli2003 and the dynamical structure factor tranquada1995 , showed its relevance for a large variety of systems, from transition-metal oxides imada1998 and heavy fermions stewart1984 to high- superconductors lee2006 . A direct probe of correlations between individual particles is yet hardly possible to implement in solids. Thanks to single-atom-resolved detection methods ott2016 , quantum gases offer an alternative testbed for many-body theories.
The celebrated Mott transition, a generic metal-to-insulator transition of Hubbard models mott1949 , was investigated with quantum gas microscopes, illustrating the benefits from probing many-body physics at the single particle level. Position-space two-particle correlations in Mott insulators have indeed yielded unprecedented and quantitative observations, such as the reduction of on-site atom fluctuations sherson2010 ; bakr2010 , the string order in low-dimensions endres2011 , the out-of-equilibrium dynamics ma2011 ; cheneau2012 and the anti-ferromagnetic ordering mazurenko2017 ; hilker2017 . On the other hand, the investigation of momentum-space correlations in atomic Mott states are scarce, and in particular there had been no implementation of a single-atom-resolved probe of momentum correlations. Momentum-resolved light scattering techniques were implemented to measure spectral functions stoferle2004 ; clement2009 ; fabbri2012 , and the noise correlation analysis of time-of-flight (TOF) absorption images altman2004 has revealed density correlations in expanding Mott insulators folling2005 ; rom2006 . But these probes have not permitted quantitative studies of correlation functions, including their shape and their width, due to limited resolution in momentum, line-of-sight integration and lack of single-particle sensitivity. Experimental signatures of the contribution of particle-hole excitations to the coherence of a Mott insulator were extracted from the visibility gerbier2005 and the density modulation of TOF distributions spielman2007 . But a momentum-resolved measure of this contribution when approaching the Mott transition, i.e. an observation of the modifications of the spectral weight of the quasi-particles in momentum-space, was not possible. Recently, however, it has become possible to measure momentum space correlations, either in one or two-dimensional geometries using optical imaging bucker2009 ; fang2016 ; preiss2018 , or in three-dimensions with the species metastable Helium (He*), which can be detected at the single atom level hodgman2017 ; cayla2018 .
In this work, we report on using momentum-space single-atom-resolved distributions cayla2018 in He* gaseous Mott insulators to investigate both the average population of the momentum states (i.e., the momentum density) and its fluctuations (through two-body and three-body momentum correlations). Deep in the Mott regime, we observe a perfectly contrasted momentum bunching, with second- and third-order correlation functions whose structure reproduces the reciprocal lattice. Moreover, from the shape of the bunching peaks, we determine the two-particle correlation length in Mott insulators of various in-trap sizes, finding an excellent agreement with ab-initio calculations. These features show that in the limit of vanishing tunnelling the Mott correlations are driven by a Gaussian density operator for bosons uniformly distributed in the lattice sites. From cuts in the three-dimensional (3D) momentum density, we also extract the spectral weight of the Mott quasi-particles. The evolution of when the system approaches the superfluid-to-Mott transition provides a direct signature of the increased spatial coherence of the quasi-particles. At the quantitative level, however, a comparison with perturbative many-body approaches reveals discrepancies which we discuss.
II MOMENTUM SPACE CORRELATION FUNCTIONS OF A MOTT STATE:
THEORY IN A NUTSHELL
A Mott insulator is an insulating phase caused by the presence of strong interactions between particles moving in crystalline structures. Hubbard models provide a microscopic description of the Mott physics based on the interplay between interaction and kinetic energy. When the ratio of the on-site (repulsive) interaction energy to the hopping energy between adjacent lattice sites increases, the ground-state of a Hubbard Hamiltonian undergoes a phase transition from a conductor to a Mott insulator. The Fermi Hubbard model is central for the understanding of metal-insulator transitions in solids when electron-electron interaction are important mott1949 ; imada1998 . Recently quantum gases have permitted the observation of a Mott transition with bosons greiner2002 which is described by the Bose-Hubbard Hamiltonian jaksch1998 ,
| (1) |
where is the annihilation operator of a particle on site labelled and . The critical value for the Mott transition in the 3D Bose-Hubbard Hamiltonian was calculated numerically, and found equal to capogrosso2007 . The properties of the Mott state – such as the amplitude of the gap in the excitation spectrum or the role of particle-hole excitations – change when varying from deep in the insulating regime ) to the value at the phase transition. In a first approximation, these modifications can be viewed as resulting from the contribution of some particle and hole excitations on top of a uniformly filled lattice. In quantum gas experiments, the ratio can be varied continuously by changing the amplitude of the lattice potential, allowing one to investigate the modifications of that many-body ground-state (the Mott Insulator) with a high degree of control greiner2002 . In the following we describe the properties of the Mott state in the momentum-space. To this aim we introduce the momentum-space operators
| (2) |
where the volume of quantization is chosen as the in-trap volume of the gas. As a consequence of the crystalline structure of the lattice, all momentum-space quantities are periodic with the period of the reciprocal lattice where is the lattice spacing, e.g., with where are the orthonormal vectors associated to the lattice and are integers.
II.1 Many-body correlations in a perfect Mott insulator
Deep in the Mott phase at large amplitude of the lattice potential, the tunnelling becomes vanishingly small and it is standard to approximate the many-body ground-state by a “perfect” Mott insulator, i.e., a Mott insulator with no coupling between the sites, . The perfect Mott insulator for the Hamiltonian of Eq. 1 with unity occupation of the lattice site is then . The absence of phase coherence between the lattice sites, , has important consequences on the momentum-space properties. Under these conditions, the correlations between two momentum operators (see Eq. 2) takes the form
| (3) |
The momentum density of a perfect Mott insulator is thus constant, . In addition, the correlations between momentum components separated by more than the inverse of the system size are vanishingly small. On the contrary, the sum in Eq. 3 is non zero for , which implies that some correlations are present in momentum-space even if there are no position-space correlations, a situation similar to that described by the Van Cittert-Zernike theorem in Optics born1993 . Eq. 3 defines the one-particle volume of coherence, i.e., the volume over which the first-order correlation function is non-zero. This momentum-space volume of coherence reflects the distribution of atoms in the lattice.
As pointed out in altman2004 , higher-order momentum-space correlations can reveal some properties of many-body ground-states even when the momentum density is featureless. For instance, bosonic bunching is expected in the two-body correlations associated with finding one particle with a momentum and a second one with a momentum . In the case of the perfect Mott state, that is to say when the tunnelling is zero, the amplitude and the width of the bunching effect can be predicted accurately. Indeed, the atom number per lattice site is then fixed. For a unity occupation of the lattice , the Hamiltonian of Eq. 1 reduces to that of non-interacting particles and is diagonal in the momentum-space basis. As a result, the many-body momentum-space correlations are those of uncorrelated bosons with a Gaussian density operator gardiner2000 . For such a Gaussian many-body ground-state, the Wick decomposition yields . In particular, the amplitude of the two-body correlation at zero particle distance is twice that found for un-correlated particles, . In addition, the shape of the bunching peak provides a quantitative information about the in-trap profile. Its exact shape is set by the term , whose size determines the volume of coherence. Interestingly, higher-order correlation functions are also related to the first-order correlation function when Wick theorem applies (see dall2013 for instance).
II.2 Momentum density and spectral weight of a Mott insulator at finite tunnelling
At finite tunnelling , a more elaborated picture than that of the perfect Mott state must be introduced to account for the kinetic energy term in the Bose-Hubbard Hamiltonian. To do so, various many-body treatments introduce quadratic quantum fluctuations on top of the classical Gutzwiller solution for the “perfect” Mott oosten2001 ; altman2002 ; sengupta2005 . In these approaches, the low-energy excitations of the Mott state are quasi-particles consisting of the combination of a doublon and a hole. At finite , the many-body ground state contains a finite fraction of these particle/hole excitations. In addition, the mobility of the quasi-particles in the lattice restores some phase coherence. These modifications of the many-body ground-state are described by the formalism of the Green function mahan2000 . For our purposes, the Fourier transform of the Green function, i.e., the one-particle spectral function , is of special interest as it is linked to the momentum density of the Mott insulator sengupta2005 , . Replacing by its expression, one finds that the momentum density of the Mott insulator is directly related to , the spectral weight of the quasi-particles:
| (4) |
where is a normalisation factor. The spectral weight quantifies the overlap between the many-body wave-function with one added particle (or hole) and the true excited one-particle (or one-hole) state. In the non-interacting case, is a delta function because a state with one more particle or hole is still an eigenstate of the system. In the correlated case, many momentum eigenstates have a non-zero overlap with the state formed by simply adding a particle or a hole. As a consequence the spectral weight acquires a finite momentum support whose shape reflects these correlations.
The momentum density of the Mott state thus provides a direct probe of its spectral weight . The spectral weight of a homogeneous Mott with unity occupation of the lattice sites can be calculated using perturbative many-body approaches sengupta2005 ; gerbier2005-2 ; freericks2009 . Deep in the Mott regime (), is a small-amplitude oscillating function of period , with the lattice spacing sengupta2005 ; iskin2009 ; freericks2009 . This stems from the presence of a small number of quasi-particles that hop between adjacent lattice sites only. On approaching the Mott transition, the spectral weight is expected to become increasingly peaked around the reciprocal lattice vectors as an added particle (or hole) can tunnel over several lattice sites sengupta2005 ; iskin2009 ; freericks2009 .
III EXPERIMENTAL RESULTS
III.1 Observation of the Mott transition with metastable Helium-4 atoms.
The experimental sequence starts with the production of a Bose-Einstein condensate (BEC) of metastable Helium-4 atoms (4He∗) in a crossed optical trap as described in bouton2015 . The BEC is then loaded into the lowest energy band of a 3D cubic optical lattice with a spacing nm and an amplitude , with the recoil energy cayla2018 . The lattice amplitude is increased linearly at a rate ms-1 while, simultaneously, the intensity of the optical trap is switched off with a linear ramp of duration ms. The residual harmonic potential due to the Gaussian intensity profiles of the orthogonal lattice beams is isotropic with a trapping frequency Hz. We calibrate the amplitude by performing amplitude modulation spectroscopy and we numerically calculate and from the value . The rms uncertainty on is estimated to be 5%.
In the experiment we measure time-of-flight single-atom-resolved distributions in far-field, from which we can calculate the 3D momentum density as well as higher-order correlation between individual atoms. We probe the gas after a time-of-flight of ms with the time- and space-resolved He∗ detector described in nogrette2015 . The He∗ detector reveals the 3D positions of individual 4He∗ atoms in the center-of-mass reference frame with an excellent resolution (see Annex B). Importantly, is larger than the time required to enter the far-field regime of propagation ms for our experimental parameters where is the in-trap total size of the gas. In addition, interaction can be neglected during the expansion as the TOF dynamics is driven by the large trapping frequency (kHz) of the individual lattice sites gerbier2008 . Indeed, in a previous work cayla2018 , we validated quantitatively the assumption of ballistic expansion from the lattice, i.e., where is the momentum of the atom in the lattice, is the measured atom position after a time-of-flight . With the ballistic assumption, the far-field TOF density yields the in-trap momentum density ,
| (5) |
where is the Fourier transform of the Wannier function in each lattice site. We determine numerically in 3D and rescale the measured density according to Eq. 5. Doing so, can be directly compared to the momentum density of the discrete Bose-Hubbard Hamiltonian introduced in the theory section (see Eq. 1).
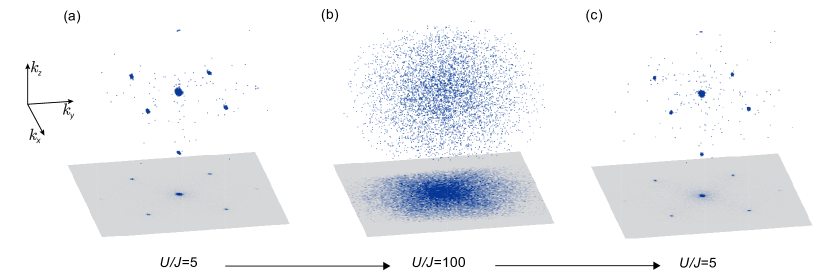
In Fig. 1 we plot examples of 3D TOF distributions across the Mott transition. The Mott transition has been investigated with various atomic species bloch2012 and here we report its observation with metastable Helium-4 atoms which allows us to obtain 3D single-atom-resolved distributions. Each blue dot in Fig. 1 corresponds to one detected atom. In Fig. 1a, the distribution displays sharp diffraction peaks located at , a manifestation of the long-range coherence of the superfluid state at . Deep in the Mott insulating regime (), the phase coherence is lost (see Fig. 1b). By decreasing from the Mott state back to the superfluid regime, the long-range coherence is restored, as illustrated by the high visibility of the diffraction peaks in Fig. 1c. In the following, we focus on the Mott insulator regime using values of the ratio larger than the critical value for the Mott transition capogrosso2007
III.2 Many-body momentum-space correlations deep in the Mott insulating regime
We first discuss the single-atom-resolved distributions measured deep in the Mott insulator regime. As expected, we find that the momentum density (as defined in Eq. 5) is almost constant in this regime. To characterize the fluctuations of the momentum-space population, we introduce the two-particle correlation function defined as (see Annex C for details),
| (6) |
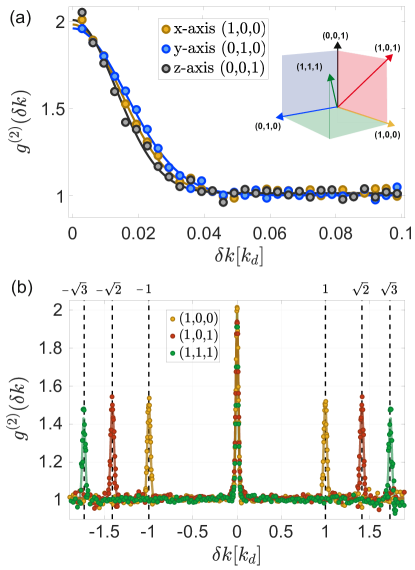
where is the annihilation operator associated to finding a particle at position with the He∗ detector. To facilitate the presentation and the discussion of the two-body correlation function, we plot along some specific directions that can be chosen at will. In Fig. 2, we plot in a Mott insulator with along where are the orthonormal vectors associated to the lattice and , and are equal to 0 or 1. The two-body correlation function is plotted as a function of the difference of momentum between two atoms found along the axis (see Annex C). We find a well contrasted bunching whose amplitude is close to two, as expected for Gaussian statistics. The corresponding large fluctuations in the momentum-space are in contrast with the reduced atom number fluctuations in the lattice sites, as monitored with in-situ quantum gas microscopes in a similar regime of Mott insulator sherson2010 . Note that there has been only a few observations of with massive particles ottl2005 ; dall2013 ; lopes2014 and that none of them was obtained in a 3D isotropic situation. As illustrated in Fig. 2(b), the two-body correlation is 3D-periodic. We find periods equal to , and along the different of the 3D reciprocal lattice associated with the crystalline structure of the ground-state. As we shall explain below, the lower amplitude of the bunching peaks at is due to small imperfections of the He∗ detector.
We now turn to investigating the shape and width of the two-body correlation function. In the vicinity of , we find that is well fitted by an isotropic 3D Gaussian function. This isotropy corresponds to the isotropy of the optical trap created by the lattice beams. The Gaussian-like shape probably results from the spherical distribution of atoms in the lattice and from the absence of sharp edges in the in-trap density. These observations about the isotropy and the shape of the measured two-body correlations lead us to define the two-particle correlation length according to at , where corresponds to the amplitude of the bunching. We find a correlation length for the data of Fig. 2(a).
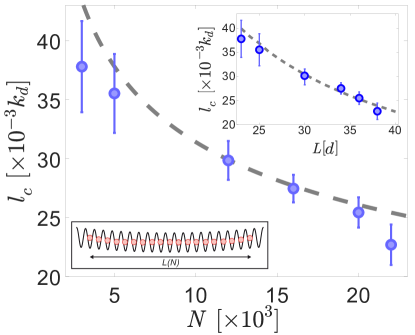
As discussed in the theory section, the two-body correlations of a perfect Mott state are known accurately as one can compute from the sum appearing in Eq. 3. This requires the knowledge of the spatial distribution of atoms in the 3D lattice, which we obtain using the Gutzwiller ansatz for the experimental parameters jaksch1998 . To investigate in the experiment how the shape of is modified when the spatial distribution of the atoms in the 3D lattice varies, we use the low compressibility of the gas: the size of a trapped Mott insulator increases with the atom number as a result of the strong on-site interactions. We have varied the atom number from to and measured the different correlation lengths . Over this range, we note that the lattice filling at the trap center varies from 1 to 2, but numerical calculations of show that the presence of a few doubly-occupied sites at the trap centre hardly affects the value of . In Fig. 3 we plot the measured as a function of the atom number . The two-body correlation length is found to decrease with , as expected from the fact that increases with . We also plot as a function of the size obtained from the Gutzwiller ansatz in the inset of Fig. 3 (see Annex C for details). Moreover, the measured values for are in perfect agreement with numerical calculations without adjustable parameters, i.e., with the expectation for the atom distribution of a Mott state and for a Gaussian density operator. Note that in a thermal gas of non-interacting bosons, the size , and in turn , are independent of . The observed variation of with thus highlights the difference between probing the Mott state and probing an ideal Bose gas dall2013 . As a side remark, we note that an analogy with the Hanbury-Brown and Twiss effect hanbury1956 ; folling2005 can also be used to describe the observed two-body correlations (see Annex A for details).
Proceeding similarly with a Gaussian fit, we measure the two-body correlation length for the peaks of Fig. 2(b) observed at . This value is slightly larger than (measured at ), by a few times . This tiny discrepancy may be explained by small imperfections of the He∗ detector in measuring particle distances comparable to its radius (see for instance jagutzki2002 ; hong2016 and Annex C). While the measured correlation lengths and amplitudes may be affected by the response function of the detector, the 3D integral of the bunching peak, which quantifies the probability for two atoms to bunch, should be a physical quantity conserved through the detection. In a crystalline ground-state as a Mott insulator, atoms are expected to have the same probability to bunch modulo a vector of the reciprocal lattice. This implies that the 3D integrals of the bunching peaks should be equal on the reciprocal lattice. Importantly, we find that this property is verified in the experiment (see Annex C). This implies that the observed amplitude results from the measured correlation length larger than .
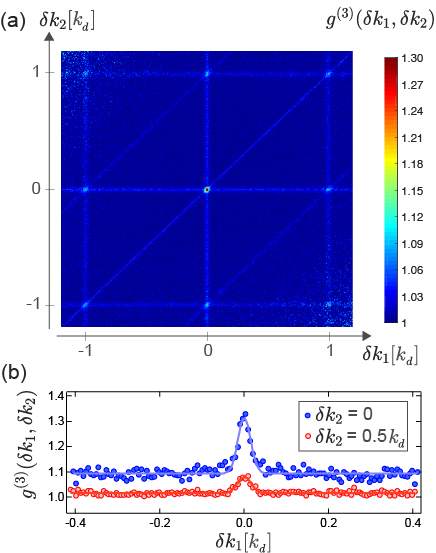
From the measured 3D atom distributions, we can extract higher-order correlations. To illustrate this possibility, we have measured the three-body correlations. We observe a well contrasted and periodic bunching in the three-body correlations whose numerator writes . In Fig. 4(a) we plot as a function of and where and are the differences of momentum between two different pairs of atoms along the lattice axis . The correlations that are intrinsically three-body are those for which three atoms are in the same coherence volume and thus they are located at positions where stands for modulo . We also observe lines with a correlation above the background along the axis defined by , by and by . Along each of these lines, two of the three atoms are close to each other and the correlation amplitude signals two-body bunching. No correlation is observed on the anti-diagonal defined by . This is expected since it corresponds to well separated, thus un-correlated, momentum components. Finally, the ratio of the amplitudes of the intrinsic three-body correlations and the two-body ones is found to be 2.95(40), a value compatible with the expected one for Gaussian statistics dall2013 . Note that this ratio was obtained for transverse integrations () larger than those used in Fig. 2 in order to increase the statistics of the three-body correlations. As a consequence, the measured absolute amplitudes are smaller than the ones expected in the absence of integration (Fig. 4(b)).
III.3 Quasi-particle Spectral weight in a Mott insulator
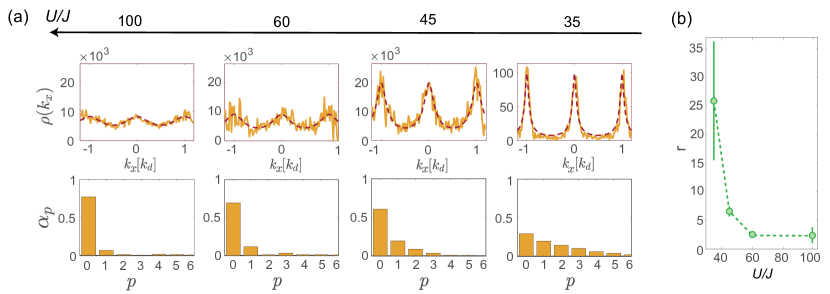
When is decreased, a structure slowly appears in the momentum density. Measuring momentum 3D densities in far-field and without the line-of-sight integration inherent to absorption imaging allows us to investigate this evolution quantitatively. In Fig. 5(a) we plot in the Mott regime along the lattice axis and for a varying ratio . All these data sets have been taken with a fixed atom number to ensure unity occupation of the lattice at the trap center. At large we recover the periodic oscillations observed previously gerbier2005 ; spielman2007 . For decreasing , we observe that , and thus the spectral weight , becomes increasingly peaked around with integer. To provide a physical insight into the narrowing of , we expand in Fourier components along the lattice axis, finding
| (7) |
The Fourier amplitudes quantify the average phase coherence between lattice sites distant by sites. The evolution of the amplitudes as decreases highlights the continuous change from a perfect Mott state (for which for ) to a Mott state with a finite spatial coherence ( for ). Close to the Mott transition, the mobility of the quasi-particles extends over several lattice sites, say distant by sites, and results in . The narrowing of the spectral weight thus reflects the coherent tunnelling of the quasi-particles over several lattice sites. In Fig. 5(a) (bottom row) we plot the Fourier amplitudes extracted from the measured profiles . A mobility of the quasi-particles over up to lattice sites is observed at , a distance corresponding to about a quarter of the size of the trapped gas.
The spectral weight of a homogeneous Mott with unity occupation of the lattice sites was calculated using perturbative many-body approaches sengupta2005 ; gerbier2005-2 ; freericks2009 . It provides a quantitative prediction of the role of particle-hole excitation on the building of long-range coherence which we confront with the experiment. To do so, we fit the measured densities with the equation Eq. (95) of freericks2009 using the numerical parameters associated with a 3D lattice and letting the ratio as a fit parameter (i.e. the parameter of freericks2009 ). The observed modification in the shape of as the system approaches the superfluid regime is consistent with these theoretical predictions (see Fig. 5(a)). As the predicted width and amplitude of the modulations are connected through the dispersion of the lattice, this agreement suggests that the physical picture drawn by perturbative theories is valid.
However, a fully quantitative comparison reveals that is systematically smaller than the ratio calibrated in the experiment. To quantify the discrepancy between theory and experiment, we define a fractional deviation as the ratio and we plot as a function in Fig. 5(b). We find that is large close to the critical ratio and that it decreases as the ratio increases, becoming closer to unity. Our understanding of this observation goes at follows. Close to the Mott transition, the trapped system realised in the experiment is composed of a Mott insulator phase surrounded by a condensate. The later obviously increases the coherence of the trapped system with respect to that predicted by the theory. As increases, the Mott region with unity filling extends over a larger volume in the trap and the outer-shell becomes normal. As a result, should become closer to unity at increasing . However, we do not observe at large , but , a difference that may be related to the increasing difficulty to adiabatically load the atoms in the lattice at increasing . We note that the observed trend for the ratio differs from that found in a previously reported work with a similar quantity, the visibility gerbier2005-2 . This is because the theoretical model we use here, which captures the position of the Mott transition predicted by QMC calculations, is different from that used in gerbier2005-2 .
IV CONCLUSION
We have reported on the measurement of 3D atom distributions in momentum-space for a Mott insulator. It has allowed us to determine quantitatively the build up of long range coherence when approaching the transition towards a superfluid. Deep in the Mott phase, the extracted two- and three-body correlation functions match that of indistinguishable and uncorrelated bosons uniformly distributed in the lattice sites. It shows that the measured correlations are that of a many-body state whose density operator is Gaussian in momentum-space. The results of this work also demonstrate the outstanding capability of our approach to identify Gaussian quantum states. This naturally paves the way to the future investigation of 3D many-body states with many-body correlations deviating from those associated with Gaussian statistics. As illustrated with 1D Bose gases schweigler2017 , these deviations provide genuine information about many-body correlations and have therefore the potential to unveil complex quantum phenomena.
Acknowledgements.
We acknowledge fruitful discussions with D. Boiron, F. Gerbier, T. Roscilde and all the members of the Quantum Gases group at Institut d’Optique. We acknowledge financial support from the LabEx PALM (Grant number ANR-10-LABX-0039), the Région Ile-de-France in the framework of the DIM SIRTEQ and the Agence Nationale pour la Recherche (Grant number ANR-17-CE30-0020-01). D.C. acknowledges support from the Institut Universitaire de France.APPENDIX A: OPTICAL ANALOGY OF THE MOMENTUM-SPACE BUNCHING
The description of the momentum-space two-body correlations we investigate in this work could be rephrased in an optical analogy. Indeed, the momentum-space properties were obtained in a time-of-flight (TOF) experiment where the matter-wave evolves freely in space similarly to the propagation of light. When the expansion of the gas is ballistic and long enough for the paraxial approximation to be valid, the atoms are detected in a regime identical to that of the detection of photons in the far-field. The momentum-space bunching phenomenon can thus be understood from a direct analogy with the Hanbury-Brown and Twiss (HBT) effect reported with incoherent sources of light hanbury1956 or matter schellekens2005 ; folling2005 .
It is also interesting to recall that the properties of the HBT effect in Optics may be derived from a classical model of light with Gaussian statistics goodman1985 . This requires to assume that a large number of mutually-incoherent emitters form the source of light, a condition under which the Central Limit Theorem applies and the field is a Gaussian random process. This assumption is a classical analog of the hypothesis of a Gaussian ground-state we use here, and it highlights the fact that in both situations HBT-type of correlations are connected with Gaussian statistics.
APPENDIX B: ATOM NUMBER CALIBRATION AND HE∗ DETECTOR
Calibration of the atom number in the lattice
The data presented in this work comes from various sets of the experiment:
- •
-
•
a set of data at with atoms, corresponding to a filling at the trap center equal to 2. This larger atom number increases the signal-to-noise ration to measure the two-body correlation length. We checked by performing numerical simulations that the bunching peaks are quite insensitive to the presence of a few doubly-occupied sites and that is dominated by the width of the trapped gas. Taking into account atom number fluctuations in the experiment, the overall data have been divided in 4 sets of data with , , and atoms .
To calibrate the atom number, Mott insulators at were probed by absorption imaging after ms time of flight (TOF). At this lattice amplitude, the momentum distribution is diluted and absorption images can be fitted by a 2D gaussian function from which one can extract the number of atoms.
Detection with the He∗ detector
To access single-atom-resolved momentum distributions, the atoms are detected on the He∗ detector located cm below the center of the science chamber, corresponding to a time of flight of ms. To avoid the effect of spurious magnetic fields that would disturb the time of flight distribution, a fraction of the atoms, initially spin-polarized into the state, are transferred with a radio-frequency (RF) resonant pulse to the non-magnetic state at the beginning of the TOF. The atoms remaining in a state with a non-zero magnetic moment are expelled from the detection area by the use of a magnetic gradient. By adjusting the duration of the RF pulse, the fraction of atoms transferred to the non-magnetic state, in which atoms are detected, can be controlled. To make sure that there is no saturation effect of the He∗ detector, we choose to detect about 5% of the atom number per shot. Between 200 and 2 000 shots were then taken for each specific measurement.
APPENDIX C: CORRELATION FUNCTIONS EXTRACTED FROM THE MEASURED ATOM DISTRIBUTIONS
The measurement of two-particle momentum correlations quantifies the conditional probability for an atom in a given experimental realization to have a momentum provided one atom is detected with a momentum .
| (8) |
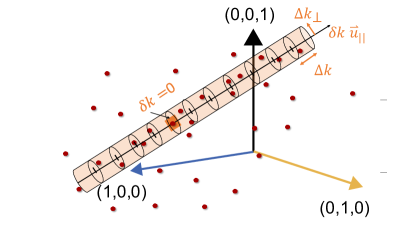
In our experiment, the measurement of the full 3D momentum distribution with single atom sensitivity allows to compute the 3D correlation functions. However, as the representation of the full distribution is intricate, we calculate two-body correlations along some specific directions . These directions can be chosen at will and in the present work they are oriented along the reciprocal lattice vector with , and integers and , and are the lattice axis. The translation invariance of the state we probe implies that depends only on the momentum separation between two particles, e.g. with . We consequently calculate along the lattice direction by integrating over the position of one of the two atoms:
| (9) |
Here the integral refers to the summation over all the atoms present in one shot of the experiment. To increase the signal-to-noise ratio, we also perform a transverse integration:
| (10) |
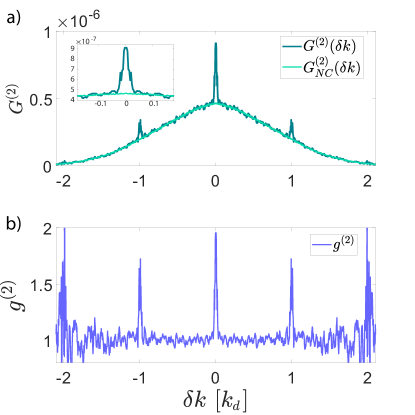
The procedure to calculate is depicted in Fig. 6. For each atom, we define a tube of radius oriented along from which the histogram of the distances from this atom to the ones contained in the tube is recorded. The histograms corresponding to the different atoms of the shots are then summed and averaged over many realizations of the experiment. A plot of measured along the x-axis and corresponding to the data displayed in Fig. 2 is given in Fig. 7a. Three bunching peaks are visible at and on top of a broad background which can be identified as resulting from the Fourier transform of the Wannier function. This background is equal to the autocorrelation of the momentum density of the Mott insulator. It corresponds to the value of the function in the absence of correlation between atoms and later referred as . The ratio divided by yields the normalized two-body correlation function used in the main text. By definition, if there is no correlation in the system and otherwise (see Fig. 7b).
To ensure a proper normalization we calculate with as a procedure similar to that used for but by getting rid off the correlations before performing the calculation of the histogram. Removing the correlations is obtained from considering the atoms belonging to all the shots since there is no correlations between two atoms belonging to two different shots of the experiment. The value of for the same set of data mentioned earlier is given in Fig. 7a.
Effect of transverse integration
The volume of integration may affect the shape of when , , with the correlation length of as defined in the main text. To avoid affecting the size and shape of the correlation peaks, we use . See Tab. 1. Although the transverse integration does not modify the shape of the correlation peaks, it results in decreasing the bunching amplitude defined by . Fig. 8 displays the measured value of as function of , illustrating this assertion.
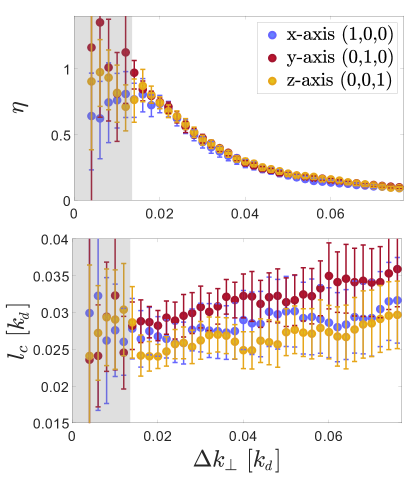
For the data shown in Fig. 2, we use , which is smaller than . At lower transverse integration, the signal becomes too noisy (see Fig. 8). To further increase the signal-to-noise ratio in order to reach a precise measurement of , we use in Fig. 3. Consequently, the bunching amplitude lies between and (see Tab. 1).
| [] | [] | [] | - | |||
|---|---|---|---|---|---|---|
| 23 | 3 | 1 | 0.038 | 0.03 | 0.002 | 0.38 |
| 25 | 5 | 1 | 0.035 | 0.03 | 0.002 | 0.32 |
| 30 | 12 | 2 | 0.03 | 0.03 | 0.001 | 0.51 |
| 34 | 16 | 3 | 0.027 | 0.03 | 0.001 | 0.43 |
| 36 | 20 | 4 | 0.025 | 0.03 | 0.001 | 0.42 |
| 38 | 22 | 4 | 0.023 | 0.03 | 0.001 | 0.40 |
Numerical calculation of the correlation length
The dashed line of Fig. 3 has been obtained numerically with the following procedure. Firstly, we calculate the three-dimensional distribution of atoms from the Gutzwiller ansatz which is valid at large . Secondly, we assume that atoms in the different lattice sites are fully decoupled. The resulting density operator being Gaussian, we can use Wick theorem to show that and thus evaluate numerically from summing the contributions of all the atoms to the one-body correlation . This procedure is identical to that used in folling2005 .
3D integral of the bunching peaks on the reciprocal lattice
As explained in the main text, we find an identical 3D integral for the bunching peaks associated with the reciprocal lattice. The table 2 contains the measured amplitudes and correlation lengths of the different peaks in shown in Fig. 2(b). We also give the values of the ratio between the 3D integrals of the peak located at and that located at the position of the reciprocal lattice, .
| Direction | [1,0,0] | [1,1,0] | [1,1,1] |
|---|---|---|---|
| 0.98(2) | 0.94(3) | 1.0(2) | |
| 0.029(1) | 0.031(1) | 0.026(1) | |
| 0.51(1) | 0.49(1) | 0.45(2) | |
| 0.035(1) | 0.037(2) | 0.033(1) | |
| 1.04(6) | 1.15(8) | 1.12(8) |
As the 3D integral of the bunching peak is found constant at any , the lower amplitude in observed at results from the measured larger correlation length. We stress that the measured increase in the correlation length amounts only to a few times . The capability to measure such a small difference demonstrates the outstanding performances of the He∗ detector. On the other hand, it is most probable that the origin of this tiny discrepancy lies in small imperfections of the He∗ detector.
More specifically, a detector made of Micro-Channel Plates and a delay-line anode – as in the He∗ detector – is better at measuring small distances than large ones between individual particles. Small distortions in the image of a regular pattern were indeed reported on distances comparable with the MCP diameter jagutzki2002 . In addition, a recent investigation with MeV particles has also shown that the uncertainty on the measure of distances of the order of the MCP diameter may be up to 4 times larger than that on the measure of small distances hong2016 . To our knowledge a full understanding of these distortions is missing but several origins for these imperfections have been identified. It includes the inhomogeneity of the electric field on the edges of the MCP and the presence of mechanical imperfections in the delay-line anode – e.g. an imperfect winding of the cables realising the electronic wave-guide.
In our experiment, the resolution with which the position of individual atoms is reconstructed is estimated to be . The increase in the correlation length is compatible with an accuracy to measure large particle separation which is 3 times worse ().
References
- (1) J. I. Cirac and P. Zoller, Goals and opportunities in quantum simulation, Nat. Phys. 8, 264-266 (2012).
- (2) G. D. Mahan, Many-particle physics, Springer (2000).
- (3) A. Damascelli, Z. Hussain and Z. X. Shen,Angle-resolved photoemission studies of the cuprate superconductors, Rev. Mod. Phys. 75, 473–541 (2003).
- (4) J. M. Tranquada, B. J. Sternlieb, J. D. Axe, Y. Nakamura and S. Uchida, Evidence for stripe correlations of spins and holes in copper oxide superconductors, Nature 375, 561-563 (1995).
- (5) M. Imada, A. Fujimori and Y. Tokura, Metal-insulator transitions, Rev. Mod. Phys. 70, 1039 (1998).
- (6) G. R. Stewart, Heavy-fermion systems, Rev. Mod. Phys. 56, 755 (1984).
- (7) P. A. Lee, N. Nagaosa and X.-G. Wen, Doping a Mott insulator: Physics of high-temperature superconductivity, Rev. Mod. Phys. 78, 17 (2006).
- (8) H. Ott, Single atom detection in ultracold quantum gases: a review of current progress, Rep. Prog. Phys. 79, 054401 (2016).
- (9) N. F. Mott, The Basis of the Electron Theory of Metals, with Special Reference to the Transition Metals, Proc. Phys. Soc. (London) A62, 416 (1949).
- (10) J. F. Sherson, C Weitenberg, M. Endres, M. Cheneau, I. Bloch and S. Kuhr, Single-atom-resolved fluorescence imaging of an atomic Mott insulator, Nature 467, 68-72 (2010).
- (11) W. S. Bakr, A. Peng, M.E. Tai, R. Ma, J. Simon, J. I. Gillen, S. Folling, L. Pollet and M. Greiner, Probing the superfluid-to-Mott insulator transition at the single atom level, Science 329, 547-550 (2010).
- (12) M. Endres, M. Cheneau, T. Fukuhara, C. Weitenberg, P. Schauss, C. Gross, L. Mazza, M. C. Banuls, L. Pollet, I. Bloch and S. Kuhr, Observation of Correlated Particle-Hole Pairs and String Order in Low-Dimensional Mott Insulators, Science 334, 200 (2011).
- (13) R. Ma, M Tai, P. Preiss, W. Bakr, J. Simon and M. Greiner, Photon-Assisted Tunneling in a Biased Strongly Correlated Bose Gas, Phys. Rev. Lett. 107, 095301 (2011).
- (14) M. Cheneau, P. Barmettler, D. Poletti, M. Endres, P. Schauß, T. Fukuhara, C. Gross, I. Bloch, C. Kollath and S. Kuhr, Light-cone-like spreading of correlations in a quantum many-body system, Nature 841, 484 (2012).
- (15) A. Mazurenko, C. S. Chiu, G. Ji, M. F. Parsons, M. Kanasz-Nagy, R. Schmidt, F. Grusdt, E. Demler, D. Greif and M. Greiner, A cold-atom Fermi-Hubbard antiferromagnet, Nature 545, 462-466 (2017).
- (16) T. Hilker, G. Salomon, F. Grusdt, A. Omran, M. Boll, E. Demler, I. Bloch, and C. Gross, Revealing hidden antiferromagnetic correlations in doped Hubbard chains via string correlators, Science 357, 484 (2017).
- (17) T. Stoferle, H. Moritz, C. Schori, M. Kohl and T. Esslinger, Transition from a strongly interacting 1D superfluid to a Mott insulator, Phys. Rev. Lett. 92, 130403 (2004).
- (18) D. Clément, N .Fabbri, L. Fallani, C. Fort and M. Inguscio, Exploring Correlated 1D Bose Gases from the Superfluid to the Mott-Insulator State by Inelastic Light Scattering, Phys. Rev. Lett. 102, 155301 (2009).
- (19) N. Fabbri, S. Huber, D. Clément, L. Fallani, C. Fort, M. Inguscio and E. Altman, Quasiparticle Dynamics in a Bose Insulator Probed by Interband Bragg Spectroscopy, Phys. Rev. Lett. 109, 055301 (2012).
- (20) E. Altman, E. Demler and M. l. D. Lukin, Probing many-body states of ultracold atoms via noise correlations, Phys. Rev. A 70, 013603 (2004).
- (21) S. Folling, F. Gerbier, A. Widera, O. Mandel, T. Gericke and I. Bloch, Spatial quantum noise interferometry in expanding ultracold atom clouds, Nature 434, 481–484 (2005).
- (22) T. Rom, T. Best, D. van Oosten, U. Schnieder, S. Folling, B. Paredes and I. Bloch, Free fermion antibunching in a degenerate atomic Fermi gas released from an optical lattice, Nature 444, 733 (2006).
- (23) F. Gerbier, A. Widera, S. Folling, O. Mandel, T. Gericke and I. Bloch, Phase coherence of an atomic Mott insulator, Phys. Rev. Lett. 95, 050404 (2005).
- (24) I. B. Spielman, W. D. Phillips and J. V. Porto, Mott-Insulator Transition in a Two-Dimensional Atomic Bose Gas, Phys. Rev. Lett. 98, 080404 (2007).
- (25) R. Bücker, A. Perrin, S. Manz, T. Betz, C. Koller, T. Plisson, J. Rottmann, T. Schumm and J. Schmiedmayer, Single-particle-sensitive imaging of freely propagating ultracold atoms New J. Phys. 11, 103039 (2009).
- (26) B. Fang, A. Johnson, T. Roscilde, I. Bouchoule, Momentum-Space Correlations of a One-Dimensional Bose Gas, Phys. Rev. Lett. 116, 050402 (2016).
- (27) P. M. Preiss, J. H. Becher, R. Klemt, V. Klinkhamer, A. Bergschneider, S. Jochim, High-Contrast Interference of Ultracold Fermions, arXiv preprint:1811.12939 (2018).
- (28) S. S. Hodgman, R. I. Khakimov, R. J. Lewis-Swan, A. G. Truscott, K. V. Kheruntsyan, Solving the Quantum Many-Body Problem via Correlations Measured with a Momentum Microscope, Phys. Rev. Lett. 118, 240402 (2017).
- (29) H. Cayla, C.Carcy, Q. Bouton, R. Chang, G. Carleo, M. Mancini, D. Clément, Single-atom-resolved probing of lattice gases in momentum space, Phys. Rev. A 97 061609(R) (2018).
- (30) F. Gerbier, A. Widera, S. Folling, O. Mandel, T. Gericke and I. Bloch, Interference pattern and visibility of a Mott insulator, Phys. Rev. A 72, 053606 (2005).
- (31) M. Greiner, O. Mandel, T. Esslinger, T. W. Hansch and I. Bloch, Quantum phase transition from a superfluid to a Mott insulator in a gas of ultracold atoms, Nature 415, 39-44 (2002).
- (32) D. Jaksch, C. Bruder, J. I. Cirac, C. W. Gardiner and P. Zoller, Cold Bosonic Atoms in Optical Lattices, Phys. Rev. Lett. 81, 3108 (1998).
- (33) B. Capogrosso-Sansone, N.V Prokof’ev, B.V. Svistunov, Phase diagram and thermodynamics of the three-dimensional Bose-Hubbard model, Phys. Rev. B 75 134302 (2007).
- (34) M. Born and E. Wolf, Principles of Optics: Electromagnetic Theory of Propagation, Interference and Diffraction of Light, 6th Edition (Chapter 10), Pergamon Press, Oxford, 1993.
- (35) G. W. Gardiner and P. Zoller, Quantum Noise, Springer-Verlag, Berlin, Heidelberg (2000).
- (36) R. G. Dall, A. G. Manning, S. S. Hodgman, W. Rugway, K. V. Kheruntsyan and A. G. Truscott, Ideal n-body correlations with massive particles, Nature Physics 9, 341-344 (2013).
- (37) D. van Oosten, P. van der Straten and H. T. C. Stoof, Quantum phases in an optical lattice, Phys. Rev. A 63, 053601 (2001).
- (38) E. Altman and A. Auerbach, Oscillating Superfluidity of Bosons in Optical Lattices, Phys. Rev. Lett. 89, 250404 (2002).
- (39) K. Sengupta and N. Dupuis, Mott-insulator-to-superfluid transition in the Bose-Hubbard model: A strong-coupling approach, Phys. Rev. A 71, 033629 (2005).
- (40) J. K. Freericks, H. R. Krishnamurthy, Y. Kato, N. Kawashima, and N. Trivedi, Strong-coupling expansion for the momentum distribution of the Bose-Hubbard model with benchmarking against exact numerical results, Phys. Rev. A 79, 053631 (2009).
- (41) M. Iskin and J. K. Freericks, Superfluidity of p-wave and s-wave atomic Fermi gases in optical lattices, Phys. Rev. A 80, 063610 (2009).
- (42) Q. Bouton, Q. Bouton, R. Chang, A. L. Hoendervanger, F. Nogrette, A. Aspect, C. I. Westbrook, and D. Clément, Fast production of Bose-Einstein condensates of metastable Helium, Phys. Rev. A 91, 061402(R) (2015).
- (43) F. Nogrette, D. Heurteau, R. Chang, Q. Bouton, C. I. Westbrook, R. Sellem, and D. Clément, Characterization of a detector chain using a FPGA-based Time-to-Digital Converter to reconstruct the three-dimensional coordinates of single particles at high flux, Rev. Scient. Instrum. 86, 113105 (2015).
- (44) F. Gerbier, S. Trotzky, S. Folling, U. Schnorrberger, J. D. Thompson, A. Widera, I. Bloch, L. Pollet, M. Troyer, B. Capogrosso-Sansone,N.V. Prokofev, and B.V. Svistunov, Expansion of a Quantum Gas Released from an Optical Lattice, Phys. Rev. Lett. 101, 155303 (2008).
- (45) I. Bloch, J. Dalibard, S. Nascimbene, Quantum simulations with ultracold quantum gases, Nature Physics 4, 267-276 (2012).
- (46) A. Ottl, S. Ritter, M. Kohl and T. Esslinger, Correlations and Counting Statistics of an Atom Laser, Phys. Rev. Lett. 95, 090404 (2005).
- (47) R. Lopes, A. Imanaliev, M. Bonneau, J. Ruaudel, M. Cheneau, D. Boiron, and C. I. Westbrook, Second-order coherence of superradiance from a Bose-Einstein condensate, Phys. Rev. A 90, 013615 (2014).
- (48) R. Hanbury-Brown and R. Q. Twiss, Correlations between photons in two coherent beams of light, Nature 177, 27-29 (1956).
- (49) T. Schweigler, V. Kasper, S. Erne, I. Mazets, B. Rauer, F. Cataldini, T. Langen, T. Gasenzer, J. Berges and J. Schmiedmayer, Experimental characterization of a quantum many-body system via higher-order correlations, Nature 545, 323-326 (2017).
- (50) M. Schellekens, R. Hoppeler, A. Perrin, J. Viana Gomes, D. Boiron, A. Aspect, C. I. Westbrook, Hanbury-Brown Twiss Effect for Ultracold Quantum Gases, Science 310, 648-651 (2005).
- (51) J.W. Goodman, Statistical Optics, Wiley classics library, 1985.
- (52) O. Jagutzki, J. Lapington, L. Worth, U. Spillman, V. Mergel, H. Schmidt- Bocking, Position sensitive anodes for MCP read-out using induced charge measurement, Nuclear Instruments and Methods in Physics Research Section A: Accelerators, Spectrometers, Detectors and Associated Equipment 477, 1–3 (2002).
- (53) R. Hong, A. Leredde, Y. Bagdasarova, X. Fléchard, A. García, P. Müller, A. Knecht, E. Liénard, M. Kossin, M. G. Sternberg, H. E. Swanson and D. W. Zumwalta, High accuracy position response calibration method for a micro-channel plate ion detector, Nuclear Instruments and Methods in Physics Research Section A 385, 42-50 (2016).