Cold, old and metal-poor: New stellar substructures
in the Milky Way’s dwarf spheroidals
Abstract
Dwarf spheroidal galaxies (dSph) orbiting the Milky Way are complex objects often with complicated star formation histories and internal dynamics. In this work, we search for stellar substructures in four of the classical dSph satellites of the Milky Way: Sextans, Carina, Leo I, and Leo II. We apply two methods to search for stellar substructure: the minimum spanning tree method, which helps us to find and quantify spatially connected structures, and the “brute-force” method, which is able to find elongated stellar substructures. We detected the previously known substructure in Sextans, and also found a new stellar substructure within Sextans. Furthermore, we identified a new stellar substructure close to the core radius of the Carina dwarf galaxy. We report a detection of one substructure in Leo I and two in Leo II, but we note that we are dealing with a low number of stars in the samples used. Such old stellar substructures in dSph galaxies could help us to shed light on the nature of the dark matter halos, within which such structures form, evolve, and survive.
Subject headings:
galaxies: dwarf — galaxies: evolution — astronomical databases: miscellaneous — methods: data analysis1. Introduction
Dwarf spheroidal galaxies (dSph) are the most common type of galaxies in the Universe and often considered to be the building blocks of more massive galaxies in hierarchical formation scenarios (Dekel & Silk, 1986; Bullock & Johnston, 2005; Cooper et al., 2013; Pillepich et al., 2015). The dSph satellites of the Milky Way (MW) are the best studied dwarf galaxies, since individual stars can be resolved and evolutionary histories can be derived in great detail. A common property of all dSph galaxies is the presence of an old population (stars with ages of Gyr and more), which in many cases turns out to be the dominant population e.g. (Grebel, 2000; Grebel & Gallagher, 2004). There is growing evidence, that some dSphs (e.g., Carina, Fornax, Sculptor, and Sextans) experienced extended star formation histories or multiple episodes of star formation The generally spatially extended old, metal-poor population, and spatially concentrated young, metal-rich population indicate extended star formation episodes in their centers (Harbeck et al., 2001).
Some dSph galaxies also present dynamically cold stellar substructures. For example, Ursa Minor (UMi) shows two distinct density peaks (Kleyna et al., 1998). One represents the underlying galaxy’s field population with a radial velocity dispersion of km s-1. The second density peak appears with a radial velocity dispersion of km s-1. This second peak is located on the north-eastern side of the major axis of UMi at a distance of kpc from UMi’s center. The stars in the vicinity of this peak comprise a kinematically distinct cold sub-population, possibly a disrupted cluster, i.e., a dynamically cold stellar clump.
These clumpy substructures indicate that there is a high degree of complexity already on small scales, which it is also witnessed in other systems (such as in the distribution of the globular clusters in the Fornax dSph), mergers between dwarf galaxies in the local Universe (Amorisco et al., 2014; del Pino et al., 2015) and a possible merger event in the Large Magellanic Cloud (LMC) (Mackey et al., 2016).
Another example is found in Sextans. Kleyna et al. (2004) reported the line-of-sight radial velocity dispersion profile of Sextans based on a sample of stars extending to about kpc from the center of Sextans. They found that the dispersion at the center of Sextans was close to zero, and that such a low value of the dispersion was in agreement with significant radial gradients in the stellar populations. They suggested that this is caused by the sinking and gradual dissolution of a star cluster at the center of Sextans. On the other hand, Walker et al. (2006) presented possible stellar Sextans members. Their data did not confirm Kleyna et al.’s (2004) report of a kinematically distinct stellar population at the center of Sextans with their more complete sample, but they obtained similar evidence if they restricted their analysis to a similarly small number of stars as used by Kleyna et al. (2004). Instead, Walker et al. (2006) detected a region near Sextans’ core radius, which is kinematically colder than the overall Sextans sample with 95% confidence. Very recently, Kim et al. (2019) reported the “possible detection of a relic” globular cluster in Sextans.
Another example is provided by the possibly distinct stellar populations in the Canes Venatici I (CVn I) dSph (Zucker et al., 2006), where Ibata et al. (2006) found two stellar populations with different kinematics: an extended metal-poor ([Fe/H]) component with a velocity dispersion of km s-1, and a more concentrated metal-rich component of extremely low velocity dispersion. On the other hand, Simon & Geha (2007) obtained CVn I member stars that did not reveal any trace of different populations as reported by Ibata et al. (2006). Ural et al. (2010) obtained spectroscopic data for stars in the dSph and investigated whether their data exhibit any evidence of multiple populations as proposed by Ibata et al. (2006) (under the assumption that each population was Gaussian), but no clear signature of distinct sub-populations was found. They argue that the possible detection of a sub-population rather depends on the total number of stars in the data set, the fraction of stars in the sub-population, the difference in velocity dispersion between the populations, and the observational errors.
A final example is the Andromeda II (And II) dSph. McConnachie et al. (2007) identified different stellar populations in And II for which they constructed radial profiles and found that the horizontal branch has a constant spatial distribution out to a large radius. In contrast, they found that the reddest stars on the red giant branch in And II are more centrally concentrated. The latter stellar component has an average age of Gyr and is relative metal-rich ([Fe/H]), leading to a prominent red clump. And, it has to be noted that And II has been identified as having experienced a merger (Amorisco et al., 2014).
The stellar substructures found within dSphs are of great importance, since the survival of stellar substructures within the dark matter (DM) halo of dSphs suggests that dSphs are more in agreement with a cored DM profile, rather than with the cuspy DM profile predicted by the -cold DM model (Lora et al., 2012, 2013; Amorisco, 2017; Contenta et al., 2017).
Using N-body simulations, Lora et al. (2012) and Lora et al. (2013) studied the survival of cold kinematic stellar substructures embedded in the DM halo of the Fornax and Sextans dwarf galaxies -respectively-, against phase mixing. They compared the evolution of the stellar substructures when the dark halo has a core and when it follows the Navarro-Frenk-White (NFW) profile (Navarro et al., 1997). The core in the DM halo mass density distributions is large enough to make the gravitational potential almost harmonic, guaranteeing the survival of the stellar structures mentioned even if the stellar substructure is initially very extended. On the contrary, the stellar substructures are very rapidly destroyed when embedded in a NFW DM profile.
Still, one cannot rule out a scenario where the DM profile of dwarf galaxies was initially cuspy and evolved to a cored DM halo via energy feedback from supernova explosions, stellar winds, and/or star formation (Maschenko et al., 2006; Chen et al., 2016; Pasetto et al., 2010). However, in faint galaxies like Eridanus II and Andromeda XXV (i.e., L⊙ and L⊙, respectively) the formation of large cores via stellar feedback is not obviously expected (Amorisco, 2017). If stellar feedback in faint galaxies is found to be inefficient, then alternative candidates for DM should be seriously considered.
The detection of stellar substructures in dSphs, and the implications of their survival in the core/cusp problem, prompted us to test other dwarf galaxies, and to investigate if we could find stellar substructures within them. From velocities, metallicities, and positions of red giant stars in the Sextans, Carina, Leo I, and Leo II dSphs, we analyze whether or not these dSphs could host dynamically cold debris.
2. The four dwarf spheroidal galaxies
| Parameter | Sextans | Carina | Leo I | Leo II | Ref.a | |
| () | 10h13m03s, -01°1303′′ | 6h40m24.3s, -50°580′′ | 10h8m27.0s, 12°1830′′ | 11h13m29s, 22°912′′ | 1,1,1,1 | |
| Distance | kpc | kpc | kpc | kpc | 2,2,2,2 | |
| MV | mag | mag | -11.9 mag | -9.6 mag | 2,2,3,2 | |
| PA | 57 | 60 | 78 | 12 | 11,11,11,5 | |
| 0.30 | 0.38 | 0.31 | 0.07 | 11,11,11,11 | ||
| Rcore | 20.1 arcmin | 7.97 arcmin | 3.6 arcmin | 2.25 arcmin | 11,11,11,11 | |
| Rtidal | 60.5 arcmin | 58.4 arcmin | 13.5 arcmin | 9.82 arcmin | 11,11,11,11 | |
| vsys | 226 km s-1 | 223.9 km s-1 | 284.2 km s-1 | 79.1 km s-1 | 6,7,8,9 | |
| M/L | 97 | 66 | 24 | 25-50 | 10,10,8,9 | |
| ⟨[Fe/H]⟩ | -1.93 | -1.72 | -1.43 | -1.62 | 6,7,8,9 |
2.1. Sextans
The Sextans dSph is located at a distance of kpc (McConnachie, 2012). It is a diffuse and faint dSph, with mag and mag/sq arcsec (McConnachie, 2012). It has a position angle °and an ellipticity (Muñoz et al., 2018). Battaglia et al. (2011) report the systemic velocity in the heliocentric system of Sextans to be km s-1.
Irwin & Hatzdimitriou (1995) computed a core radius arcmin and a tidal radius arcmin. More recently, Roderick et al. (2016) fitted a King model to the radial distribution of Sextans computing a core radius arcmin and a tidal radius arcmin ( kpc) Muñoz et al. (2018) reported a core radius arcmin and a tidal radius arcmin (see also Cicuendez et al., 2018).
The Sextans dSph is more than Gyr old (Mateo et al., 1991) and it is considered as a metal poor dwarf galaxy (Kirby et al., 2001) with a mean [Fe/H] (Battaglia et al., 2011). Łokas (2009) computed a high mass-to-light-ratio of . Battaglia et al. (2011) computed a . Such a high mass-to-light-ratio indicates that Sextans is a DM-dominated dwarf galaxy.
The existence of stellar substructure in the Sextans dwarf galaxy has been previously studied. For example, Kleyna et al. (2004) found a drop in the stellar velocity dispersion near the center of Sextans, which was interpreted as a dissolving cluster. Some years later, Walker et al. (2006) reported no detection of a kinematically distinct population at the center of Sextans. Instead, they detected a region at a distance arcmin ( pc) from Sextans’ center, corresponding to the core radius reported by Irwin & Hatzdimitriou (1995).
Later, Battaglia et al. (2011) reported the detection of a cold substructure consisting of nine very metal-poor stars close to the center of Sextans.These stars have very similar distances, kinematics, and metallicities. The average metallicity of this 9-star group is [Fe/H] dex with a dex -scatter. This group of stars was taken from the most metal-poor stars, which have a low velocity dispersion ( km s-1) and whose average radial velocity is km s-1. Battaglia et al. (2011) assume that the ratio of the stars in the substructure is representative with respect to their total number of Sextans members ( stars). Thus the substructure would account for % of Sextans stellar population.
Finally, Roderick et al. (2016) reported on photometric evidence of stellar substructures associated with Sextans. The stellar substructures that they find extend out to a distance of arcmin ( kpc) from Sextans’ centre. The existence of such stellar substructures in the outer regions of Sextans might indicate that Sextans is undergoing tidal disruption. However, Roderick et al. (2016) found that the substructures surrounding Sextans appear to be both aligned with, and perpendicular to Sextans’ major axis. The latter suggests that Sextans is not necessarily undergoing a strong tidal disruption. Muñoz et al. (2018) reported a fairly regular morphology in Sextans, with no obvious signs of tidal features.
In contrast, recently Cicuendez et al. (2018) reported signs of past accretion/merger events in Sextans: a ‘ring-like’ feature. They claim that the kinematically detected ring in Sextans bears a morphological resemblance to the stellar stream in the And II dSph (Amorisco et al., 2014), which probably merged with another dwarf galaxy.
2.2. Carina
Carina is located at a heliocentric distance of kpc, with mag and mag/sq arcsec (McConnachie, 2012). It has a position angle °, a core radius arcmin, a tidal radius arcmin, an ellipticity (Muñoz et al., 2018), and a heliocentric systemic velocity km s-1 (Koch et al., 2006).
The large velocity dispersion of Carina is often interpreted as evidence of a large mass-to-light ratio (Mateo et al., 1993). Łokas (2009) found a mass-to-light ratio for Carina of , from where they inferred that Carina’s kinematics is dominated by its DM halo.
Spectroscopic observations of Carina indicate that it has two dominant stellar populations that should be in equilibrium in the same DM halo, and that such a DM halo has a less cuspy inner density profile than previously thought (Hayashi et al., 2018).
The Carina dSph has experienced a complex star formation history. It is the only dSph to exhibit clearly episodic star formation interrupted by long quiescent periods (de Boer et al., 2014; Santana et al., 2016; Hurley-Keller et al., 1998; Monelli, 2003). Its color-magnitude diagram shows three different stellar populations corresponding to , , and Gyr (Monelli, 2003; Bono et al., 2010) and shows a slight population gradient where the more metal rich population is more centrally concentrated in the galaxy (Koch et al., 2006). de Boer et al. (2014) confirmed that the star formation in the Carina dSph is episodic. There are two main episodes of star formation that occurred at Gyr and Gyr (or at Gyr and Gyr according to Monelli, 2014). Monelli (2014) argue that these two episodes of star formation are inconsistent with a simple evolution of an isolated system.
Kordopatis et al. (2016) found that the youngest metal-rich population in Carina is more extended than the intermediate-metallicity population, while generally the metal-rich stellar populations are more spatially concentrated and kinematically colder. To explain this, Sales et al. (2010) argue that strong tidal interaction may play a big role on Carina’s peculiar configuration. In addition to this scenario, Muñoz et al. (2006) detected an extended power-law component in the density distribution of Carina. Such a distribution is a typical signature of disrupted galaxy satellites (e.g. the Sagittarius dSph, Majewski et al. 2003). Moreover, Muñoz et al. (2006) found that the extra-tidal stars around Carina could be related to the LMC, indicating complex interactions.
Fabrizio et al. (2011) presented radial velocity measurements of Carina’s stars and collected spectra of old, intermediate, and young stellar tracers. They detected a maximum in the radial velocity, which they suggest might be reminiscent of a stellar structure located at pc of Carina’s center. Fabrizio et al. (2016) compared observations of the radial velocity distribution of old and intermediate-age stars in the Carina dSph with N-body simulations. They found a good agreement with the ratio in the central regions of the dwarf. The latter indicates that Carina might have been a disky dwarf galaxy that experienced several strong tidal interactions with the MW.
(a)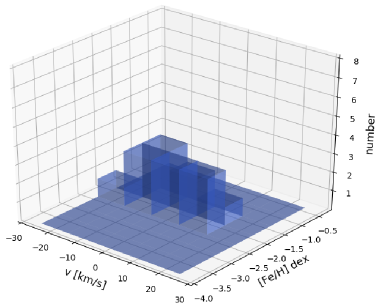 (b)
(b)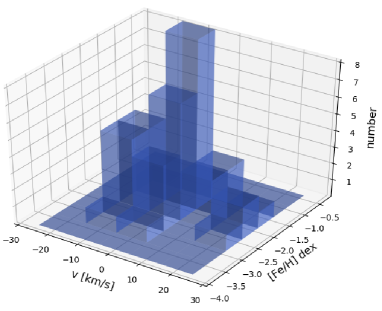
(c)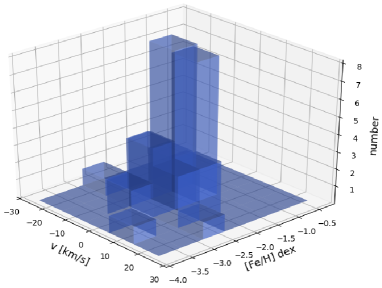 (d)
(d)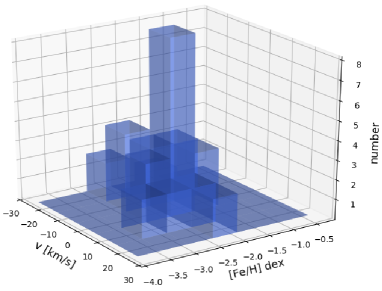
2.3. Leo I
The Leo I dSph is one of the most remote dSphs associated with the MW (e.g. Grebel et al. 2003). It has a Galactocentric distance of kpc (Bellazzini et al., 2004), a position angle °, a core radius arcmin, a tidal radius arcmin, an ellipticity (Muñoz et al., 2018), and a systemic velocity km s-1 (Koch et al., 2006).
Because of Leo I’s high radial velocity and its large Galactocentric distance, Koch et al. (2007a) argue that Leo I might be an isolated system, which is currently not affected by Galactic tides. However, Boylan-Kolchin et al. (2013) argue that it is very unlikely that Leo I is not bound to the MW galaxy, under the premise that Galactic satellites are associated with DM subhalos. They used high resolution numerical simulations of a MW like DM halo and found that 99.9% of the subhalos in the simulations are bound to their host halo.
On the other hand, if Leo I passed very close to the Galactic center (around Gyr ago), then the observed kinematics and population segregation in Leo I, along with its distorted structural parameters, its age, its last prominent burst of star formation, and its large radial velocity relative to the Galactic Center, can be explained (Mateo et al., 2008). Because Leo I presents no tidal arms, the latter scenario could result from the interaction with a third body, which placed Leo I into its present highly-elliptical orbit.
Sohn et al. (2013) studied the detailed orbital history of Leo I. They found that Leo I entered the MW virial radius Gyr ago, and that (confirming Mateo et al. 2008) it had a pericentic approach (at a Galactocentric distance kpc) around one Gyr ago.
However, Koch et al. (2012b) measured the proper motion of Leo I and found that Leo I might not be bound to the MW. Furthermore, they say that it is likely that Leo I was formed and evolved in isolation, and it is now approaching its first encounter with the Galactic halo.
Gaia Collaboration, Helmi, et al. (2018) estimated that Leo I has a period greater than Gyr, and they predict that its last pericentric passage (at a distance of kpc) took place around Gyr ago. The Leo I dSph has been used to derive a limit on the mass of the MW DM halo. If Leo I is indeed bound to the MW, it sets constrains on the MW mass (Boylan-Kolchin et al., 2013). Gaia Collaboration, Helmi, et al. (2018) set a lower limit on the mass of the MW DM halo of M⊙, based on the assumption that Leo I is indeed bound to the MW. Recentely, Fritz et al. (2018) found that Leo I is “back-splashing” if one considers the (preferred) heavy MW DM halo model ( M⊙).
Interestingly, stellar substructure has been detected in Leo I. Mateo et al. (2008) reported six stars uniformly distributed and kinematically distinct from the main Leo I stellar component. They claim that these stars might represent a tidal feature, but they warn that the statistics are too poor and that further members of this kinematic structure would need to be identified in order to conclude whether the substructure is real or not.
2.4. Leo II
The Leo II dSph is located at a Galactocentric distance of kpc (Bellazzini et al., 2005). It has a position angle °, a core radius arcmin, a tidal radius arcmin, an ellipticity (Muñoz et al., 2018), and a systemic velocity in the heliocentric system km s-1 (Koch et al., 2006).
Leo II is believed not to be experiencing strong Galactic tides, and its proper motion indicates that it might not even be a bound satellite to the MW (Lépine et al., 2011). Piatek et al. (2016) measured the proper motion of Leo II. They found that the motions they measured support the idea that Leo II fell into the MW DM halo as a part of a group. On the other hand, Gaia Collaboration, Helmi, et al. (2018) concluded that the infall of Leo II as a group is unlikely.
Vogt et al. (1995) calculated a , which indicates that Leo II must be embedded in a DM halo, but it is not an extreme case. Koch et al. (2007b) obtained a large data set of radial velocity measurements out to Leo II’s limiting radius. They found (depending on the total luminosity adopted) a . They concluded that this ratio together with the flatness of its dispersion profile indicate that Leo II is a DM-dominated system.
Komiyama et al. (2007) reported the existence of a small stellar substructure beyond Leo II’s tidal radius. The substructure’s luminosity compares to that of a globular cluster (). The substructure might be a disrupted globular cluster or a group of stars that were stripped away from the galaxy.
3. Methods
3.1. “Brute-force” method
(a)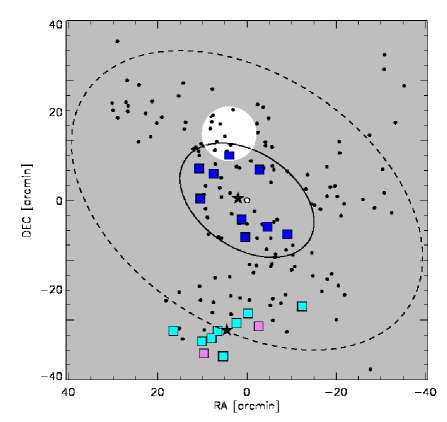 (b)
(b)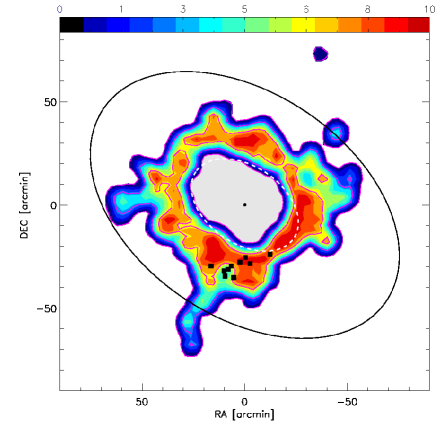
(b) In this panel we show contours of star counts similar to Roderick et al.’s (2016) Figure 13. We over plotted their core ( arcmin, see white dotted ellipse) and their tidal radius ( arcmin, see black ellipse), which they found by fitting a King model to the radial distribution of Sextans. The substructure named sxt2 is shown as black filled squares.
We search for stellar substructures in the four selected dSph galaxies. For this purpose, we first constructed 2-dimensional histograms on a grid of metallicity vs. velocity (see Figure 1) for every elliptical annuli of constant ellipticity and position PA in the selected galaxy.
We adopt an initial metallicity (the minimum metallicity value of the studied data) and a final metallicity (the maximum metallicity in the data), with an interval in metallicity and an interval in velocity of , see Figure 1.
Subsequently, with both metallicity () and velocity () fixed, we count the stars in our data, that satisfy being in the interval
| (1) |
where is the metallicity of the star that is being analyzed. We repeat the procedure with the velocity, such that
| (2) |
where corresponds to the velocity of the star that is being analyzed. With the resulting number of stars that satisfy the conditions 1 and 2 (per elliptical annulus width), we build histograms of the number of stars to find peaks in the counts of stars that could be interpreted as stellar substructures.
The peaks in the counts of stars that are interesting to us are the ones with low metallicities, and that are dynamically cold, meaning that the velocity dispersion of such group of stars should be significantly lower that that of the complete stellar sample (per elliptical annulus bin).
In order to declare whether a peak in counts is significant or not, we realize Monte Carlo tests of normal distributions for both metallicity and velocity (in the same elliptical annulus bin where the peak was found) and find the average and standard deviation () of these distributions. If the number of counts in the peak (which is found in a defined metallicity-velocity cell) is , or in other words, the probability of finding a peak is we take such a count peak to be significant.
3.2. Minimum spanning tree method
Another method to investigate whether stars of a certain metallicity range are in some way kinematically clumped (i.e., spatially more concentrated) we make use of a minimum spanning tree (MST, e.g., Schmeja 2011). The MST is the unique set of straight lines (“edges”) connecting a given set of points (“vortices”) without closed loops, such that the sum of the edge lengths is minimum. This construct from graph theory has been widely applied in astronomy to cluster and structure analysis, from the large-scale distribution of galaxies to the internal structure of star clusters (Schmeja, 2011, and references therein). We apply an approach similar to the one introduced by Allison et al. (2009) to identify and quantify mass segregation in star clusters. We construct the MST for the stars of a given metallicity range and determine the mean edge length for those stars. We use the geometric mean rather than the arithmetic mean in order to minimize the influence of outliers (Olczak et al., 2011). Then we construct the MST of the same number of randomly selected stars from the entire sample and determine the mean edge length . This is done 200 times in order to obtain the mean value . The ratio
| (3) |
is a measure for the concentration of the stars of the sub-sample relative to the entire stellar population. A value of implies that both samples are distributed in a similar manner, while indicates that the sub-sample is more concentrated than the sample as a whole.
4. Results
4.1. The case of Sextans
For the case of Sextans, we used Battaglia et al.’s (2011) data. They obtained VLT/FLAMES intermediate-resolution spectroscopic observations in the near-infrared CaII triplet (CaT) region for distinct targets along the line-of-sight to Sextans. The magnitudes and colors of those targets are broadly consistent with red giant branch (RGB) stars. From that sample they obtained stars with S/N and error in velocity that produce reliable line-of-sight velocities and CaT equivalent widths. A subset of stars from those are RGB stars that are probable members with line-of-sight velocities accurate to km/s and CaT [Fe/H] measurements accurate to dex. The majority of the Galactic contaminants were eliminated from Battaglia et al.’s sample using a kinematic cut. Finally, in order to refine their membership criteria, they used the Mg I line at Å as an empirical indicator of stellar surface gravity, so that the probable members (RGB stars) of Sextans and the Galactic contaminants could be distinguished.
Our first target of study is the stellar clump found in Sextans by Battaglia et al. (2011). We will refer to this clump of stars as sxt1. With our brute-force method (see Section 3.1), we should be able to reproduce previous findings. Using the Battaglia et al. (2011) data, we follow the method of Section 3.1. We set dex, dex and dex. For the velocities, we set km s-1, km s-1, and a km s-1.
Then we construct histograms of star counts per elliptical radius. These histograms help us to identify the accumulation of stars in a particular radius bin. The elliptical radial bins in the case of Sextans have a size of 10 arcmin. As expected, we find sxt1.
The metallicity of this group of stars (sxt1) is in the range dex, with an average metallicity [Fe/H], and the velocity is in the range km s-1. The fact that we are able to recover the sxt1 clump is an indicator that our method is working well.
In Figure 2a we plot Sextans’ member stars (black circles) taken from the Battaglia et al. (2011) data set. The center of the Sextans dSph (Mateo, 1998) is shown as a white circle. The sxt1 clump stars are shown as filled blue squares, and the solid black star shows the centroid of sxt1.
We did not only recover the sxt1 clump reported by Battaglia et al. (2011), but we also found a second old cold-stellar substructure. We will refer to this new substructure as sxt2. The sxt2 stellar substructure consists of eight stars with metallicities ranging from to . The average metallicity is [Fe/H]= -2.78, and the velocities range from km s-1. We computed the centroid (relative to the center of Sextans, see Table 1) of sxt2 to be located at (,) arcmin (relative to the center of Sextans).
In Figure 2a, we show the stars of the new clump (sxt2) as filled cyan squares, and the respective centroid plotted as a solid black star. It has to be noted that if one relaxes the velocity constraint and lets the velocity cover km s-1, we can add two new metal-poor stars. Therefore, we end with a 10-star substructure with an average metallicity of . If we include these two stars, the centroid of the -star substructure changes to (, ) arcmin. The two extra stars are shown as two filled magenta squares in Figure 2a.
The MST analysis also detects sxt1 and sxt2 and confirms them as highly concentrated clumps with and , respectively (see Equation 3).
In order to demonstrate that random groupings of stars with matching metallicities and velocities are in fact very rare, we realize Monte Carlo tests of normal distributions for both metallicity and velocity (see Section 3.1). We find that the probability of finding sxt1 is (i.e., ). We also find that the probability of finding sxt2 is (i.e., ).
The latter supports the suggestion that in fact the new clump sxt2 reported in this work is likely physical.
(a)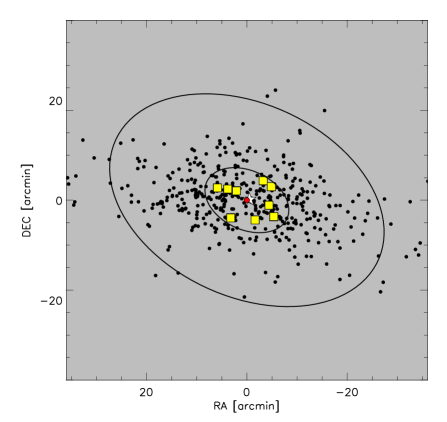 (b)
(b)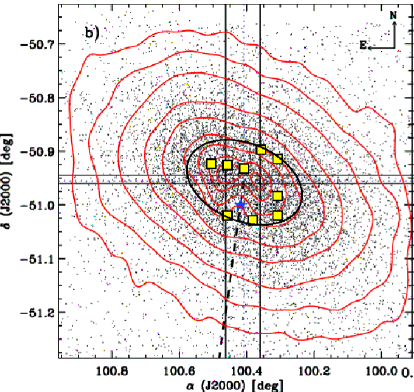
(b) Fabrizio et al.’s (2011) Figure 13: sky distribution of the stars from Fabrizio et al.’s (2011) photometric catalog. Isodensity contours are shown ranging from to % of the total number of stars. The blue star shows the position of the star HD48652. The solid (vertical and horizontal) black lines mark the two secondary peaks in RV. The nine stars making up car1 are overplotted as filled yellow squares. The black solid ellipse is located at the distance of the core radius ( arcsec).
Interestingly, Roderick et al. (2016) reported clear evidence of a stellar substructure distributed evenly about the center of Sextans. The substructure extends up to a distance of kpc. In order to compare our findings to Roderick et al. (2016), we built contours of star counts using Roderick et al.’s (2016) substructure data, shown in Figure 2b. We over-plotted their core (white dashed-line) and tidal radius (black line) ( arcmin and arcmin, respectively). It is very encouraging to observe that our sxt2 substructure lies in a dense substructure region, giving a hint that sxt2 might be a member of the annular substructure within Sextans.
Battaglia et al. (2011) transformed the heliocentric line-of-sight velocities into line-of-sight velocities in a frame at rest with respect to the Galactic center, (where GSR stands for Galactic standard of rest, km s-1). They reported a velocity dispersion for the six innermost stars making up their clump of km s-1, and an average GSR velocity of km s-1. They also computed an average metallicity for their clump of [Fe/H]= -2.6.
We follow Battaglia et al. (2011) and compute a velocity dispersion and a mean GSR velocity for eight stars of sxt2 (see the cyan squares in Figure 2a) of km s-1 and km s-1, respectively.
Since the velocity dispersion could be a strong function of the galactocentric radius, we compute the velocity dispersion of all the stars in Battaglia et al.’s (2011) data belonging to the same elliptical annulus as sxt2. We found that the velocity dispersion of the elliptical annulus associated with sxt2 is 9 km s-1.
The velocity dispersion of sxt2 is very cold (compared to the velocity dispersion of all the stars belonging to the same elliptical annulus) and its average metallicity ([Fe/H]= -2.78) is even lower than that of sxt1. The low metallicity of sxt2, together with its cold kinematics, suggests that the stars belonged to a stellar (globular) cluster. If we add the two extra stars shown as magenta squares in Figure 2a (where we have relaxed the velocity condition, see text above), we obtain a velocity dispersion of km s-1 and an average metallicity of [Fe/H]=-2.76. The velocity dispersion of the 10-star clump is a bit higher than the one computed with eight stars, but it remains colder than the velocity dispersion of sxt2’s associated elliptical annulus ( km s-1).
As done by Battaglia et al. (2011), if the stars in the Sextans sample are representative, then sxt2 would account for (or if one includes the extra two stars) of Sextans’ stellar population. If we take the value for the luminosity of Sextans of L⊙ (Irwin & Hatzdimitriou, 1995; Łokas, 2009) and a typical value for the mass-to-light ratio for globular clusters, (McLaughlin & van der Marel, 2005); then zero order estimates for the mass and luminosity of sxt2 are M⊙ and L⊙ ( M⊙ and L⊙, if we include the two extra stars).
The fact that the MST analysis confirmed that sxt2 is concentrated with respect to the overall Sextans sample, along with its metal-poor, dynamically cold nature, reasserts the idea that Sextans has not experienced a strong tidal encounter, indicating that it could have a more circular orbit around the Galactic Center. The low metallicity of sxt2 suggests that it might be very old (i.e., Gyr) and its progenitor (as well as the progenitor of sxt1, Battaglia et al. 2011) would be most likely a globular cluster, and such a globular cluster would then be among the most metal-poor globular clusters known.
The detection of cold old stellar substructures in dwarf spheroidal galaxies has
been helpful to shed some light on the core/cusp DM problem at galactic scales.
For example, a cored DM halo profile is preferred when explaining the existence of
the stellar substructures in UMi and Sextans (Kleyna et al., 2003; Lora et al., 2009, 2013).
The stellar substructure sxt2 gives a new test to corroborate if (in
particular) Sextans is embedded in a cored DM halo.
4.2. The case of Carina
For the case of Carina, we used Koch et al.’s (2006) data. Their targets in Carina were chosen from photometry and astrometry obtained by the ESO Imaging Survey (Nonino et al., 1999). Koch et al. (2006) selected their targets to cover magnitudes from the tip of the RGB down to mag below the RGB tip ( mag in apparent V-band magnitude). They chose their RGB magnitude range such that even for the faintest stars they would be able to achieve high signal-to-noise ratios. They obtained VLT/FLAMES spectroscopic observations in the near-infrared CaT region, using the GIRAFFE spectrograph with both MEDUSA fiber slits in “low-resolution” mode. Their observed fields covered most of Carina’s area, and extended even beyond its nominal tidal radius. The membership probabilities were calculated using an error-weighted maximum-likelihood fit of a Gaussian velocity distribution (in the km s-1 range), and then rejecting outliers. Koch et al. (2006) determined the metallicities of the RGB stars sample through the equivalent widths-CaT method.
We apply the same methods described in Section 3 to the Carina dSph. We set the metallicity limits dex, dex and dex. For the velocities we set km s-1 and km s-1 with a km s-1. We find a group of nine stars with metallicities in the range and velocities km s-1, within elliptical annuli widths of 5 arcmin. We refer to this group of stars as car1. We plot car1 in Figure 3a as filled yellow squares. car1’s centroid is shown with a white star. We notice that the centroid of car1( arcmin) is quite close to the center of Carina (just pc away), represented with a filled red circle.
Applying the MST analysis, car1 is found as a prominent clump with a ratio (see Equation 3).
We demonstrate that random groupings of stars with matching metallicities and velocities in Carina’s data are very rare. We realize Monte Carlo tests of normal distributions for both metallicity and velocity (see Section 3.1). We find that the probability of finding car1 is (i.e., ) supporting the suggestion that the substructure CAR1 is physical. The stellar substructure found in Carina could be an unbound object in the throes of destruction, which could have started out as a typical cluster with a radius of pc, very similar to the stellar substructure sxt1.
For the nine stars group (car1) we computed a velocity dispersion of km s-1, a mean velocity of km s-1, and an average metallicity of [Fe/H].
We compute the velocity dispersion of all the stars in Koch et al.’s (2006) data belonging to the same annulus-bin as car1. We found that the velocity dispersion of the elliptical-annuli associated to CAR1 is 7.2 km s-1.
If the star-sample is representative of Carina’ s stellar component, then car1 would account for of Carina’s stellar population. If we adopt a mass-to-luminosity-ratio of (typical for globular clusters) and a luminosity of (Łokas, 2009), then we can roughly estimate that car1’s mass is , very similar to the mass estimate of sxt1 and sxt2.
As we mentioned before, Fabrizio et al. (2011) found evidence of a secondary maximum in radial velocity at a distance pc from Carina’s center, which they interpreted as reminiscent of a substructure with transition properties (i.e., a transition between a bulge-like and/or disk-like structure). In Figure 3b we took the sky distribution of the stars in Fabrizio et al.’s (2011) photometric catalog (their Figure ), where they plot isodensity contour levels from 5% to 95%. We over plotted the car1 clump of stars. All the (nine) stars lie inside the 45% isodensity contour level, which coincides with the core radius of Carina (see the black ellipse in Figure 3b), and it also coincides with the location where Fabrizio et al. (2011) reported their substructure.
4.3. The case of Leo I
(a)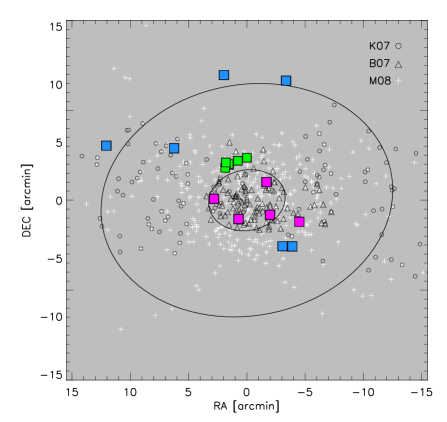 (b)
(b)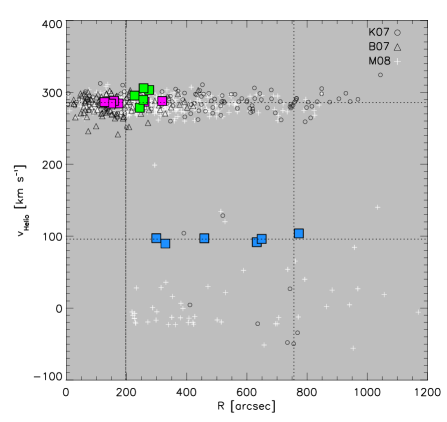
(b) Heliocentric velocities as a function of the elliptical radius. The dotted vertical lines show the core () and tidal () radius. The horizontal dotted line shows km s-1, the average velocity of Mateo et al. (2008)’s sample.
For the case of Leo I, we used Koch et al.’s (2007a) (hereafter K07) data together with Bosler et al.’s (2007) (hereafter B07) data.
The targets in Koch et al. (2007a) were selected from photometry obtained with the framework of the Cambridge Astronomical Survey Unit (Irwin & Lewis, 2001) at the m Isaac Newton Telescope. They selected red giant stars in order to cover magnitudes from the tip of the RGB ( mag) down to mag below the RGB tip ( mag). Their observations were carried out with the Gemini Multiobject Spectrograph (GMOS) and with the Deep Imaging Multi-Object Spectrograph (DEIMOS). Their low-resolution spectra have a signal-to-noise of , sufficient to obtain accurate radial velocity measurements. They derived radial velocities from their final reduced spectra by cross-correlating the three strong Ca lines (, , and ) with a synthetic template spectrum of the CaT region. They estimated the metallicities of their RGB stars sample, from the widely used method of relating the equivalent widths of the CaT to metallicity.
On the other hand, Bosler et al. (2007) obtained low-dispersion spectra of red giants in Leo I (and Leo II) using the Keck I 10-m telescope and LRIS. They obtained a mean S/N of (for Leo I stars). They verified the membership of their RGB stars by deriving their radial velocities. From their stars observed in Leo I, a number of have heliocentric velocities within of the average velocity, and thus were selected as members of Leo I. They estimated the metallicities of their sample relating the equivalent widths of the CaT (as done by Koch et al. 2007a).
It has to be noted that the K07 and B07 data sets do not overlap.
We took both data sets, and applied the brute force method (Section 3.1) to scrutinize the possible existence of stellar substructure. We set the ranges for the metallicity dex, dex and dex. For the velocities we set km s-1 and km s-1 with km s-1.
We only found one group of stars that was relevant, using elliptical annuli widths of 4 arcmin. This group of stars consists of six stars (hereafter, li1). The metallicity of li1 is in the range , with an average metallicity [Fe/H]. The velocities are in the range km s-1, the average velocity is km s-1, and the velocity dispersion is km s-1.
We computed the velocity dispersion of all the stars in the K07 and B07 data belonging to the same elliptical annulus as LI1. We found that the velocity dispersion of the elliptical annulus associated with LI1 is 13 km s-1.
We show the stars belonging to li1 as filled magenta squares in Figure 4. The open black circles are the red giants reported by K07 and the open black triangles correspond to B07’s stars.
The MST method only finds few rather weak concentrations with and a low number of members, therefore it did not help us to corroborate if li1 is a real substructure.
K07 detected a minor significant rise in the radial dispersion profile, around pc from the center of Leo I (corresponding to the core radius), which they not find to be associated with any real localized kinematical substructure (we will refer to this group of stars as k1). We plot this group of five stars as filled green squares in Figure 4. We observe that the clump reported in this work and k1 only have one star in common. Adding to K07’s and B07’s data, additional data of Leo I star members, Mateo et al. (2008) (hereafter M08) presented kinematic results of stars in the Leo I dSph (see white plus symbols in Figure 4). They found a group of six stars (see filled blue squares in Figure 4) with velocities in a narrow range, with a dispersion of km s-1 and a mean velocity of km s-1 (see horizontal dotted line in Figure 4b). They argue that this group of stars might be a kinematically cold group, but they warn that the statistics are poor. They found this group of stars by plotting the heliocentric velocity as a function of the elliptical radius (see our Figure 4b and Figure 9 of M08). For comparison, we over plotted the clump of stars reported in this work, li1 (magenta filled squares); and the group of five stars reported by K07 (filled green squares).
We perform a statistical study to show whether random groupings of stars in K07 and B07 data are rare or not. We realize Monte Carlo tests of normal distributions for both metallicity and velocity (see Section 3.1). We find that the probability of finding li1 is (i.e., ). Such a finding reflects the fact that, in the case of Leo I, we are dealing with low number statistics, and thus li1 is not statistically significant.
The velocity dispersion of li1 is a factor of smaller ( km s-1) than the dispersion found in M08’s group of stars. This, together with the low average metallicity found in li1, indicates that li1 (if real) might be a dynamically cold stellar substructure.
Five of the six stars in li1 are contained in the B08 data. Then, if we suppose that the B07’s data are representative of the Leo I main stellar population, li1 would account for of it. Depending on the luminosity adopted (McConnachie, 2012), a zero order mass estimate for li1 would be M⊙. The calculated mass for li1 is higher than for the stellar substructures in Sextans and Carina (see Section 4.1 and 4.2, respectively), but it is comparable to the mass of the most massive globular cluster in the Fornax dSph and Sagittarius dSph, M⊙ (Mackey & Gilmore, 2003).
4.4. The case of Leo II
For the case of Leo II, we used Koch et al.’s (2007b) (hereafter K207) data, together with B07 data.
The targets in Koch et al. (2007b) were selected from photometry that was obtained by the Cambridge Astronomical Survey Unit (Irwin & Lewis, 2001) at the m Isaac Newton Telescope. The selection criteria of the targets involved colors and luminosities consistent with being members of Leo II’s RGB stars. Koch et al. (2007b) obtained VLT/FLAMES spectroscopic observations in the near-infrared CaT region, using the GIRAFFE multifiber spectrograph in low-resolution mode, centered at the near-infrared CaT at Å. To eliminate Galactic contaminants, Koch et al. (2007b) determined individual radial velocities by means of cross-correlation of the three CaT lines against synthetic Gaussian template spectra. The templates were synthesized adopting representative equivalent widths of the CaT in RGB stars. The spectroscopic metallicity and age distributions were derived using the near-infrared CaT calibration method (Koch et al., 2007c).
On the other hand, B07 obtained CaT abundances and radial velocities for RGB stars in Leo II, using the low-resolution spectrograph LRIS. They obtained a mean S/N of . They verified the membership of their RGB stars by deriving their radial velocities. From their stars observed in Leo II, have heliocentric velocities within of the average velocity, and thus are designated as members of Leo II. B07 estimated the metallicities of their sample relating the equivalent widths of the CaT.
It has to be noted that K207 and B07 data sets do not overlap.
In addition, Spencer et al. (2017a) (hereafter S17) obtained a large data set of RGB member candidates of Leo II, which were separately analyzed. S17 performed spectroscopic observations with the Multiple Mirror Telescope using Hectochelle, a multifiber, single-order echelle spectrograph. They obtained simultaneous estimates of radial velocity, effective temperature, surface gravity, and metallicity by fitting a library of smoothed, synthetic stellar spectra to each Hectochelle spectrum in pixel space (Walker et al., 2015). In order to separate stellar members from nonmembers they employed a velocity cut. Again, stars with radial velocities larger than were taken to be Galactic foreground stars. After performing the kinematic cut, they still had stars with velocities and positions similar to those of Leo II stars. Therefore, they applied an extra cut in the data based on stellar surface gravities. From both criteria, they end with a total of Leo II members.
We look for stellar substructures in the Leo II dSph, combining the RGB star data of K207 and B07. We applied the brute-force method setting the ranges for the metallicity dex, dex and dex. For the velocities we set km s-1 and km s-1, with km s-1. The typical measurement errors for the metallicity and the velocity (as in Leo I) are dex and km s-1, respectively.
Using the brute-force algorithm and the MST method, we did not find any significant stellar substructure in the K207 + B07 data set. The non-detection of stellar substructures in these data might be related to the small sample size ( with K207 and B07 combined), and/or to the large Galactocentric distance of Leo II.
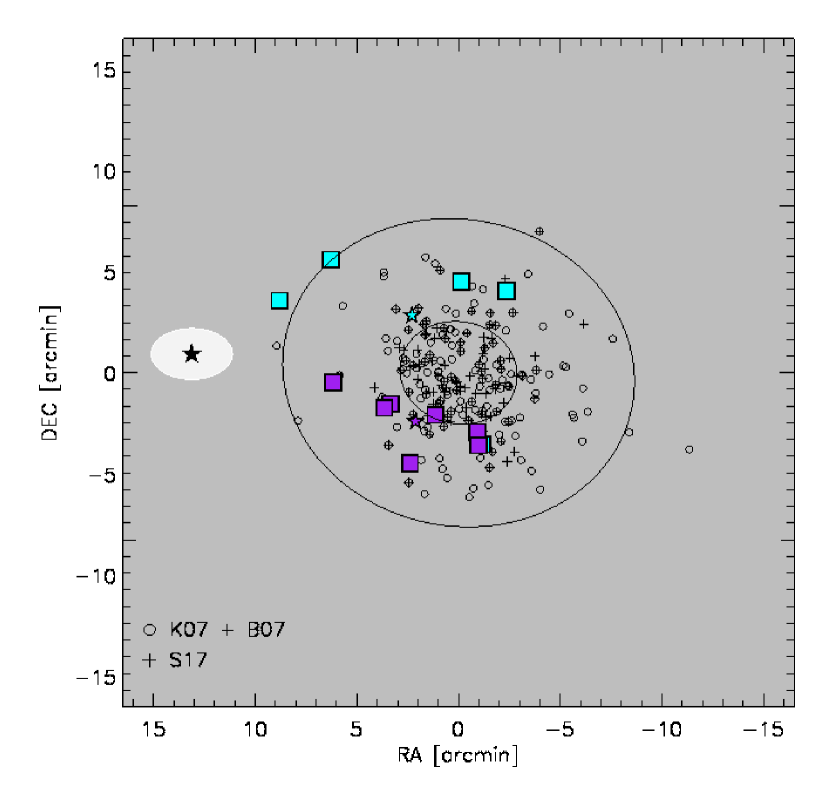
On the other hand, analyzing the S17 data with the brute-force algorithm we found two considerable groups of stars. In Figure 5 we show K207 combined with B07 data as open circles; and K17 data as plus symbols. The two groups of stars are shown as filled cyan squares (hereafter lii1), and filled purple squares (hereafter lii2).
The substructure lii1 is the most metal-poor group that we find. Five stars make up lii1. It has a mean metallicity of , a mean velocity of km s-1, and a velocity dispersion of km s-1, in a elliptical annulus width of 5 arcmin. The substructure lii2 is constituted of seven stars. The mean metallicity is , the mean velocity is km s-1, and it has a velocity dispersion of km s-1, in a elliptical annuli width of 6 arcmin.
We compute the velocity dispersion of all the stars in the S17 data belonging to the same annulus as LII1 and LII2. We found that the velocity dispersion of the elliptical annulus associated with LII1 is 7 km s-1, and the velocity dispersion associated with LII2 is 7.6 km s-1.
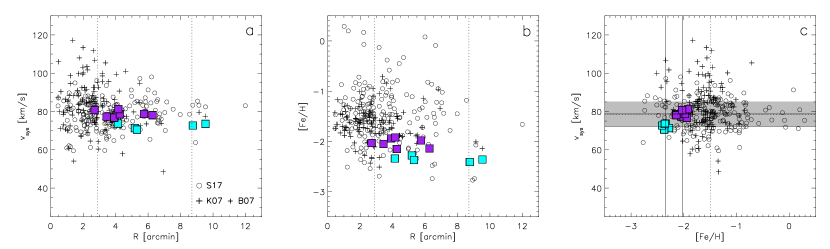
In Figure 6a we show the systemic velocity as a function of the elliptical radius, where we can clearly observe that the substructures appear elongated (about to arcmin). The average velocity of lii1 is very similar to the systemic velocity of Leo II ( km s-1). Figure 6b shows the metallicity as a function of the elliptical radius. 25% of the stars in the S17 data have metallicities lower than . Moreover, only 8.6% of the stars in the S17 sample have metallicities lower than , and one third of those stars are contained in lii1.
The velocity as a function of metallicity is shown in Figure 6c. In the velocity-metallicity space, one can clearly observe both substructures clumped together. The mean velocity of lii1 is away from Leo II’s average velocity (shown as a shaded region in Figure 6c). The low metallicity of lii1 together with its velocity makes it a thought-provoking stellar substructure.
It is worthwhile mentioning that Komiyama et al. (2007) carried out wide-field imaging of Leo II extending far beyond Leo II’s tidal radius. They reported the existence of a substructure in the eastern part of the galaxy (containing four bright RGB stars) with a physical size of pc2 located beyond the tidal radius (), with a luminosity close to that of a globular cluster (see black star in Figure 5). They suggest that this substructure is a disrupted globular cluster that is merging with the main stellar component of Leo II.
Interestingly, two of the stars in lii1 are located beyond the tidal radius, and the interpretation could be similar to that of the knotty stellar structure reported by Komiyama et al. (2007). We computed a first order approximation on the stellar mass of lii1 making the assumption that the number of RGB stars in the S17 data is representative of Leo II. Then, lii1 would account for of Leo II’s total stellar mass. Taking a luminosity of L⊙ (Coleman et al., 2007) and a typical value (for globular clusters) of the mass-to-light ratio equal to two, then lii1’s mass would be M⊙.
We perform a statistical study to investigate whether random groupings of stars in the S17 data are rare. We carried out Monte Carlo tests of normal distributions for both metallicity and velocity (see Section 3.1). We find that the probability of finding LII1 is (i.e., ). On the other hand, the probability of finding LII2 is only . Therefore, we conclude that LII2 is not statistically significant. Indeed, LII1 could be real stellar debris, but we have to keep in mind that we are dealing with a low number of Leo II members.
One must keep in mind that a high fraction of binary stars could falsify radial velocity measurements. Recently, Spencer et al. (2017b) determined a binary fraction of for the Leo II dSph galaxy.
5. Conclusions
In this paper we searched for stellar substructures in four dSph galaxies that are satellites of the MW. We were able to find the stellar substructure reported by Battaglia et al. (2011), and a new substructure in Sextans, sxt2. The latter stellar substructure consists of eight stars with metallicities from to dex. Moreover, if we relax the constraint on the velocity ( km s-1) we can add two more stars to the clump maintaining the same low metallicity range. The distance from the center of Sextans to the center of the ten-star clump is pc, and the velocity dispersion is cold ( km s-1). If the stars of the sxt2 clump belong to a disrupted globular cluster then these low metallicities would suggest that it would be one of the most metal-poor globular clusters known. It is very encouraging to see that sxt2 lies in the densest region reported by Roderick et al. (2016).
We also find a cold stellar substructure close to the core ( pc) of the Carina dSph. This substructure car1, consists of nine stars with metallicities ranging from to dex and a velocity dispersion of km s-1. Such a substructure resembles a disrupted globular cluster, very similar to that found by Battaglia et al. (2011) in Sextans (sxt1). It has to be noted that the distance from the center of Carina to the center of Carina’s substructure is only pc, i.e., very close to the center of Carina. Interestingly, the car1 substructure could possibly be related to the substructure reported by Fabrizio et al. (2011), since both lie close to the core of Carina.
Analyzing Leo I, we find a new substructure, besides the one reported by K07 and M08. The li1 substructure has six stars with metallicities ranging from to dex, an average velocity of km s-1, and a velocity dispersion of km s-1. After the statistical analysis, we concluded that li1 is not significant.
In the dSph galaxy Leo II, we found two significant groups of stars, lii1 and lii2. From those two groups, we found that only lii1 is statistically significant. Even if the probability of finding lii1 is very low (%), we have to mention that we are dealing with low number statistics.
The finding of new stellar substructures is of major importance, since it leads to the idea that the early evolutionary histories of dSph are as complicated as the ones of massive galaxies. In particular, stellar substructures are of great use when investigating the DM profiles of dwarf galaxies. For example, using -body simulations, one can study the survival of old cold substructures in the DM halo of dSphs against phase mixing, and compare the evolution of the stellar substructures when the dark halo has a core and when the dark halo has a cuspy profile (Kleyna et al., 2003; Lora et al., 2009, 2012, 2013; Contenta et al., 2017; Amorisco, 2017). The existence of the old stellar clump in UMi (Kleyna et al., 1998) is in agreement with a cored DM profile rather than a cuspy NFW one. If the old stellar clump in UMi is dropped in a NFW cuspy profile, the stellar clump gets disrupted in the first Gyr (Kleyna et al., 2003; Lora et al., 2009, 2012, 2013).
Lora et al. (2013) also found that a cored DM profile is needed in order to guarantee the survival of the old stellar substructure found in Sextans by Battaglia et al. (2011), and the one found by Walker et al. (2006). Then, the new stellar substructures found in this work will be crucial to further investigate the core/cusp problem in other dSphs. Therefore, we will perform N-body simulations of the four dSph studied in this paper and the new stellar substructures to investigate their evolution within their parent DM halo.
Given the very small number of stars found to be associated with the substructures in the current study and in others, and given how difficult it is to destroy GCs in the absence of strong tidal fields, one might also suggest that we are looking here at the possible remnants of very old, metal-poor, low-mass clusters akin to open clusters. Either way, another interesting question is how such clusters were able to form to begin with in systems that we see nowadays as very low stellar density objects. Moreover, one could argue that these discoveries may add to the recent discoveries of old clusters in low-mass dSphs, making them a more common occurrence than previously thought.
It is worthwhile to mention that Amorisco et al. (2014) point out that mergers of low-mass galaxies are expected within the hierarchical model of galaxy formation. Moreover, they report the kinematic detection of a stellar stream in the dSph Andromeda II, which they suggest could be the remnant of a merger between two dwarf galaxies (see also Koch et al. 2012a for low-mass range). Thus, further study on the properties of the stellar substructures reported in this work might shed light on the way galaxies assemble through mergers at very small scales.
References
- Amorisco et al. (2014) Amorisco, N. C., Evans, N. W. & van de Venn, G., 2014, Nature, Volume 507, Issue 7492, 335
- Amorisco (2017) Amorisco, N. C., 2017, ApJ, 844, 64
- Allison et al. (2009) Allison, R. J., Goodwin, S. P., Parker, R. J., et al. 2009, MNRAS, 395, 1449
- Battaglia et al. (2011) Battaglia, G., Tolstoy, E., Helmi, A., Irwin, M., Parisi, P., Hill, V. & Jablonka, P., 2011, MNRAS, 411, 1013
- Bellazzini et al. (2004) Bellazzini, M., Gennari, N., Ferraro, F. R. & Sollima, A., 2004, MNRAS, 354, 708
- Bellazzini et al. (2005) Bellazzini, M., Gennari, N. & Ferraro, F. R., 2005, MNRAS, 360, 185
- Bono et al. (2010) Bono, G., Stetson, P. B., Walker, A. R., et al. 2010, PASP, 122, 651
- Bosler et al. (2007) Bosler, T. L., Smecker-Hane, T. A. & Stetson, 2007, MNRAS, 378, 318
- Boylan-Kolchin et al. (2013) Boylan-Kolchin, M., Bullock, J. S., Sohn, S. T., et al. 2013, ApJ, 768, 140
- Bullock & Johnston (2005) Bullock, J. S. & Johnston, K. V., 2005, ApJ, 635, 931
- Chen et al. (2016) Chen, J., Bryan, G. L. & Salem, M., 2016, MNRAS, 460, 3335
- Cicuendez et al. (2018) Cicuendez, L. et al. 2018, A&A, 609, 53
- Coleman et al. (2007) Coleman, M. G., Jordi, K., Rix, H. W., Grebel, E. K. & Koch, A. 2007, AJ, 134, 1938
- Contenta et al. (2017) Contenta, F., Gieles, M., Balbinot, E. & Collins, M. L. M., 2017, MNRAS, 466, 1741
- Cooper et al. (2013) Cooper, A. P., D’Souza, R., Kauffmann, G., et al. 2013, MNRAS, 434, 3348
- de Boer et al. (2014) de Boer, T. J. L., Tolstoy, E., Lemasle, B., Saha, A., Olszewski, E. W., Mateo, M., Irwin, M. J. & Battaglia, G. 2014, A&A 572, A10
- Dekel & Silk (1986) Dekel, A. & Silk, J., 1986, ApJ, 303, 39
- del Pino et al. (2015) del Pino, A., Aparicio, A. & Hidalgo, S. L., 2015, MNRAS, 454, 3996
- Fabrizio et al. (2011) Fabrizio M., Nonino, M., Bono, G., et al. 2011, PASP, 123, 384
- Fabrizio et al. (2016) Fabrizio M. et al. 2016, ApJ, 830, 126
- Fritz et al. (2018) Fritz, T. K., Battaglia, G., Pawlowsky, M. S., Kallivayalil, N., van der Marel, R., Sohn, S. T., Brook, C. & Besla, G. 2018, A&A 619, A103
- Gaia Collaboration, Helmi, et al. (2018) Gaia Collaboration, Helmi, A. et al. 2018, A&A, 616, A12
- Grebel (2000) Grebel, E. K., 2000, in Star Formation from the Small to the Large Scale, ed. F. Favata, A. A. Kaas, & A. Wilson (ESA SP-445; Noordwijk: ESA), 87
- Grebel et al. (2003) Grebel, E. K., Gallagher, J. S. & Harbeck, D., 2003, AJ, 125,1924
- Grebel & Gallagher (2004) Grebel, E. K. & Gallagher, J. S., 2004, ApJ, 610L, 89
- Harbeck et al. (2001) Harbeck, D., et al. 2001, AJ, 122, 3092
- Hayashi et al. (2018) Hayashi, K., Fabrizio, M.,Łokas E. L., Bono, G., Monelli, M., Dall’Ora, M. & Stetson, P. B. 2018, MNRAS, 481, 250
- Hurley-Keller et al. (1998) Hurley-Keller, D., Mateo, M. & Nemec, J., 1998, AJ, 115, 184
- Ibata et al. (2006) Ibata, R., Chapman S., Irwin M. et al., 2006, MNRAS, 373, L70
- Irwin & Lewis (2001) Irwin, M., & Lewis, J. 2001, NewA Rev., 45, 105
- Irwin & Hatzdimitriou (1995) Irwin, M. & Hatzdimitriou, D., 1995, MNRAS, 277, 1354
- Kim et al. (2019) Kim, Hak-Sub, Han, Sang-Il, Joo, Seok-Joo, Jeong, Hyunjin, Yoon & Suk-Jin. 2019, ApJ, 870
- Kirby et al. (2001) Kirby E. N., Lanfranchi G. A., Simon J. D., Cohen J. G. & Guhathakurta P., 2011, ApJ, 727, 78
- Kleyna et al. (1998) Kleyna, J. T., Geller, M. J., Kenyon, S. J., Kutz, M. J. & Thorstensen, J. R., 1998, ApJ, 115, 2359
- Kleyna et al. (2003) Kleyna, J. T., Wilkinson, M. I., Gilmore, G. & Evans, N. W., 2003, ApJ, 588, L21
- Kleyna et al. (2004) Kleyna, J. T., Wilkinson, M. I., Evans, N. W. & Gilmore G., 2004, MNRAS, 354, L66
- Koch et al. (2006) Koch, A., Grebel, E. K., Wyse, R. F. G. et al. 2006, AJ, 131, 895
- Koch et al. (2007a) Koch, A., Wilkinson, M. I., Kleyna, J. T., et al. 2007a, ApJ, 657, 241
- Koch et al. (2007b) Koch, A., Kleyna, J. T., Wilkinson, M. I., et al. 2007b, AJ, 134, 566
- Koch et al. (2007c) Koch, A. et al. 2007c, AJ, 133, 270
- Koch et al. (2008) Koch, A., Grebel, E. K., Gilmore, G. F. et al., 2008, AJ, 135, 1580
- Koch et al. (2012a) Koch, A., Burkert, A., Rich, R. M. et al. 2012, ApJ, 755, 13
- Koch et al. (2012b) Koch, A., Lépine, S. & Çalişkan, Ş., 2012, EPJWC, 19, 3002
- Komiyama et al. (2007) Komiyama, Y. et al., 2007, AJ, 134, 835
- Kordopatis et al. (2016) Kordopatis, G., Amorisco, N. C., Evans, N. W., Gilmore, G. & Koposov, S. E., 2016, MNRAS, 457, 1299
- Lépine et al. (2011) Lépine S., Koch A., Rich R. M. & Kuijken, K., 2011, ApJ, 741, 100
- Łokas (2009) Łokas E. L., 2009, MNRAS, 394, L102
- Lora et al. (2013) Lora, V., Grebel, E. K., Sánchez-Salcedo, F. J. & Just, A., 2013, ApJ, 777,65
- Lora et al. (2012) Lora, V., Just, A., Sánchez-Salcedo, F. J. & Grebel, E. K., 2012, ApJ, 757, 87
- Lora et al. (2009) Lora, V., Sánchez-Salcedo, F. J., Raga, A. C. & Esquivel, A., 2009, ApJ, 699, L113
- Mackey & Gilmore (2003) MacKey A. D. & Gilmore G. F., 2003, MNRAS, 340, 175
- Mackey et al. (2016) Mackey, A. D., Koposov, S. E., Erkal, D. et al. 2016, MNRAS, 459, 239
- Majewski et al. (2003) Majewski, S. R., Skrutskie, M. F., Weinberg, M. D., & Ostheimer, J. C. 2003, ApJ, 599, 1082
- Maschenko et al. (2006) Mashchenko, S., Couchman, H. M. P., & Wadsley, J. 2006, Natur, 442, 539
- Mateo et al. (1991) Mateo M., Nemec J., Irwin M. & McMahon R., 1991, Astron. J., 101, 892
- Mateo et al. (1993) Mateo, M., Olszewski, E. W., Pryor, C., Welch, D. L. & Fischer, P. 1993, AJ, 105, 510
- Mateo (1998) Mateo M. L., 1998, ARA&A, 36, 435
- Mateo et al. (2008) Mateo M., Olszewski, E. W. & Walker, M. G. 2008, ApJ, 675, 201
- McConnachie et al. (2007) McConnachie, A. W., Arimoto, N. & Irwin, M., 2007, MNRAS, 379, 379
- McConnachie (2012) McConnachie, A. W. 2012, AJ, 144, 4
- McLaughlin & van der Marel (2005) McLaughlin, D.E. & van der Marel, R. P., 2015, ApJS, 161, 304
- Monelli (2003) Monelli, M., Pulone, L., Corsi, C. E., et al., 2003, AJ, 126, 218
- Monelli (2014) Monelli, M. et al. 2014, ApJ, 796, 90
- Muñoz et al. (2006) Muñoz, R. R., Majewski, S. R., Zaggia, S., et al., 2006, ApJ, 649, 201
- Muñoz et al. (2018) Muñoz, R. R. et al. 2018, 860, 66
- Navarro et al. (1997) Navarro, J. F., Frenk, C. S., & White, S. D. M. 1997, ApJ, 490, 493
- Nonino et al. (1999) Nonino, M., et al. 1999, A&AS, 137, 51
- Olczak et al. (2011) Olczak, C., Spurzem, R., & Henning, T., 2011, A&A, 532, A119
- Pasetto et al. (2010) Pasetto, S., Grebel, E. K., Berczik, P., Spurzem, R., & Dehnen, W. 2010, A&A, 514, 47
- Piatek et al. (2016) Piatek, S., Pryor, C. & Olszewski, E. W. 2016, AJ, 152, 166
- Pillepich et al. (2015) Pillepich, A., Madau, P. & Mayer, L., 2015, ApJ, 799, 184
- Roderick et al. (2016) Roderick, T. A., Jerjen, H., Da Costa, G. S. & Mackey, A. D., 2016, MNRAS 460, 30
- Sales et al. (2010) Sales L. V., Helmi A., Battaglia G., 2010, Advances in Astronomy, 2010, 194345
- Santana et al. (2016) Santana, A. S. et al. 2016, ApJ, 829, 86
- Schmeja (2011) Schmeja, S., 2011, A.N., 332, 172
- Simon & Geha (2007) Simon, J. D. & Geha, M., 2007, ApJ, 670, 313
- Spencer et al. (2017b) Spencer, M. E., Mateo, M., Walker, M. G. et al. 2017, AJ, 153, 254
- Spencer et al. (2017a) Spencer, M. E., Mateo, M., Walker, M. G. & Edward W. Olszewski, E. w., 2017, ApJ, 836, 202
- Sohn et al. (2013) Sohn, S. T. et al., 2013, ApJ, 768, 139
- Ural et al. (2010) Ural, U., Wilkinson, M. I., Koch, A. et al., 2010, MNRAS, 402, 1357
- Vogt et al. (1995) Vogt, S. S., Mateo, M., Olszewski, E. W. & Keane, M. J., 1995, AJ, 109, 151
- Walker et al. (2015) Walker, M. G., Olszewski, E. W., & Mateo, M. 2015, MNRAS, 448, 2717
- Walker et al. (2006) Walker, M. G., Mateo, M., Olszewski, E. W., Pal, J. K., Sen, B. & Woodroofe, M., 2006, ApJ 642, L41
- Zucker et al. (2006) Zucker, D. B., Belokurov, V., Evans, N. W., et al. 2006, ApJ, 643, L103