Frequency measurement of the transition of 27Al+ via quantum logic spectroscopy with 40Ca+
Abstract
We perform quantum logic spectroscopy with a 27Al+/40Ca+ mixed ion crystal in a linear Paul trap for a measurement of the intercombination transition in 27Al+. Towards this end, Ramsey spectroscopy is used for probing the transition in 27Al+ and the clock transition in 40Ca+ in interleaved measurements. By using the precisely measured frequency of the clock transition in 40Ca+ as a frequency reference, we determine the frequency of the intercombination line to be =1122 842 857 334 736(93) Hz and the Landé g-factor of the excited state to be =0.428132(2).
Keywords: trapped ions, mixed ion crystals, sympathetic cooling, quantum logic spectroscopy
1 Introduction
Narrow atomic transitions in the optical frequency domain can serve as extremely accurate frequency references with the potential to determine the atomic transition frequency with an uncertainty as low as one part in [1]. Over the last decade, optical atomic clocks [2] probing narrow transitions in neutral atoms or trapped ions have been developed that are rapidly approaching this ambitious goal. Through the interrogation of a large number of atoms, frequency standards based on neutral atoms held in optical lattices, achieve excellent short-term instabilities [3, 4]. Frequency standards interrogating only a single ion suffer from larger short-term instabilities but have the advantage to facilitate the control over systematic frequency shifts. Both, single-ion and lattice clocks, have demonstrated a control of systematic frequency uncertainties at the level of [5, 6, 7, 8, 9]. Thus, they surpass the performance of Cs clocks as testified by frequency ratio measurements between different clocks with an uncertainty of about [3, 10].
Single-ion frequency standards based on Hg+, Ca+, Sr+, or Yb+ have demonstrated systematic uncertainties below [7, 11, 12, 13]. These ions species are attractive since relativistic frequency shifts can be made small by laser-cooling the ions to sub-millikelvin temperatures and their clock transition can be measured using the electron shelving technique, which enables the detection of an ion’s quantum state with an efficiency close to 100%. They require, however, a careful evaluation of systematic frequency shifts such as electric quadrupole, ac-Stark or black-body radiation-induced shifts.
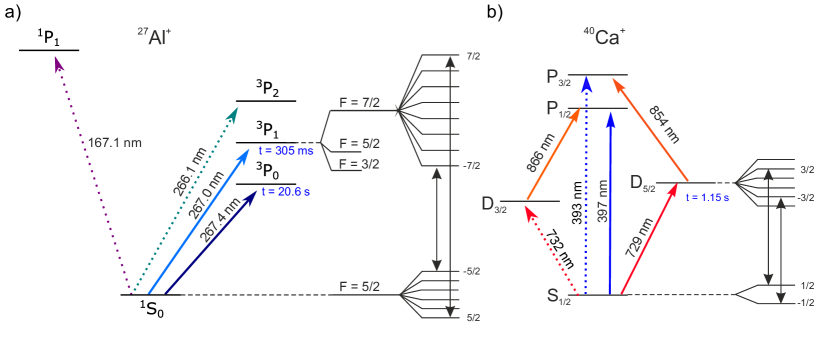
From this perspective, the clock transition in Al+ (see Fig. 1) has very attractive features, combining an extremely narrow linewidth of about 8 mHz at 267.4 nm, which gives rise to a high Q factor of , with high immunity to perturbations by external fields. The transition has a low dc second-order Zeeman shift, a very small black-body radiation shift, and a negligibly small electric quadrupole shift. The total contribution of this shifts to the total systematic relative uncertainty of the clock has been reported with values below [10, 14, 15] . For this reason, there are ongoing efforts in several laboratories for constructing an optical frequency standard based on 27Al+ [16, 17, 18, 19]. In addition, singly charged aluminium ions are a promising candidate for the construction of a transportable optical clock with low fractional systematic uncertainties [20].
Experiments with Al+ are complicated by the fact that the dipole-allowed transition that could be used for detecting the quantum state of the ion via state-dependent fluorescence measurements and for preparing the ion in a desired initial state has a wavelength of 167 nm. This makes the operation of Al+ clocks technically more challenging than the one of other ion clocks. Moreover, its linewidth of about 220 MHz is rather large so that Doppler cooling on this transition would lead to minimum temperatures that are a magnitude above the ones reached when Doppler cooling Ca+, Sr+, Hg+ or Yb+ ions [21]. The problem of detecting the quantum state of the aluminiun ion is overcome by quantum logic spectroscopy [22], a technique that enables detecting the quantum state of a trapped atomic or molecular ion [16, 23, 24, 25, 26, 27] by transferring the information to a co-trapped ion that can be easily read out.
Excitation of Al+ ions on their intercombination line at 267 nm by coherent laser pulses is a technique that enables a set of useful tools for the construction of an optical frequency standard. As the state has a lifetime of about s [28], the intercombination line can be used for initializing the ion in a pure electronic state by optical pumping, and, even more importantly, for high-fidelity state detection after probing its clock transition by repetitive quantum non-demolition measurements based on quantum logic spectroscopy [29]. Despite the importance of this transition, to our knowledge, a measurement of its transition frequency has only been carried out once before and reported in a conference abstract [30].
In the present paper, we describe quantum logic spectroscopy experiments with a two-ion crystal composed of a 27Al+ ion and a 40Ca+ ion. We use 40Ca+ as the logic ion primarily because of its similar mass and a relatively narrow cooling transition, which enables efficient sympathetic cooling [31]. Moreover, the quadrupole transition can be used for a direct clock comparison. Using a frequency comb, we measure the transition frequency of the line in 27Al+ by interleaving probing of this transition with probing of the quadrupole transition in 40Ca+, which is used as a frequency reference. As a test for systematic errors in the measurement of our 40Ca+ frequency reference, its transition frequency is compared to the ones measured in two other 40Ca+ experiments, which are located in neighbouring laboratories. In addition, we also determine the g-factor of the level.
The paper is organised as follows: the experimental apparatus is described in section 2. In section 3, we describe the preparation of the mixed 40Ca+–27Al+ ion crystal, the quantum logic spectroscopy protocol, and relative frequency measurements of the quadrupole transition in 40Ca+. In section 4, we describe the absolute frequency measurement of the transition, including a discussion of relevant systematic frequency shifts. We conclude the paper by a brief discussion of the results and preliminary measurements of the clock transition.
2 Experimental apparatus
The experimental apparatus that we designed for quantum-logic experiments with Ca+ and Al+ ions has been previously described in detail in the Ref. [32]. In the following, we provide a brief summary of its main features. Ions are stored in a blade-style linear ion trap mounted in an ultra-high vacuum chamber at a residual gas pressure of roughly 10-11 mbar. A magnetic field of about 4 G, which defines the quantisation axis along the symmetry axis of the trap, is created by a pair of coils driven by a current source with a long-term fractional current stability of about . Singly charged Al and Ca ions are created via two-step photoionisation from neutral atoms obtained by short-pulse ablation from two different targets. For Doppler cooling and detecting the Ca+ ions, we use the light of a frequency-doubled extended-cavity diode laser at 397 nm resonant with the transition (see Fig. 1). Two extended-cavity diode lasers, one emitting at 866 nm and the other at 854 nm are used as repumpers. The fluorescence emitted by calcium ions at 397 nm is recorded by a photomultiplier tube and an electron-multiplying CCD camera.
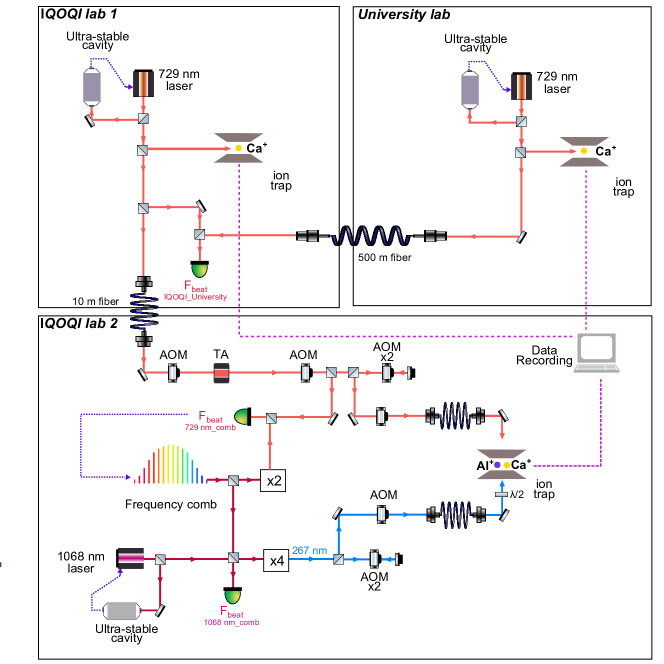
Figure 2 shows the laser setup used for probing and measuring the narrow transitions in and . For coherent manipulation of the electronic and motional state of the calcium ion, the quadrupole transition at 729 nm is excited by a titanium-sapphire laser locked to a high-finesse cavity yielding a spectral linewidth on the order of 1 Hz on the time scale of a few seconds; the fibre-induced noise between the laser and the cavity is suppressed by using a similar arrangement as in Ref. [33]. The transition frequency can simultaneously be compared with frequency measurements obtained in two other 40Ca+ experiments in nearby laboratories, designated from now on in the paper as IQOQI lab 1 and University lab (see Fig. 2). The experiment setups of both laboratories are described in Refs.[24, 34], respectively. The fibres connecting different laboratories have optical path lengths that are interferometrically stabilised.
For excitation of the transition in 27Al+ a frequency-quadrupled extended-cavity diode laser is used, with a maximum output power of 20 mW at 267.0 nm. The fundamental radiation at 1068 nm of this laser system is stabilised to a high finesse cavity (). Additionally, a frequency-quadrupled fibre laser is available for excitation of the clock transition at 267.4 nm. Beat measurements between the two lasers (tuned to the same wavelength) reveal a linewidth of 1.6 Hz FWHM or less at 4 s at the fundamental frequency of the lasers. In order to guide the 267.0 nm light to the ion, we implemented a solid–core photonic crystal fibre made from fused silica [35]. This arrangement has the advantage of providing a clean beam profile, thus minimizing the amount of UV light that could illuminate the trap electrodes giving rise to the emission of undesired photo-electrons. The Al+/Ca+ two-ion crystal is illuminated by approximately 200 W of 267.0 m light by a laser beam parallel to the weak axis of the trap with a beam diameter of m. During the quantum logic spectroscopy experiments the frequency of the 1068 nm laser is measured with a femtosecond frequency comb whose repetition rate is locked to the frequency of the ultra-stable laser at 729 nm located at IQOQI lab1.
3 Experimental results
Our experiments start by loading a single Ca+ ion into the trap and optimizing its cooling and fluorescence measurements. Typical oscillation frequencies of a single Ca+ ion are 820 kHz along the weak axial direction of the trap and about 1.5 MHz along the radial directions. Micromotion caused by residual electric stray fields is detected by probing the micromotion sidebands of the to transition. It is compensated by applying additional voltages to two compensation electrodes shifting the ion in the radial plane of the linear trap and by unbalancing the dc-voltages applied to the tip electrodes providing the axial confinement. Modulation indices of less than on the transition used for micromotion compensation are obtained at the end of the procedure.
3.1 Trapping, cooling and motional analysis of two-ion Ca+/Al+ crystals
As described in Ref. [32], a ion crystal is created by loading an Al+ via laser ablation. In experiments probing the intercombination line, mixed ion crystal lifetimes of several hours are typically observed, limited by background gas collisions leading to ion loss or chemical reactions giving rise to conversion of atomic ions to unwanted molecular ions such as AlH+. The mass of molecular ions created in the trap is inferred from “tickling” measurements, in which the fluorescence of the calcium ion is measured as a function of the frequency of a weak electric field capable of exciting the in-phase collective motion of the crystal along its axis.
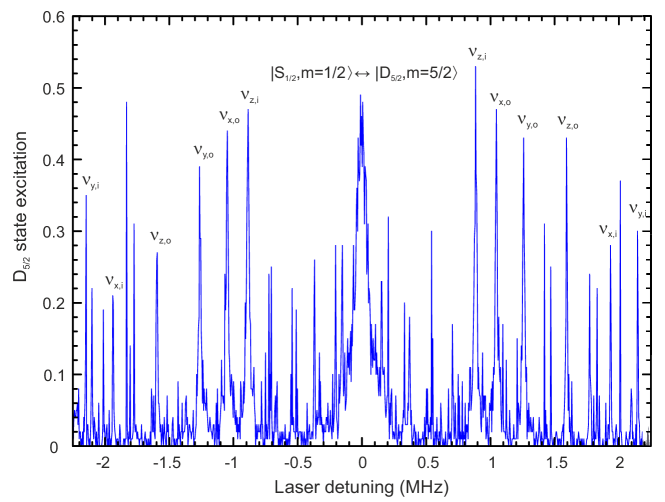
A second tool for investigating the collective motion of the two-ion crystal is provided by measurements of absorption sideband spectra on the quadrupole transition in Ca+. Figure 3 shows a part of an absorption spectrum obtained by a laser beam with overlap with all six collective modes of motion, which give rise to upper and lower vibrational sidebands of the carrier transition shown in the center of the plot.
For carrying out the quantum logic spectroscopy protocol described further below (section. 3.3), one common vibrational mode of the crystal has to be cooled to its ground state. We observe heating rates of the axial in-phase (zin) and out-of-phase (zout) mode of 70 phonons/s and 0.8 phonons/s, respectively. Due to its lower heating rate, the zout mode was chosen as the bus mode for the quantum state transfer. Possible dispersive frequency shifts by cross-mode coupling to other collective modes [36] are at the level of a few Hertz and thus too small to be relevant for the experiments described in this paper. In our experiments, we cool both axial vibrational modes to mean phonon numbers below 0.05 by sideband cooling the calcium ion, in order to minimise coupling strength fluctuations when resonantly exciting sideband transitions in Al+ or Ca+.
3.2 Preparation of the Al+ ion in a specific Zeeman ground state
The Al+ ion is initialised in a pure electronic state by optical pumping on the intercombination line. In our current experiment, there is only a single laser beam available for exciting the ion from a direction that is parallel to the quantisation axis set by the magnetic field. By making its polarisation circular, it is used to populate either one of the stretched Zeeman states using a series of carrier -pulses exciting the five Zeeman transitions that can be used for pumping out the undesired Zeeman states.
We also tested whether frequency-resolved optical pumping to the stretched states could be achieved by making the beam’s polarisation linear. This approach comes with the prospect of being able to optically pump into any Zeeman state or to rapidly switch between populating one or the other stretched state by optical pumping without resetting the beam’s polarisation. This approach enabled us to excite all available Zeeman transitions using the protocol described below. We found, however, that the pumping worked less reliably as compared to the one by a circularly polarised beam. We attribute these difficulties to coherent population trapping and ac-Stark shifts by the unwanted polarisation component as adjacent Zeeman ground states have energy shifts of less than 10 kHz at a magnetic field of 4 G. From this perspective, it seems more promising to add fast polarisation control or a second laser beam with a different polarisation to the experimental setup.
3.3 Quantum logic spectroscopy of the transition
Quantum logic spectroscopy experiments probing the intercombination line in Al+ are carried out by using the following steps for quantum state initialisation, excitation, and probing:
-
1.
Logic ion initialisation: The ion crystal is prepared in the Lamb-Dicke regime by 5 ms of Doppler cooling on the transition of Ca+ at 397 nm. Light at 866 nm and 854 nm is used to optically pump out the metastable and states of the logic ion. A circularly polarised beam at 397 nm oriented in the direction of the quantisation axis initialises the calcium ion in one of the ground states.
-
2.
Spectroscopy ion initialisation: The Al+ ion is optically pumped into either one of the two stretched Zeeman states of the ground state by exciting the to intercombination line with a circularly polarised beam at 267 nm counterpropagating to the circularly polarised beam at 397 nm. A series of laser pulses driving the five Zeeman transitions () with pulse areas of followed by a waiting time of 300 s pushes the population towards the target state. This sequence of pulses is repeated 10 times in order to populate the stretched Zeeman state.
-
3.
Ground-state cooling and logic ion preparation: Both axial modes are sideband-cooled close to the ground state by two laser pulses on the quadrupole transition at 729 nm with a total duration of 7 ms. To minimise the average vibration quantum number of the out-of-phase mode used for the quantum logic state transfer, the in-phase-mode is cooled prior to cooling the out-of-phase mode. Finally, a carrier -pulse transfers the Ca+ ion into the state.
-
4.
Spectroscopy ion probing: The carrier transition is probed by either a single pulse or in a Ramsey experiment by a pair of pulses separated by a waiting time.
-
5.
Quantum state transfer: For state mapping to the logic ion, a -pulse of the upper motional sideband of the out-of-phase mode on the transition adds a phonon to the system if the previous carrier excitation was unsuccessful. The phonon is mapped to a change of the electronic state in Ca+ by a consecutive -pulse on the upper motional sideband of the same mode on the transition, which returns the calcium ion to its electronic ground state. As a result, the calcium ion is found in if the aluminium ion was excited to the metastable state by the carrier excitation pulse of step (iv).
-
6.
Quantum state detection: The quantum state of Ca+ is measured via electron shelving.
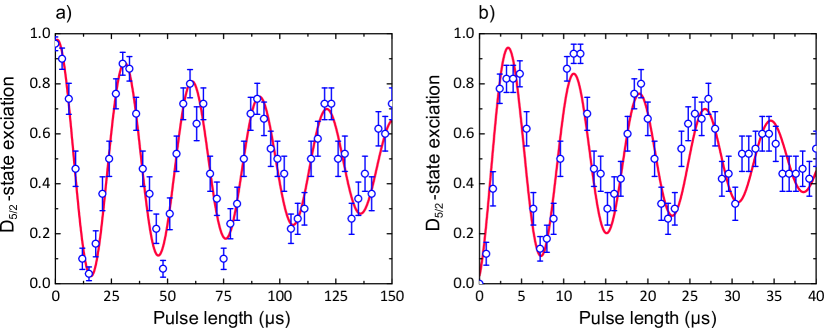
Figure 4 shows an application of this protocol that was used for recording Rabi oscillations on the blue sideband and the carrier transition of the transition. Note, that in this case, we omit step (iv) and vary the duration fo the sideband pulse in step (v). It demonstrates that -pulses can be realised on the sideband with a fidelity of about 95 % and that the Al+ ion can be coherently excited to the metastable state by a carrier -pulse with a duration of about s. On the carrier transition, the loss of contrast versus time is predominantly caused by high-frequency phase noise of the quadrupled diode laser system. This assumption is corroborated by the fact that the ratio between the damping rate of the oscillations and the carrier Rabi frequency is not constant but increases with in qualitative agreement with the measured spectral phase noise of the laser. On the sideband, the contrast loss is due to laser phase noise and loss of population from the upper state by spontaneous emission.
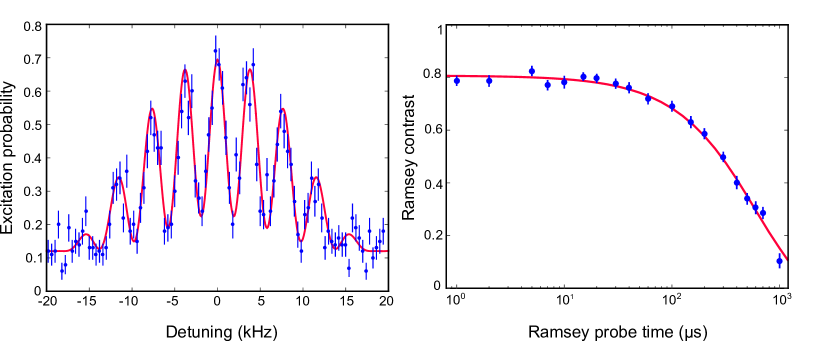
For a further investigation of the coherence time on the intercombination line, Ramsey experiments on the carrier transition were carried out using the quantum logic spectroscopy protocol for state read-out. Figure 5(a) shows the Ramsey signal as a function of laser detuning, whereas Fig. 5(b) shows the Ramsey contrast as a function of the waiting time between the -pulses. At short waiting times a Ramsey contrast of 0.81(1) is obtained which is limited by imperfect and state mapping pulses. At longer waiting times, the contrast decays exponentially with time, in agreement with the expected contrast loss caused by spontaneous decay of the state.
3.4 Probing the transition in 40Ca+
The transition in 40Ca+ was used as a stable and calibrated frequency reference [13, 34, 37] for the 729 nm laser and as a magnetic field sensor. In order to keep track of any frequency drift of the 729 nm laser or any magnetic field fluctuations we probed two different Zeeman transitions, , as illustrated in Fig. 1, with Ramsey experiments composed of -pulses of s duration that were separated by a 2 ms waiting time. The frequency shift of the laser f is given by the arithmetic mean of the measured detunings from the two transitions. As the -factors of the electronic states are well-known, the frequency splitting of the Zeeman transitions provides also a measure of the absolute value of the dc-magnetic field fluctuations B. Choosing two opposite Zeeman transitions has the advantage of cancelling not only the first-order dc-Zeeman shift but also possible ac-Zeeman shifts caused by currents oscillating at the trap drive frequency.
To ensure that systematic frequency shifts do not cause any significant error in the determination of the frequency of the intercombination line in Al+, a direct comparison of the calcium transition frequency measured in three different laboratories was made. The frequency measured in our experimental setup (IQOQI lab 2) was compared to the frequency measured in two similar experimental setups (see Fig. 2). The setups of IQOQI lab1 and IQOQI lab 2 share the same 729 nm laser while the University lab has its own independent laser setup. Laser beat measurements show, after subtraction of a linear frequency drift, that the two lasers differ by no more than 10 Hz over the course of several hours. For the frequency comparison, two Zeeman transitions, , were probed with Ramsey experiments of 3 ms duration during a period of five hours. The data was subsequently binned into one-minute intervals and the frequency difference between two setups was evaluated. Fig. 6 shows histograms of the measured frequency differences with the other two setups.
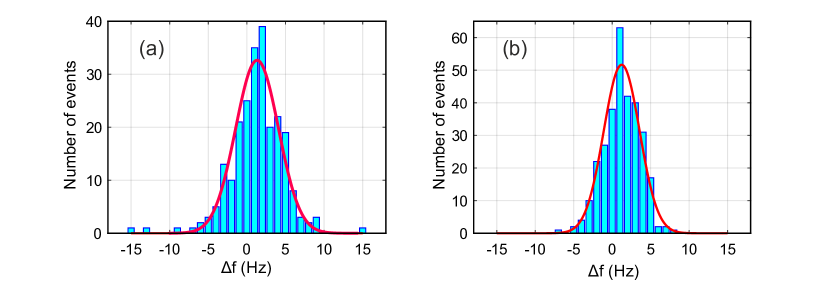
The frequency measured in the IQOQI lab 2 experimental setup differed by 1.3(2) Hz from the value measured in IQOQI lab 1, and by 1.2(2) Hz from the value found in University lab. We attribute the offsets between the labs mainly to different electric quadrupole shifts due to different axial trapping confinements and stray electric field gradients, and to a lesser degree to AC Stark shifts caused by stray light. A detailed investigation of the systematic frequency shift of a single Ca+ ion clock can be found in Ref. [34]. After subtraction of known systematic shifts, the frequencies agree with each other to better than 1 Hz.
4 Frequency measurement of the intercombination transition
In the following, we will describe how we infer the absolute frequency of the intercombination line from the measurement results we obtained when probing the transition and discuss the corresponding error budget.
4.1 Measurement results
For a measurement of the transition, we probe the Al+ ion with Ramsey experiments as described in subsection 3.3. The fundamental frequency of the laser probing the transition is recorded with the frequency comb whose repetition rate is locked to the frequency of the ultrastable laser at 729 nm. The frequency of the latter is monitored by Ramsey experiments on Ca+ that are interleaved with experiments probing the Al+ ion. In this way, the frequency of the intercombination line can be determined with respect to the well-known transition frequency of . The comb measurements show that frequency fluctuations of the light probing the intercombination line in Al+ are typically about 60 Hz over the course of fifteen minutes.
We interrogated the Zeeman transition with Ramsey experiments composed of -pulses of s duration separated by a waiting time of either 100 or 200 s. The phase of the second -pulse was shifted with respect to the first one by either , , or , in order to extract both the laser-ion detuning and the contrast of the Ramsey fringe. For each setting of , the experiment was repeated 100 times. Next, another four sets of 100 experiments were carried out probing two Zeeman transitions in as described in subsection 3.4, with the phase of the second Ramsey pulse shifted by , for a measurement of the detuning of the laser at 729 nm from the atomic transition and the magnetic bias field. This cycle of eight different experiments was repeated fifty times followed by a recalibration of experimental parameters. The same type of experiment was also carried out for a measurement of the Zeeman transition. The absolute value of the transition frequency is obtained with respect to the transition frequency of the transition in , Hz, where we took the weighted average of the frequency measurements reported by three different groups in Refs. [13, 34, 37].
Our evaluation of the transition frequency is based on a total of 18 sets of measurements. For each set, the uncertainty of the measured average deviation of the laser frequency from the atomic transition is predominantly given by quantum projection noise. For the probed Zeeman transitions, the transition frequency at non-zero magnetic field is related to the transition frequency at zero magnetic field by where depending on which of the two stretched state transitions is probed, with the Bohr magneton and Planck’s constant. For each measurement set, we determine the magnetic field strength by measuring the frequency splitting of the two Zeeman transitions probed in Ca+ with an uncertainty of about 1 Gauss.
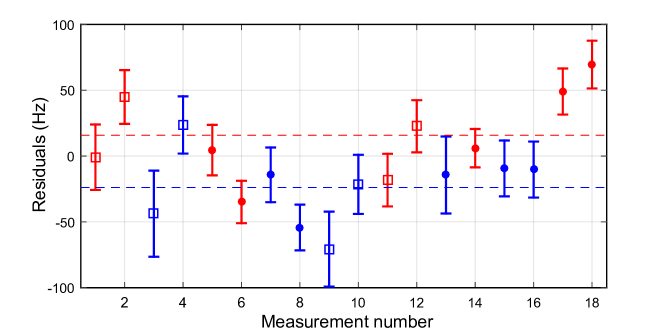
We plot the measured frequency as a function of and fit a straight line to the data in order to extract and the g-factor of the state. This procedure yields a transition frequency at of Hz with a statistical uncertainty of Hz. The residuals of the fit are shown in Fig. 7 with error bars accounting for the standard deviation of the fifty frequency measurements per data set and errors in the determination of the magnetic field.
The scatter of the data points is somewhat bigger than what one would expect given the error bars of the individual data points. Moreover, the measurements with free Ramsey durations of 200 s yield a frequency estimate differing by Hz from the measurement based on Ramsey experiments of 100 s duration. To evaluate the statistical significance of this finding, we test the null hypothesis that the determined frequency is independent of the duration of the Ramsey experiment. Under this hypothesis, the difference (with -distributed Gaussian random variable describing the outcome of the measurement with Ramsey duration ) is itself a Gaussian random variable with a distribution given by with Hz. Then, the probability of finding a difference of or larger is given by . This rather small -value makes it seem unlikely that there was no systematic shift present in the experiment. However, no such shift was detected in subsequent control experiments probing the transition by alternating between Ramsey experiments of 100 and 200 s duration. From the variation of the magnetic-field-induced splitting MHzG and the knowledge of [23], we determine the Landé g-factor of the excited state to be .
4.2 Evaluation of systematic frequency shifts and measurement uncertainties
For the evaluation of the transition frequency, both systematic frequency shifts in Al+ and Ca+ need to be taken into consideration. The scatter of the frequency measurements shown in Fig. 7 suggests that an unexpected systematic shift might have been present when these measurements were taken. Even though it seems unlikely, the frequency shift of 40 Hz between the measurements taken with 100 s (200 s) Ramsey time could have been caused by an ac-Stark shift shifting the transition frequency during the -pulses. This effect would vanish in the limit of infinitely long Ramsey experiments and lead to a systematic shift of 85 Hz in the frequency measurement. As we cannot exclude the existence of such a shift, we added an uncertainty of 85 Hz to our error budget.
The electric quadrupole moment of the level of the ion couples to any static electric field gradients in the trap. The dominant electric field gradient is caused by the quadrupolar static electric potential confining ions axially and by the electric field gradient of the co-trapped ion. These field gradients will shift the energy of the stretched levels by . Following the prescription of Refs. [15, 31] for calculating the second derivative of the potential for a mixed ion crystal with 888 kHz axial in-phase oscillation frequency, one obtains a frequency shift of -7.4 Hz for the stretched Zeeman states where we used the reduced matrix element calculated in Ref. [15] for the estimation of the shift.
The fine-structure mixing effect of a non-zero magnetic field gives rise to a small second-order Zeeman shift of the states via a coupling to the states with the same magnetic quantum number. Using second order perturbation theory, the quadratic Zeeman shift can be approximated by , [38, 39] where is the fine-structure crossover field, with , and THz the coupling constant. For the 3P2-3P1 fine-structure splitting we have L=1, S=1, J’= 2 and Bfs=265.344 G. We calculate for the quadratic frequency shift of the J=M=1 level that . For a magnetic field of approximately 4 G the systematic shift amounts to only -2.109(0.005) Hz.
In , the state has an electric quadrupole moment of [40] where is the elementary charge and the Bohr radius. The interaction of the electric quadrupole moment with the static electric field gradient of the linear ion trap (i.e. the dominant field gradient in our experiments) upshifts the Zeeman states by 2.83 Hz. Additionally, there is a second-order Zeeman shift by the magnetic field that couples the Zeeman levels of the state to the levels of the state having the same magnetic quantum number. A field of 4 G causes a frequency shift of the levels of 2.79 Hz. Both shifts taken together result in a 15.1(3) Hz correction of the transition frequency in Al+. Other sources of frequency shifts such as black-body radiation, time-dilation shifts by excess micromotion or non-zero secular motion are expected to be no bigger than 1 Hz. This claim is supported by the absence of any large frequency shifts in the comparison with other Ca+ experiments (subsection 3.4).
The systematic frequency shifts discussed above are summarised in Table 1. Taking them into consideration leads to a correction of 24.5 Hz of the transition frequency and results in a measured transition frequency of Hz.
| Effect | Ca shift (uncertainty)[Hz] | Al shift (uncertainty) [Hz] |
|---|---|---|
| frequency | 0 (4) | - |
| Electric quadrupole shift | 2.7(0.1) | -7.4 |
| 2nd order Zeeman shift | 2.8 | -2.1 |
| Ramsey probe time dependence | - | 0 (85) |
| Statistics | - | 0 (36) |
| Total shift | 5.5(4.0) | -9.5 (92.0) |
Systematic frequency shifts also need to be considered for the determination of the state’s g-factor. Electric quadrupole shifts and second-order Zeeman shifts do not affect the g-factor determination as they shift both stretched Zeeman states by the same amount. Ac-Zeeman and ac-Stark shifts, however, need to be considered. The ac-magnetic field generated by the ion trap drive at 32 MHz gives rise to a shift of the probed Zeeman transitions in Ca+ that mimics an additional dc-magnetic field of about 4 G. For the dc-field of 4 G used in the experiment, this corresponds to a fractional error of in the g-factor determination which is below our measurement uncertainty. In Al+, due to the smaller splitting of the Zeeman levels, the ac-magnetic field shift is even smaller. The static magnetic field gradient of 30 G/m causes only a negligible magnetic field difference in the two ion locations and can thus be neglected. Ac-Stark shifts on the transition that arise from off-resonant coupling to the axial out-of-phase sideband transitions or to transitions induce fractional errors in the g-factor determination of well below . Therefore, we conclude that systematic shifts do not alter the measured g-factor value of .
5 Discussion and conclusion
Using the SD5/2 quadrupole transition of 40Ca+ as a frequency reference, we have employed quantum logic spectroscopy for a measurement of the (3s2)1Ss3p)3P1, F =72 intercombination transition in 27Al+ with an uncertainty of 1̃00 Hz. Our results are consistent with previous measurements of the transition [30] and improve the uncertainty by one order of magnitude. While the transition itself is not particularly interesting as a frequency standard, its coherent excitation is an enabling technology for detecting population in the state when exciting the highly relevant clock transition.
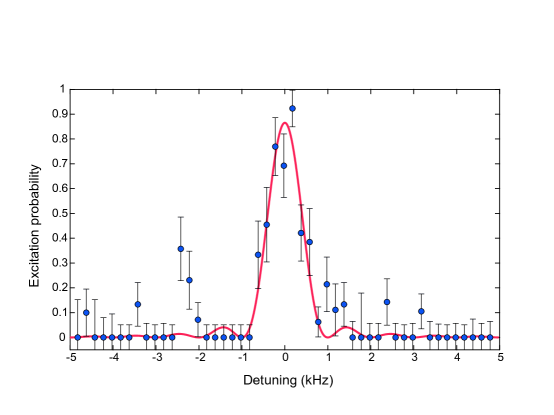
Recently, we have also probed the clock transition. Figure 8 shows a spectrum of the Zeeman transition with a probe-time limited width of 1 kHz. Efforts to obtain spectrally narrower lines are hampered by two experimental shortcomings, namely frequency drifts of the frequency-quadrupled fibre laser probing the clock transition and creation of molecular ions by reaction of with background gas molecules. Molecular ion creation limits the time for experiments probing the clock transition to about 15 minutes, which, in combination with long reloading times [32], prevented us from investigating the clock transition more thoroughly. This will be subject to future work once the apparatus has been improved.
References
References
- [1] Dehmelt H G 1982 IEEE Trans. Instr. Meas. 31 83–87
- [2] Ludlow A D, Boyd M M, Ye J, Peik E and Schmidt P O 2015 Rev. Mod. Phys. 87 637–701
- [3] Nemitz N, Ohkubo T, Takamoto M, Ushijima I, Das M, Ohmae N and Katori H 2016 Nat. Phot. 10 258
- [4] Schioppo M, Brown R C, McGrew W F, Hinkley N, Fasano R J, Beloy K, Yoon T H, Milani G, Nicolodi D, Sherman J A, Phillips N B, Oates C W and Ludlow A D 2017 Nat. Phot. 11 48–52
- [5] Oelker E, Hutson R B, Kennedy C J, Sonderhouse L, Bothwell T, Goban A, Kedar D, Sanner C, Robinson J M, Marti G E, Matei D G, Legero T, Giunta M, Holzwarth R, Riehle F, Sterr U and Ye J 2019 arXiv:1902.02741
- [6] Brewer S M, Chen J S, Hankin A M, Clements E R, Chou C W, Wineland D J, Hume D B and Leibrandt D R 2019 arXiv:1902.07694
- [7] Huntemann N, Sanner C, Lipphardt B, Tamm C and Peik E 2016 Phys. Rev. Lett. 116(6) 063001
- [8] Chen J S, Brewer S M, Chou C W, Wineland D J, Leibrandt D R and Hume D B 2017 Phys. Rev. Lett. 118(5) 053002
- [9] Hankin A, Clements E, Huang Y, Brewer S, Chen J S, Chou C, Hume D and Leibrandt D 2019 arXiv preprint arXiv:1902.08701
- [10] Rosenband T, Hume D B, Schmidt P O, Chou C W, Brusch A, Lorini L, Oskay W H, Drullinger R E, Fortier T M, Stalnaker J E, Diddams S A, Swann W C, Newbury N R, Itano W M, Wineland D J and Bergquist J C 2008 Science 319 1808–1812
- [11] Oskay W H, Diddams S A, Donley E A, Fortier T M, Heavner T P, Hollberg L, Itano W M, Jefferts S R, Delaney M J, Kim K, Levi F, Parker T E and Bergquist J C 2006 Phys. Rev. Lett. 97 020801
- [12] Barwood G P, Huang G, Klein H A, Johnson L A M, King S A, Margolis H S, Szymaniec K and Gill P 2014 Phys. Rev. A 89(5) 050501
- [13] Huang Y, Guan H, Liu P, Bian W, Ma L, Liang K, Li T and Gao K 2016 Phys. Rev. Lett. 116(1) 013001
- [14] Rosenband T, Itano W M, Schmidt P O, Hume D B, Koelemeij J C J, Bergquist J C and Wineland D J 2006 Blackbody radiation shift of the 27Al+ 1SP0 transition Proceedings of the 20th European Frequency and Time Forum
- [15] Beloy K, Leibrandt D R and Itano W M 2017 Phys. Rev. A 95(4) 043405
- [16] Schmidt P O, Rosenband T, Langer C, Itano W M, Bergquist J C and Wineland D J 2005 Science 309 749–752
- [17] Wuebbena J 2014 Controlling Motion in Quantum Logic Clocks (PhD thesis, Leibniz Universität Hannover) phdthesis Leibniz Universität Hannover
- [18] Xu Z T, Yuan W H, Zeng X Y, Che H, Shi X H, Deng K, Zhang J and Lu Z H 2016 Journal of Physics: Conference Series 723 012026
- [19] Cui K F, Shang J J, Chao S J, Wang S M, Yuan J B, Zhang P, Cao J, Shu H L and Huang X R 2018 Journal of Physics B: Atomic, Molecular and Optical Physics 51 045502
- [20] Hannig S, Pelzer L, Scharnhorst N, Kramer J, Stepanova M, Xu Z T, Spethmann N, Leroux I D, Mehlstäubler T E and Schmidt P O 2019 arXiv:1901.02250
- [21] Kramida A, Ralchenko Y, Reader J, NIST and ASD Team 2018 NIST Atomic Spectra Database (version 5.6.1) National Institute of Standards and Technology, Gaithersburg, MD. DOI: https://doi.org/10.18434/T4W30F
- [22] Wineland D, Bergquist J, Bollinger J, Drullinger R and Itano W 2002 Quantum computers and atomic clocks Proc. 6th Symposium on Frequency Standards and Metrology, St. Andrews, Scotland, Sept. 9 - 14, 2001. ed Gill P (Singapore: World Scientific) pp 361–368
- [23] Rosenband T, Schmidt P, Hume D, Itano W, Fortier T, Stalnaker J, Kim K, Diddams S, Koelemeij J, Bergquist J and Wineland D 2007 Phys. Rev. Lett. 98 220801
- [24] Hempel C, Lanyon B P, Jurcevic P, Gerritsma R, Blatt R and Roos C F 2013 Nat. Phot. 7 630–633
- [25] Wan Y, Wübbena F G B, Scharnhorst N, Leroux S A D, Lörch B H, Hammerer K and Schmidt P O 2014 Nat. Comm. 5 4096
- [26] Wolf F, Wan Y, Heip J C, Gebert F, Shi C and Schmidt P O 2016 Nature 530 457–460
- [27] Chou C W, Kurz C, Hume D B, Plessow P N, Leibrandt D R and Leibfried D 2017 Nature 545 203–207
- [28] Träbert E, Wolf A, Linkemann J and Tordoir X 1999 Journal of Physics B: Atomic, Molecular and Optical Physics 32 537
- [29] Hume D B, Rosenband T and Wineland D J 2007 Phys. Rev. Lett. 99 120502
- [30] Rosenband T, Schmidt P O, Kobayashi Y, Langer C, Itano W M, Diddams S A, Bergquist J and Wineland D J 2005 Al+ spectroscopy via sympathetic cooling and quantum information transfer using Be+. Abstract submitted for the DAMOP05 meeting of the American Physical Society. http://meetings.aps.org/link/BAPS.2005.DAMOP.L4.7 URL http://meetings.aps.org/link/BAPS.2005.DAMOP.L4.7
- [31] Wübbena J B, Amairi S, Mandel O and Schmidt P O 2012 Phys. Rev. A 85 043412
- [32] Guggemos M, Heinrich D, Herrera-Sancho O A, Blatt R and Roos C F 2015 New J. Phys. 17 103001
- [33] Ma L, Jungner P, Ye J and Hall J L 1994 Opt. Lett. 19 1777
- [34] Chwalla M, Benhelm J, Kim K, Kirchmair G, Monz T, Riebe M, Schindler P, Villar A S, Hänsel W and Roos C F 2009 Phys. Rev. Lett. 102 023002
- [35] Colombe Y, Slichter D H, Wilson A C, Leibfried D and Wineland D J 2014 Optics Express 22 19783
- [36] Roos C F, Monz T, Kim K, Riebe M, Häffner H, James D F V and Blatt R 2008 Phys. Rev. A 77 040302(R)
- [37] Matsubara K, Hachisu H, Li Y, Nagano S, Locke C, Nogami A, Kajita M, Hayasaka K, Ido T and Hosokawa M 2012 Opt. Express 20 22034–22041
- [38] Walraven J 2018 Private Communication
- [39] Sobelman I I 2012 Atomic spectra and radiative transitions vol 12 (Springer Science & Business Media)
- [40] Roos C F, Chwalla M, Kim K, Riebe M and Blatt R 2006 Nature 443 316–319