Correlations between supermassive black holes, hot atmospheres, and the total masses of early type galaxies
Abstract
We present a study of relations between the masses of the central supermassive black holes (SMBHs) and the atmospheric gas temperatures and luminosities measured within a range of radii between and 5, for a sample of 47 early-type galaxies observed by the Chandra X-ray Observatory. We report the discovery of a tight correlation between the atmospheric temperatures of the brightest cluster/group galaxies (BCGs) and their central SMBH masses. Furthermore, our hydrostatic analysis reveals an approximately linear correlation between the total masses of BCGs () and their central SMBH masses (). State-of-the-art cosmological simulations show that the SMBH mass could be determined by the binding energy of the halo through radiative feedback during the rapid black hole growth by accretion, while for the most massive galaxies mergers are the chief channel of growth. In the scenario of a simultaneous growth of central SMBHs and their host galaxies through mergers, the observed linear correlation could be a natural consequence of the central limit theorem.
keywords:
galaxies: evolution – galaxies: formation – galaxies: active – X-rays: galaxies1 Introduction
The masses of central supermassive black holes (SMBHs) are known to correlate with the luminosities and velocity dispersions of the stellar bulge components of their host galaxies, suggesting a coevolution of the two (Magorrian et al., 1998; Gebhardt et al., 2000; Ferrarese & Merritt, 2000; Kormendy & Ho, 2013; Saglia et al., 2016). Most of the previous studies have explained the observed correlations based on the active galactic nucleus (AGN) feedback induced by the gas accreted onto the SMBH (Silk & Rees, 1998; King, 2003; Churazov et al., 2005). This picture relies on the assumption that the AGN feedback couples efficiently to the circum-SMBH gas, regulating the growth of both the SMBH and the bulge component.
However, the origin of the observed correlations may also be non-causal (Peng et al., 2007; Jahnke & Macciò, 2011; Volonteri et al., 2011). This view is based on the central limit theorem, which suggests that a sufficient number of mergers would lead to the growth of both the mass of the SMBH () and the host galaxy’s total mass (), resulting in a linear correlation between the two. As a consequence, any quantity that traces , must be a good proxy for .
Previous studies (see Ferrarese, 2002; Baes et al., 2003) investigated the connection between and (which also includes the mass of the underlying dark matter halo), based on a correlation between the circular velocity (; related to ) and the stellar velocity dispersion (; related to ). This was later rejected based on the argument that it is a result of a ‘conspiracy’ between baryons and dark matter that also makes the rotation curves flat (Kormendy & Bender, 2011). Recently, a relationship was also suggested between the of the brightest cluster/group galaxies (BCGs) and the virial masses of their host clusters/groups, estimated from the temperature of the intra-cluster medium, albeit with a relatively large scatter of 0.4-0.9 dex (see Bogdán et al., 2018; Phipps et al., 2019).
The growth of SMBHs has also been investigated using cosmological simulations. Using the EAGLE simulations, McAlpine et al. (2018) (see also Bower et al., 2017, Fig. 2 & 6) identify three distinct phases of a SMBH’s growth depending on the mass of the host galaxy (): i) in low-mass galaxies ( ) SMBH’s growth is hindered by supernovae driven winds, ii) at , SMBHs undergo a fast growth phase via gas accretion, thanks to the formation of hot atmospheres that efficiently prevent the supernovae-driven winds from buoyantly rising out of the galaxy’s central region, and iii) in the largest galaxies ( ), SMBHs are massive enough to inject sufficient energy via kinetic mode so that they can regulate the inflow of gas and then retire to a Bondi-like low accretion rate. Weinberger et al. (2018), using the Illustris TNG300 simulations, find a similar pattern of SMBH growth, adding that for the most massive SMBHs ( ) mergers become the chief channel of growth (see also Bassini et al., 2019).
In this work, we have investigated the correlation between and the hot galactic atmospheres of the host galaxies, based on the analysis of their Chandra X-ray observations111An independent paper submitted for publication by Gaspari et al. (2019) investigates the relation between the masses of supermassive black holes and hot atmospheres based on literature measurements and proposes a different interpretation.. The details of the sample are given in §2.1; the data reduction and analysis details are given in §2.2; the results are described in §3 and discussed in §4.
2 Sample and Data
2.1 Sample Selection
We have analysed archival Chandra X-ray observations for a sample of early-type galaxies, selected based on the availability of estimates, obtained using
stellar/gas dynamics (Kormendy &
Ho, 2013, from Saglia
et al., 2016, , van den
Bosch, 2016, and ), and archival Chandra X-ray observations.
The black hole masses for galaxies undergoing mergers can be severely underestimated (see Kormendy &
Ho, 2013). Therefore, we excluded the galaxies
with recent/ongoing mergers (NGC 1316, NGC 2960, NGC 4382, NGC 5128, IC 1481, NGC 741, NGC 3379).
As done in Kormendy &
Ho (2013), we also excluded the galaxies with SMBH masses estimated based on kinematics of ionized gas but without the broad emission
line widths being taken into account (NGC 2778, NGC 3607, NGC 4261, NGC 4459, NGC 6251, NGC 7052, A1836 BCG, Cygnus A and NGC 4596) as that can also lead to
an underestimation of the SMBH mass. We also excluded the well known shell galaxies NGC 3923 and IC 1459. The emission in NGC 821 and NGC 3115 was found to be heavily contaminated
by the emission from unresolved point sources and therefore were excluded from the sample. The X-ray spectra extracted for NGC 5845, NGC 4026, NGC 4564 and NGC 7457
had very few counts, and therefore were deemed unusable for the analysis. The SMBH masses for 3C 449 and NGC 3945 were found to be exceedingly uncertain and therefore were
excluded from the sample. The properties of the finally selected 47 galaxies, including 18 brightest central
cluster/group galaxies (BCGs), 16 non-BCG elliptical galaxies, and 13 lenticular galaxies, are listed in Table 1.
| Name | Distance (Mpc) | (kpc) | (keV) | (1042 erg s-1) | (109 ) | (km s-1) | (5) (1012 ) | / Ref. |
| BCGs | ||||||||
| NGC 315 | 57.7 | 10.2 | 0.700.01 | 0.1200.035 | 30929 | 1.830.39 | van den Bosch (2016) | |
| NGC 1052 | 18.1 | 2.2 | 0.320.02 | 0.00220.0002 | 1914 | 0.090.02 | van den Bosch (2016) | |
| NGC 1332 | 22.3 | 4.8 | 0.620.02 | 0.0080.004 | 3289 | 0.750.08 | Kormendy & Ho (2013) | |
| NGC 1399 | 20.9 | 5.5 | 1.0130.004 | 0.1380.005 | 3153 | 1.490.03 | Kormendy & Ho (2013) | |
| NGC 1407 | 28.0 | 9.3 | 0.890.01 | 0.0930.006 | 2762 | 1.830.06 | Kormendy & Ho (2013) | |
| NGC 1550 | 51.6 | 4.6 | 1.150.02 | 0.5510.039 | 27010 | 0.910.01 | Kormendy & Ho (2013) | |
| NGC 3091 | 51.2 | 7.8 | 0.830.01 | 0.1650.023 | 29712 | 0.940.10 | Kormendy & Ho (2013) | |
| NGC 3842 | 92.2 | 12.9 | 1.060.03 | 0.0820.006 | 9.102.91 | 27027 | 5.150.84 | Saglia et al. (2016) |
| NGC 4291 | 26.6 | 2.8 | 0.490.03 | 0.0150.006 | 0.980.31 | 24212 | 0.200.02 | Kormendy & Ho (2013) |
| NGC 4486 | 16.7 | 6.6 | 1.6550.001 | 1.4440.004 | 32420 | 1.7050.002 | Kormendy & Ho (2013) | |
| NGC 4697 | 12.5 | 4.4 | 0.330.01 | 0.00150.0004 | 0.200.05 | 1778 | 0.210.08 | Kormendy & Ho (2013) |
| NGC 5077 | 38.7 | 3.3 | 0.600.05 | 0.0090.001 | 22211 | 0.630.19 | Kormendy & Ho (2013) | |
| NGC 5328 | 64.1 | 8.7 | 0.910.06 | 0.1680.020 | 33115 | 1.550.19 | van den Bosch (2016) | |
| NGC 5419 | 56.2 | 18.2 | 1.290.03 | 0.3150.019 | 7.242.40 | 3679 | 9.000.90 | Saglia et al. (2016) |
| NGC 5490 | 65.2 | 5.0 | 0.980.05 | 0.0840.010 | 25724 | 1.160.19 | van den Bosch (2016) | |
| NGC 5813 | 32.2 | 9.1 | 0.6890.001 | 0.4960.005 | 0.710.09 | 23011 | 1.010.01 | Saglia et al. (2016) |
| NGC 5846 | 24.9 | 6.3 | 0.7150.003 | 0.1720.007 | 1.100.15 | 23712 | 0.900.01 | Saglia et al. (2016) |
| NGC 7619 | 51.5 | 7.4 | 0.870.01 | 0.1240.001 | 2925 | 1.510.05 | Kormendy & Ho (2013) | |
| Non-BCGs | ||||||||
| NGC 541 | 63.7 | 8.3 | 0.720.03 | 0.0270.009 | 0.3890.305 | 1914 | – | van den Bosch (2016) |
| NGC 1374 | 19.2 | 1.7 | 0.860.19 | 0.00040.0002 | 1673 | – | Kormendy & Ho (2013) | |
| NGC 2892 | 86.2 | 6.8 | 0.640.09 | 0.0720.014 | 0.2690.068 | 29520 | – | van den Bosch (2016) |
| NGC 3377 | 11.0 | 2.3 | 0.190.03 | 0.00010.00003 | 0.180.09 | 1457 | – | Kormendy & Ho (2013) |
| NGC 3608 | 22.8 | 3.0 | 0.330.06 | 0.00130.0003 | 0.470.10 | 1829 | – | Kormendy & Ho (2013) |
| NGC 3862 | 84.6 | 12.0 | 0.380.04 | 0.0370.005 | 0.2570.219 | 20914 | – | van den Bosch (2016) |
| NGC 4374 | 18.5 | 3.7 | 0.730.01 | 0.0430.003 | 29614 | – | Kormendy & Ho (2013) | |
| NGC 4472 | 17.1 | 7.8 | 0.9870.001 | 0.3110.003 | 3007 | – | Kormendy & Ho (2013) | |
| NGC 4473 | 15.2 | 2.4 | 0.380.07 | 0.00050.0001 | 0.090.05 | 1909 | – | Kormendy & Ho (2013) |
| NGC 4552 | 15.3 | 2.8 | 0.650.01 | 0.02000.0002 | 0.500.06 | 25212 | – | Saglia et al. (2016) |
| NGC 4621 | 18.3 | 3.4 | 0.230.06 | 0.00030.0001 | 0.400.08 | 22511 | – | Saglia et al. (2016) |
| NGC 4649 | 16.5 | 7.9 | 0.9250.002 | 0.0980.002 | 38019 | – | Kormendy & Ho (2013) | |
| NGC 4751 | 26.9 | 3.3 | 0.400.09 | 0.0110.002 | 35514 | – | Kormendy & Ho (2013) | |
| NGC 5576 | 25.7 | 4.9 | 0.310.08 | 0.00090.0003 | 1839 | – | Kormendy & Ho (2013) | |
| NGC 7626 | 38.1 | 7.4 | 0.710.03 | 0.0390.013 | 0.3800.289 | 23411 | – | van den Bosch (2016) |
| UGC 1841 | 74.9 | 30.9 | 1.310.03 | 0.4180.058 | 0.2950.129 | 29527 | – | van den Bosch (2016) |
| Lenticulars | ||||||||
| NGC 193 | 49.7 | 6.8 | 0.770.03 | 0.0100.001 | 0.2510.185 | 18717 | – | van den Bosch (2016) |
| NGC 383 | 59.2 | 12.3 | 0.930.02 | 0.0600.013 | 0.5750.424 | 24017 | – | van den Bosch (2016) |
| NGC 524 | 24.2 | 3.6 | 0.500.05 | 0.0110.003 | 24712 | – | Kormendy & Ho (2013) | |
| NGC 1023 | 10.8 | 3.1 | 0.320.01 | 0.000560.00004 | 0.0420.004 | 20510 | – | Kormendy & Ho (2013) |
| NGC 3245 | 21.4 | 2.5 | 0.330.05 | 0.00180.0004 | 20510 | – | Kormendy & Ho (2013) | |
| NGC 3585 | 20.5 | 6.3 | 0.310.02 | 0.00230.0002 | 21311 | – | Kormendy & Ho (2013) | |
| NGC 3665 | 34.7 | 6.3 | 0.400.07 | 0.0110.002 | 0.5750.118 | 21910 | – | van den Bosch (2016) |
| NGC 4036 | 19.0 | 2.7 | 0.330.05 | 0.00190.0004 | 0.0770.064 | 1828 | – | van den Bosch (2016) |
| NGC 4203 | 14.1 | 2.6 | 0.290.04 | 0.00110.0002 | 0.0660.040 | 1296 | – | van den Bosch (2016) |
| NGC 4342 | 22.9 | 0.6 | 0.630.10 | 0.00030.0001 | 22511 | – | Kormendy & Ho (2013) | |
| NGC 4477 | 20.8 | 4.9 | 0.380.01 | 0.01070.0004 | 0.0350.024 | 1487 | – | van den Bosch (2016) |
| NGC 4526 | 16.4 | 3.5 | 0.340.02 | 0.00220.0002 | 22211 | – | Kormendy & Ho (2013) | |
| NGC 6861 | 27.3 | 2.1 | 0.800.02 | 0.0180.003 | 3893 | – | Kormendy & Ho (2013) | |
| Compact Relics | ||||||||
| Mrk 1216 | 97.0 | 2.3 | 0.910.03 | 0.280.09 | 4.91.7 | 324.115.6 | – | Walsh et al. (2017) |
| NGC 1277 | 56.9 | 1.4 | 1.020.06 | 0.200.01 | 4.91.6 | 250.015.3 | – | Walsh et al. (2016) |
2.2 X-ray Data Reduction and Analysis
The Chandra X-ray observations of all the galaxies were obtained from the High Energy Astrophysics Science Archive Research Centre (HEASARC). We used the Chandra Interactive Analysis of Observations (CIAO) software version 4.9 (Fruscione et al., 2006) and CALDB version 4.7.3 for all the data reduction and spectral extraction. For the spectral analysis, we used the X-ray spectral fitting package XSPEC version 12.9.1 (Arnaud, 1996) with ATOMDB version 3.0.7 (Foster et al., 2012). The data were reprocessed using the CIAO tool chandra_repro and time periods with strong background flares were removed using the CIAO script lc_clean. Point sources in the field were detected using the CIAO task wavdetect, verified by visual inspection of the X-ray images and finally removed from all the event files.
The X-ray spectra were extracted from circular regions within the half-light radius () i.e. the radius at which the integrated light is half of the total light emitted. For all the galaxies, the values were taken from van den Bosch (2016). We also extracted spectra for the central 10 kpc, 3 and 5 regions. For some of the galaxies, the 3 or 5 regions were found to be outside the field of view of the detector. These spectra were not used in the analysis (e.g., NGC 524). For NGC 3842, the deprojected temperature profile shows that the emission in the 3 or 5 regions are mostly dominated by the high temperature cluster plasma and therefore we did not use its spectra from these regions.
For all of the galaxies (except NGC 3842), the standard Chandra blanksky files were used to extract the background spectra. The matching blanksky event files were selected and reprojected to match the source observation coordinates. The time-dependent particle background levels were matched by scaling the blanksky spectra by the 9.5–12 keV count rate ratios of the source and blanksky observations. Due to projection effects, for NGC 3842 (A1367 BCG), the galactic X-ray emission was highly contaminated by the emission from the surrounding high temperature (4 keV) intracluster medium. Therefore, for NGC 3842, we used the data extracted from an annular region, just outside , for the background spectrum.
The X-ray spectrum for each galaxy was modeled with an absorbed single-temperature apec component that describes a thermal plasma in collisional ionization equilibrium. The temperature, metallicity, and spectrum normalization were included as free parameters (for details, see Lakhchaura et al., 2018). For the neutral hydrogen column density, we used the Swift Galactic tool, which uses the method of Willingale et al. (2013). The redshift was taken from the SIMBAD database (Wenger et al., 2000). An additional thermal bremsstrahlung component with a fixed temperature of 7.3 keV was used to model the unresolved point sources in the field (Irwin et al., 2003). The X-ray temperatures and the 0.5–7.0 keV luminosities for all 47 galaxies in our sample, determined within , are given in Table 1.
3 Results
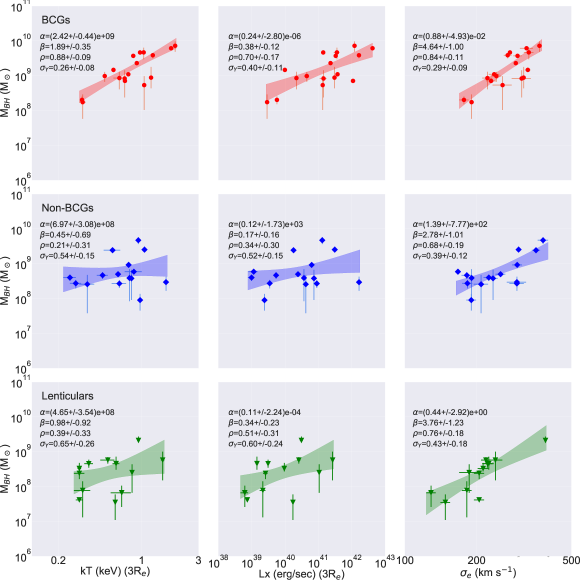
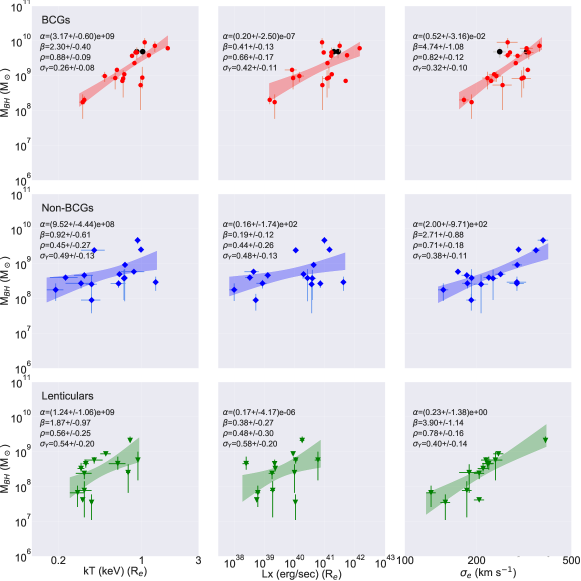
The correlations between , atmospheric gas temperature (), and X-ray luminosity () of the galactic atmospheres were determined using the linmix package (Kelly, 2007) in Python that uses a Bayesian linear regression method that accounts for measurement errors in both axes. The results of the correlation analyses, for the BCGs, non-BCGs, and lenticular galaxies within , are shown in Fig. 1. For comparison, the figure also shows the correlation of with the effective stellar velocity dispersion (Kormendy & Ho, 2013, ; taken from Saglia et al., 2016, , van den Bosch, 2016, and). The results of similar analyses within the central 10 kpc, 3 and 5 regions are shown in Figs. A.3, A.4 and A.5, respectively.
From Fig. 1, we see that for the BCGs, correlates strongly with within (/M(3.20.6) (/keV)2.3±0.4) with a correlation coefficient of 0.880.08 and intrinsic scatter of 0.260.08 dex. For the non-BCG elliptical and lenticular galaxies, the correlation is found to be weaker. correlates moderately with the X-ray luminosity in all sub-classes. In Figs. A.3, A.4 and A.5, we see very similar results also for the central 10 kpc, 3 and 5 regions, respectively. While for the BCGs the - correlation is found to be very strong at all radii, for the non-BCG ellipticals and lenticulars, the same correlation is found to be weak at and becomes even worse as we move out to larger radii. For the BCGs, correlates better with than with , at all radii. Note that, the observed - correlation for the BCGs is also much tighter (scatter 0.28 dex at all radii) than that with the large scale intracluster medium temperature (scatter 0.4-0.9 dex; see Bogdán et al., 2018; Phipps et al., 2019).
4 Discussion
The well known - correlation reflects the connection between and the stellar mass in the very centre of the galaxy, where the contribution of dark matter to the total mass is negligible. The break-down of the - correlation at the high mass end, in BCGs seen in the top right panel of Fig. 1, has been previously discussed (Kormendy & Ho, 2013; Hilz et al., 2012) and attributed to post-merger violent relaxation in systems undergoing a large number of mergers.
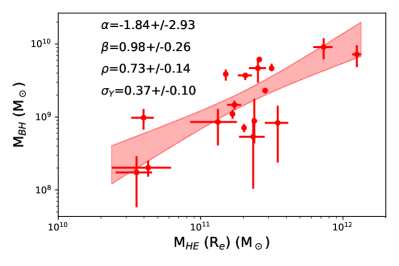
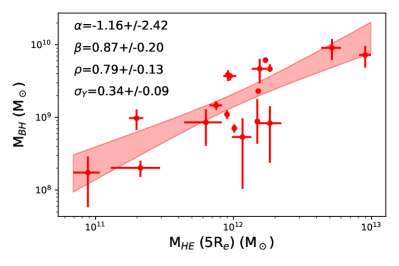
In hydrostatic equlibrium, reflects the total mass () of the galaxy and therefore, next to the strong correlation, we also expect a correlation between and for BCGs. We tested this by measuring the hydrostatic masses () of the BCGs within 5, calculated using the relation at ; where is the gravitational constant. The gas mass density () and the pressure gradient () at were determined by fitting the deprojected mass density and pressure profiles with powerlaw model fits. As shown in Fig. 2 (left), we find a moderately strong and almost linear (slope of ) correlation between and , with a coefficient of 0.790.13 and a scatter of 0.340.09 dex. We also calculated the hydrostatic masses within and 3 and obtained similar - correlations (see Fig. A.6). The observed scatter could be the result of the inherent uncertainty in the hydrostatic mass measurements due to non-thermal pressure support, which on average contributes –30% of the thermal pressure (Churazov et al., 2010). However, it may also be contributed by additional effects such as abundance gradients, uncertainties in the estimation of and other systematic uncertainties (Paggi et al., 2017). At the effective radii of BCGs, dark matter starts to become a significant component of the total mass budget (see Barnabè et al., 2011; Lovell et al., 2018)222The observational measurements of DM fraction () within are strongly sensitive to the adopted stellar initial mass function (IMF). For example, Barnabè et al. (2011) show that for the most massive early type galaxies ( ), similar to our BCGs, adopting the Salpeter IMF results in () of less than 50% while adopting the Chabrier IMF results in a significantly higher (¿60% ). and at larger radii of and , it becomes the dominant component. The observed moderately strong and almost-linear correlation between and , therefore, indicates that for the most massive galaxies in the centres of groups/clusters, the mass of the central SMBH also correlates with the underlying dark matter halo mass ().
We interpret this result in the light of state-of-the-art cosmological simulations. As discussed in the introduction, using results from the TNG300 simulations, Weinberger et al. (2018) found that for the growth of the most massive SMBHs ( ), mergers are the most important channel, with the most massive SMBHs ( ) undergoing 1000 mergers, presumably following the mergers of their host galaxies. Given that the BCGs in our sample are among the most massive galaxies in the Universe, the observed near-linear correlation between the total mass of the galaxy and the central SMBH could be a natural consequence of the non-causal coevolution of SMBHs and galaxies through mergers (Weinberger et al., 2018).
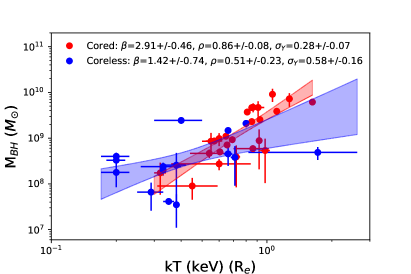
To investigate this further, we divided our sample into “core” and “coreless” galaxies based on the shape of their optical surface-brightness profiles. Using the information available in the literature (Pellegrini, 2005; Lauer et al., 2007; Hopkins et al., 2009; Krajnović et al., 2013; Kim & Fabbiano, 2015; Saglia et al., 2016; Forbes et al., 2017), we found 25 core and 16 coreless galaxies in our sample (most BCGs and slow-rotating non-BCG ellipticals are core galaxies, while the S0s and other fast rotating ellipticals are typically coreless). The - relations for the core and coreless galaxies are shown in Fig. 2 (right). The core galaxies are found to have a very strong - correlation (correlation coefficient 0.9, intrinsic scatter 0.3) while the coreless galaxies are found to have a weak - correlation (correlation coefficient 0.5, intrinsic scatter 0.6). The cores seen in the optical surface-brightness profiles of mostly elliptical galaxies, are believed to have formed by the stellar excavation accompanying the orbital decay of the binary SMBHs that form as a result of dissipationless (“dry") mergers of their host galaxies. The coreless galaxies, on the other hand, are believed to have gone through dissipative (“wet") mergers (Kormendy et al., 2009). The observed tight - correlation for the core galaxies could therefore be a natural consequence of the large number of dry galaxy mergers followed by the gradual inspiral and merger of their SMBHs.
The - correlation could also be affected by AGN feedback. The - correlation for early type galaxies is found to have a much steeper slope than the value expected based on self-similar evolution (1.5; see Babyk et al., 2018). The relativistic jets emanating from the central AGN in BCGs are likely to increase the temperature with respect to the virial equilibrium value. This effect is expected to be more pronounced in the low-mass galaxies than the high-mass systems (Goulding et al., 2016), which can explain the steepening of the - relation (Babyk et al., 2018). While it is non-trivial to assess the exact impact of AGN feedback on the host galaxies, it most likely plays a secondary role in producing the observed - correlation.
The low-mass non-BCGs and lenticular galaxies do not show a strong - correlation. This may imply that because of the fewer mergers, the applicability of the central limit theorem is limited and the - correlation is weaker in these low-mass systems. However, the lack of the - relation does not need to necessarily imply the lack of the - correlation. In fact, the modest - correlation observed for all three classes of galaxies suggests that the - correlation might be in place for all galaxies in our sample. Due to their smaller gravitational potentials, non-BCGs and lenticulars are more sensitive to feedback (Kim & Fabbiano, 2013, 2015; Goulding et al., 2016) and for a significant fraction of the lower mass galaxies, the X-ray atmospheres may be in an outflow state (Pellegrini et al., 2018). Ram-pressure stripping of non-BCG galaxies moving through the intra-cluster medium can remove a significant fraction of the galactic atmospheres, altering the thermal state of the gas. These systems, therefore, may not be in hydrostatic equilibrium and their atmospheric temperatures may not accurately reflect the gravitational potential of the host galaxies.
Finally, although mergers and central limit theorem can provide a plausible non-causal explanation for the observed -/- correlation, a pure merger picture has a difficulty to account for a class of massive compact ‘relic’ galaxies. These galaxies observed at z0, are likely the remnants of the progenitors of giant ellipticals, which remained largely untouched by mergers since their early, rapid dissipative growth (e.g. Trujillo et al., 2014; Ferré-Mateu et al., 2017; Werner et al., 2018; Buote & Barth, 2018, 2019). Fig. 1 shows that the two well-studied massive ‘relic’ galaxies, NGC 1277 and Mrk 1216, lie on the tight - correlation for BCGs. This result is puzzling, because those relic galaxies are believed to have avoided the stage of growth by dry mergers, which suggests that an initial correlation between SMBHs and DM halos could have already existed early in the evolution of these galaxies, following the formation of their X-ray atmospheres. This is consistent with the predictions of the EAGLE simulations, where the rapid growth of black holes following the formation of hot atmospheres (see Bower et al., 2017; McAlpine et al., 2018) results in an which is determined by the binding energy of the halo (see Booth & Schaye, 2010, 2011). For BCGs, such an initial correlation could have been subsequently strengthened via numerous gas-free mergers with galaxies hosting central SMBHs. For high-mass galaxies, this scenario implies an - correlation throughout most of the lifetime of the Universe.
5 ACKNOWLEDGEMENT
We are grateful to the referee for the constructive feedback that helped us improve the manuscript significantly. This work was supported by the Lendület LP2016-11 grant awarded by the Hungarian Academy of Sciences. The scientific results reported here are based to a significant degree on data, software and web tools obtained from the High Energy Astrophysics Science Archive Research Center (HEASARC), a service of the Astrophysics Science Division at NASA/GSFC and of the Smithsonian Astrophysical Observatory’s High Energy Astrophysics Division. The results are based on observations made by the Chandra X-ray Observatory. We thank J. Kormendy, E. Churazov and F. Mernier for useful discussions.
References
- Arnaud (1996) Arnaud K. A., 1996, in Jacoby G. H., Barnes J., eds, Astronomical Society of the Pacific Conference Series Vol. 101, Astronomical Data Analysis Software and Systems V. p. 17
- Babyk et al. (2018) Babyk I. V., McNamara B. R., Nulsen P. E. J., Hogan M. T., Vantyghem A. N., Russell H. R., Pulido F. A., Edge A. C., 2018, ApJ, 857, 32
- Baes et al. (2003) Baes M., Buyle P., Hau G. K. T., Dejonghe H., 2003, MNRAS, 341, L44
- Barnabè et al. (2011) Barnabè M., Czoske O., Koopmans L. V. E., Treu T., Bolton A. S., 2011, MNRAS, 415, 2215
- Bassini et al. (2019) Bassini L., et al., 2019, arXiv e-prints, p. arXiv:1903.03142
- Bogdán et al. (2018) Bogdán Á., Lovisari L., Volonteri M., Dubois Y., 2018, ApJ, 852, 131
- Booth & Schaye (2010) Booth C. M., Schaye J., 2010, MNRAS, 405, L1
- Booth & Schaye (2011) Booth C. M., Schaye J., 2011, MNRAS, 413, 1158
- Bower et al. (2017) Bower R. G., Schaye J., Frenk C. S., Theuns T., Schaller M., Crain R. A., McAlpine S., 2017, MNRAS, 465, 32
- Buote & Barth (2018) Buote D. A., Barth A. J., 2018, ApJ, 854, 143
- Buote & Barth (2019) Buote D. A., Barth A. J., 2019, arXiv:1902.02938,
- Churazov et al. (2005) Churazov E., Sazonov S., Sunyaev R., Forman W., Jones C., Böhringer H., 2005, MNRAS, 363, L91
- Churazov et al. (2010) Churazov E., et al., 2010, MNRAS, 404, 1165
- Ferrarese (2002) Ferrarese L., 2002, ApJ, 578, 90
- Ferrarese & Merritt (2000) Ferrarese L., Merritt D., 2000, ApJ, 539, L9
- Ferré-Mateu et al. (2017) Ferré-Mateu A., Trujillo I., Martín-Navarro I., Vazdekis A., Mezcua M., Balcells M., Domínguez L., 2017, MNRAS, 467, 1929
- Forbes et al. (2017) Forbes D. A., Sinpetru L., Savorgnan G., Romanowsky A. J., Usher C., Brodie J., 2017, MNRAS, 464, 4611
- Foster et al. (2012) Foster A. R., Ji L., Smith R. K., Brickhouse N. S., 2012, ApJ, 756, 128
- Fruscione et al. (2006) Fruscione A., et al., 2006, in Society of Photo-Optical Instrumentation Engineers (SPIE) Conference Series. p. 62701V, doi:10.1117/12.671760
- Gaspari et al. (2019) Gaspari M., et al., 2019, arXiv e-prints, p. arXiv:1904.10972
- Gebhardt et al. (2000) Gebhardt K., et al., 2000, ApJ, 539, L13
- Goulding et al. (2016) Goulding A. D., et al., 2016, ApJ, 826, 167
- Hilz et al. (2012) Hilz M., Naab T., Ostriker J. P., Thomas J., Burkert A., Jesseit R., 2012, MNRAS, 425, 3119
- Hopkins et al. (2009) Hopkins P. F., Lauer T. R., Cox T. J., Hernquist L., Kormendy J., 2009, ApJS, 181, 486
- Irwin et al. (2003) Irwin J. A., Athey A. E., Bregman J. N., 2003, ApJ, 587, 356
- Jahnke & Macciò (2011) Jahnke K., Macciò A. V., 2011, ApJ, 734, 92
- Kelly (2007) Kelly B. C., 2007, ApJ, 665, 1489
- Kim & Fabbiano (2013) Kim D.-W., Fabbiano G., 2013, ApJ, 776, 116
- Kim & Fabbiano (2015) Kim D.-W., Fabbiano G., 2015, ApJ, 812, 127
- King (2003) King A., 2003, ApJ, 596, L27
- Kormendy & Bender (2011) Kormendy J., Bender R., 2011, Nature, 469, 377
- Kormendy & Ho (2013) Kormendy J., Ho L. C., 2013, ARA&A, 51, 511
- Kormendy et al. (2009) Kormendy J., Fisher D. B., Cornell M. E., Bender R., 2009, ApJS, 182, 216
- Krajnović et al. (2013) Krajnović D., et al., 2013, MNRAS, 433, 2812
- Lakhchaura et al. (2018) Lakhchaura K., et al., 2018, MNRAS, 481, 4472
- Lauer et al. (2007) Lauer T. R., et al., 2007, ApJ, 664, 226
- Lovell et al. (2018) Lovell M. R., et al., 2018, MNRAS, 481, 1950
- Magorrian et al. (1998) Magorrian J., et al., 1998, AJ, 115, 2285
- McAlpine et al. (2018) McAlpine S., Bower R. G., Rosario D. J., Crain R. A., Schaye J., Theuns T., 2018, MNRAS, 481, 3118
- Paggi et al. (2017) Paggi A., et al., 2017, ApJ, 844, 5
- Pellegrini (2005) Pellegrini S., 2005, MNRAS, 364, 169
- Pellegrini et al. (2018) Pellegrini S., Ciotti L., Negri A., Ostriker J. P., 2018, ApJ, 856, 115
- Peng et al. (2007) Peng T.-C., Wyrowski F., van der Tak F., Walmsley M., Weiss A., Menten K. M., 2007, in Molecules in Space and Laboratory. p. 34
- Phipps et al. (2019) Phipps F., Bogdan A., Lovisari L., Kovacs O. E., Volonteri M., Dubois Y., 2019, arXiv:1903.09965,
- Saglia et al. (2016) Saglia R. P., et al., 2016, ApJ, 818, 47
- Silk & Rees (1998) Silk J., Rees M. J., 1998, A&A, 331, L1
- Trujillo et al. (2014) Trujillo I., Ferré-Mateu A., Balcells M., Vazdekis A., Sánchez-Blázquez P., 2014, ApJ, 780, L20
- Volonteri et al. (2011) Volonteri M., Natarajan P., Gültekin K., 2011, ApJ, 737, 50
- Walsh et al. (2016) Walsh J. L., van den Bosch R. C. E., Gebhardt K., Yıldırım A., Richstone D. O., Gültekin K., Husemann B., 2016, ApJ, 817, 2
- Walsh et al. (2017) Walsh J. L., van den Bosch R. C. E., Gebhardt K., Yıldırım A., Gültekin K., Husemann B., Richstone D. O., 2017, ApJ, 835
- Weinberger et al. (2018) Weinberger R., et al., 2018, MNRAS, 479, 4056
- Wenger et al. (2000) Wenger M., et al., 2000, A&AS, 143, 9
- Werner et al. (2018) Werner N., Lakhchaura K., Canning R. E. A., Gaspari M., Simionescu A., 2018, MNRAS, 477, 3886
- Willingale et al. (2013) Willingale R., Starling R. L. C., Beardmore A. P., Tanvir N. R., O’Brien P. T., 2013, MNRAS, 431, 394
- van den Bosch (2016) van den Bosch R. C. E., 2016, ApJ, 831, 134